 RSS Feed
 by Calculated Risk on 5/26/2020 01:54:00 PM
Tuesday, May 26, 2020
A few Comments on April New Home Sales
New home sales for April were reported at 623,000 on a seasonally adjusted annual rate basis (SAAR). Sales for the previous three months were revised down.
This was well above consensus expectations. I've long argued that new home sales and housing starts (especially single family starts) were some of the best leading indicators for the economy. However, I've noted that there are times when this isn't true. NOW is one of those times. The course of the economy will be determined by the course of the virus, and New Home Sales tell us nothing about the future of the pandemic.
Earlier: New Home Sales at 623,000 Annual Rate in April.
 Click on graph for larger image.
This graph shows new home sales for 2019 and 2020 by month (Seasonally Adjusted Annual Rate).
New home sales were down 6.2% year-over-year (YoY) in April. Year-to-date (YTD) sales are still up 1.4%, but sales will be down YTD soon (although the comparison to May of last year is pretty easy).
And here is another update to the "distressing gap" graph that I first started posting a number of years ago to show the emerging gap caused by distressed sales.
 The "distressing gap" graph shows existing home sales (left axis) and new home sales (right axis) through April 2020. This graph starts in 1994, but the relationship had been fairly steady back to the '60s.
Following the housing bubble and bust, the "distressing gap" appeared mostly because of distressed sales.
Now the gap is mostly closed. However, this assumes that the builders will offer some smaller, less expensive homes.
Note: Existing home sales are counted when transactions are closed, and new home sales are counted when contracts are signed. So the timing of sales is different.
Dallas Fed: "Contraction Continues in Texas Manufacturing Sector"
by Calculated Risk on 5/26/2020 10:40:00 AM
From the Dallas Fed: Contraction Continues in Texas Manufacturing Sector, Though Severity Eases
Texas factory activity declined again in May, though at a slower pace than in April, according to business executives responding to the Texas Manufacturing Outlook Survey. The production index, a key measure of state manufacturing conditions, remained negative but improved from -55.6 to -28.0, suggesting the contraction in output has eased somewhat since last month.The last of the regional Fed surveys for May will be released later this week (Richmond and Kansas City Fed)
Other measures of manufacturing activity pointed to a less-severe decline in May. The new orders index advanced 38 points to -30.6, its highest reading in three months, with more than 20 percent of manufacturers noting an increase in orders. Similarly, the growth rate of orders index pushed up more than 30 points to -30.8. The capacity utilization and shipments indexes also remained negative at -26.0 and -25.7, respectively, but were up from March and April.
Perceptions of broader business conditions remained negative but were somewhat less pessimistic in May. The general business activity index moved up from -74.0 to -49.2. Similarly, the company outlook index moved up nearly 30 points to -34.6, though only 12 percent of manufacturers noted improved outlooks. The index measuring uncertainty regarding companies’ outlooks retreated notably to 28.3, though the positive reading still indicates increased uncertainty.
Labor market measures indicated further employment declines and shorter workweeks this month. The employment index remained negative but rose from -22.0 to -11.5. Eight percent of firms noted net hiring, while 19 percent noted net layoffs. The hours worked index rose 18 points to -22.8, with the still-negative reading signaling reduced workweek length.
emphasis added
New Home Sales at 623,000 Annual Rate in April
by Calculated Risk on 5/26/2020 10:17:00 AM
The Census Bureau reports New Home Sales in April were at a seasonally adjusted annual rate (SAAR) of 623 thousand.
The previous three months were revised down.
Sales of new single-family houses in April 2020 were at a seasonally adjusted annual rate of 623,000, according to estimates released jointly today by the U.S. Census Bureau and the Department of Housing and Urban Development. This is 0.6 percent above the revised March rate of 619,000, but is 6.2 percent below the April 2019 estimate of 664,000."
emphasis added
 Click on graph for larger image.
The first graph shows New Home Sales vs. recessions since 1963. The dashed line is the current sales rate.
New Home Sales haven't fallen as much as expected during the COVID crisis.
The second graph shows New Home Months of Supply.
 The months of supply decreased in April to 6.3 months from 6.4 months in March.
 The all time record was 12.1 months of supply in January 2009.
This is slightly above the normal range (less than 6 months supply is normal).
"The seasonally-adjusted estimate of new houses for sale at the end of April was 325,000. This represents a supply of 6.3 months at the current sales rate."
 On inventory, according to the Census Bureau:
 "A house is considered for sale when a permit to build has been issued in permit-issuing places or work has begun on the footings or foundation in nonpermit areas and a sales contract has not been signed nor a deposit accepted."Starting in 1973 the Census Bureau broke this down into three categories: Not Started, Under Construction, and Completed.
The third graph shows the three categories of inventory starting in 1973.
The inventory of completed homes for sale is still somewhat low, and the combined total of completed and under construction is close to normal.
 The last graph shows sales NSA (monthly sales, not seasonally adjusted annual rate).
In April 2020 (red column), 59 thousand new homes were sold (NSA). Last year, 64 thousand homes were sold in April.
The all time high for April was 116 thousand in 2005, and the all time low for April was 30 thousand in 2011.
This was well above expectations of 490 thousand sales SAAR, however sales in the three previous months were revised down. I'll have more later today.
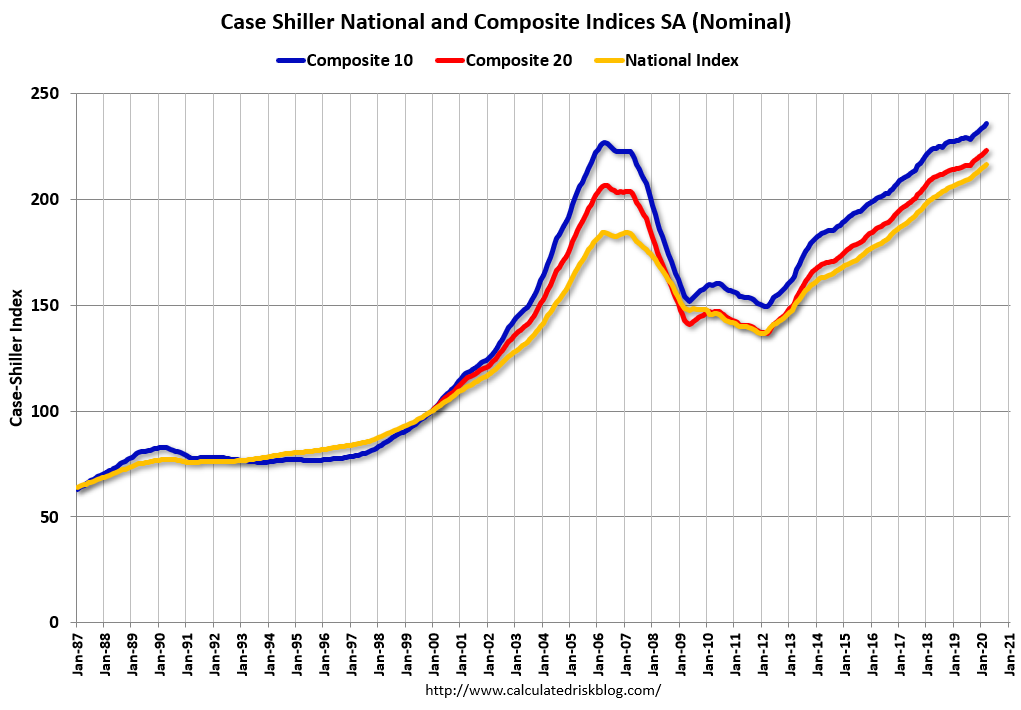
Case-Shiller: National House Price Index increased 4.4% year-over-year in March
by Calculated Risk on 5/26/2020 09:10:00 AM
Note: This is for March and is mostly pre-crisis data.
S&P/Case-Shiller released the monthly Home Price Indices for March ("March" is a 3 month average of January, February and March prices).
This release includes prices for 20 individual cities, two composite indices (for 10 cities and 20 cities) and the monthly National index.
Note: Case-Shiller reports Not Seasonally Adjusted (NSA), I use the SA data for the graphs.
From S&P: Annual Home Price Gains Increased to 4.4% in March According to S&P CoreLogic Case-Shiller Index
The S&P CoreLogic Case-Shiller U.S. National Home Price NSA Index, covering all nine U.S. census divisions, reported a 4.4% annual gain in March, up from 4.2% in the previous month. The 10-City Composite annual increase came in at 3.4%, up from 3.0% in the previous month. The 20-City Composite posted a 3.9% year-over-year gain, up from 3.5% in the previous month.
Phoenix, Seattle and Charlotte reported the highest year-over-year gains among the 19 cities (excluding Detroit for the month). In March, Phoenix led the way with an 8.2% year-over-year price increase, followed by Seattle with a 6.9% increase and Charlotte with a 5.8% increase. Seventeen of the 19 cities reported higher price increases in the year ending March 2020 versus the year ending February 2020.
...
The National Index posted a 0.8% month-over-month increase, while the 10-City and 20-City Composites posted increases of 1.0% and 1.1% respectively before seasonal adjustment in March. After seasonal adjustment, the National Index and the 20-City Composite posted a month-over-month increase of 0.5%, while the 10-City Composite a posted 0.4% increase. In March, all 19 cities (excluding Detroit) reported increases before seasonal adjustment as well as after seasonal adjustment.
"March’s data witnessed the first impact of the COVID-19 pandemic on the S&P CoreLogic Case-Shiller Indices,” says Craig J. Lazzara, Managing Director and Global Head of Index Investment Strategy at S&P Dow Jones Indices. “We have data from only 19 cities this month, since transactions records for Wayne County, Michigan (in the Detroit metropolitan area) were unavailable.
“That said, housing prices continue to be remarkably stable. The National Composite Index rose by 4.4% in March 2020, with comparable growth in the 10- and 20-City Composites (up 3.4% and 3.9%, respectively). In all three cases, March’s year-over-year gains were ahead of February’s, continuing a trend of gently accelerating home prices that began last autumn. March results were broad-based. Prices rose in each of the 19 cities for which we have reported data, and price increases accelerated in 17 cities.
emphasis added
 Click on graph for larger image.
 The first graph shows the nominal seasonally adjusted Composite 10, Composite 20 and National indices (the Composite 20 was started in January 2000).
The Composite 10 index is up 3.9% from the bubble peak, and up 0.4% in March (SA) from February.
The Composite 20 index is 8.0% above the bubble peak, and up 0.5% (SA) in March.
The National index is 17% above the bubble peak (SA), and up 0.5% (SA) in March. The National index is up 59% from the post-bubble low set in December 2011 (SA).
 The second graph shows the Year over year change in all three indices.
The Composite 10 SA is up 3.3% compared to March 2019. The Composite 20 SA is up 3.9% year-over-year.
The National index SA is up 4.4% year-over-year.
Note: According to the data, prices increased in 19 of 20 cities month-over-month seasonally adjusted.
I'll have more later.
"Chicago Fed National Activity Index suggests economic growth fell substantially in April"
by Calculated Risk on 5/26/2020 08:36:00 AM
From the Chicago Fed: Chicago Fed National Activity Index suggests economic growth fell substantially in April
Led by declines in production- and employment-related indicators, the Chicago Fed National Activity Index (CFNAI) fell to –16.74 in April from –4.97 in March. All four broad categories of indicators used to construct the index made negative contributions in April, and all four categories decreased from March. The index’s three-month moving average, CFNAI-MA3, decreased to –7.22 in April from –1.69 in March. Following a period of economic expansion, an increasing likelihood of a recession has historically been associated with a CFNAI-MA3 value below –0.70.This graph shows the Chicago Fed National Activity Index (three month moving average) since 1967.
emphasis added
 Click on graph for larger image.
This suggests economic activity was in a recession starting in March (using the three-month average).
According to the Chicago Fed:
The index is a weighted average of 85 indicators of growth in national economic activity drawn from four broad categories of data: 1) production and income; 2) employment, unemployment, and hours; 3) personal consumption and housing; and 4) sales, orders, and inventories.
...
A zero value for the monthly index has been associated with the national economy expanding at its historical trend (average) rate of growth; negative values with below-average growth (in standard deviation units); and positive values with above-average growth.
Monday, May 25, 2020
Tuesday: New Home Sales, Case-Shiller House Prices
by Calculated Risk on 5/25/2020 10:13:00 PM
Weekend:
• Schedule for Week of May 24, 2020
Tuesday:
• At 8:30 AM ET: Chicago Fed National Activity Index for April. This is a composite index of other data.
• At 9:00 AM: S&P/Case-Shiller House Price Index for March. The consensus is for a 3.3% year-over-year increase in the Comp 20 index for March.
• At 9:00 AM: FHFA House Price Index for March 2020. This was originally a GSE only repeat sales, however there is also an expanded index.
• At 10:00 AM: New Home Sales for April from the Census Bureau. The consensus is for 490 thousand SAAR, down from 627 thousand in March.
10:30 AM: Dallas Fed Survey of Manufacturing Activity for May.
From CNBC: Pre-Market Data and Bloomberg futures S&P 500 are up 42 and DOW futures are up 350 (fair value).
Oil prices were up over the last week with WTI futures at $34.01 per barrel and Brent at $35.87 barrel. A year ago, WTI was at $58, and Brent was at $68 - so WTI oil prices are about 40% year-over-year.
Here is a graph from Gasbuddy.com for nationwide gasoline prices. Nationally prices are at $1.97 per gallon. A year ago prices were at $2.83 per gallon, so gasoline prices are down $0.86 per gallon year-over-year.
May 25 COVID-19 Test Results: Progress
by Calculated Risk on 5/25/2020 10:02:00 PM
In late April, Dr. Fauci said the US might be able to test 400,000 to 600,000 people per day sometime in May, and testing is now close to that range. This might be enough to allow test-and-trace in some areas. However, the US might need more than 900,000 tests per day according to Dr. Jha of Harvard's Global Health Institute.
There were 441,248 test results reported over the last 24 hours.
 Click on graph for larger image.
This data is from the COVID Tracking Project.
The percent positive over the last 24 hours was 4.3% (red line). The US probably needs enough tests to keep the percentage positive well below 5%. (probably much lower based on testing in New Zealand).
Six High Frequency Indicators for the Eventual Recovery
by Calculated Risk on 5/25/2020 10:03:00 AM
These indicators are mostly for travel and entertainment - some of the sectors that will probably recover very slowly.
The TSA is providing daily travel numbers.
 Click on graph for larger image.
This data shows the daily total traveler throughput from the TSA for 2019 (Blue) and 2020 (Red).
On May 24th there were 267,451 travelers compared to 2,070,716 a year ago.
That is a decline of 87.1%. There has been some increase off the bottom, but it is pretty small compared to the normal level of travel.
The second graph shows the year-over-year change in diners as tabulated by OpenTable for the US and several selected cities.
 Thanks to OpenTable for providing this restaurant data:
This data is updated through May 23, 2020.
The US was off 100% YoY as of March 21st.
California and New York are still off 100%.
Some states - like Texas and Georgia - have started to open up. In Texas, diner traffic was only down 63% YoY.
 This data shows domestic box office for each week (red) and the maximum and minimum for the previous four years. Data is from BoxOfficeMojo.
Note that the data is noisy and depends on when blockbusters are released.
Movie ticket sales have been essentially at zero for nine weeks.
Basically movie theaters are closed all across the country, and will probably reopen slowly (probably with limited seating at first).
The following graph shows the seasonal pattern for the hotel occupancy rate using the four week average.
 The red line is for 2020, dash light blue is 2019, blue is the median, and black is for 2009 (the worst year probably since the Great Depression for hotels).
2020 was off to a solid start, however, COVID-19 has crushed hotel occupancy.
Notes: Y-axis doesn't start at zero to better show the seasonal change.
STR reported hotel occupancy was off 54.1% year-over-year last week. Occupancy has increased slightly over the last few of weeks.
 This graph, based on weekly data from the U.S. Energy Information Administration (EIA), shows the year-over-year change in gasoline consumption.
At one point, gasoline consumption was off almost 50% YoY.
As of May 15th, gasoline consumption was off about 20% YoY (about 72% of normal).
The final graph is from Apple mobility.
 This data is through May 22nd for the United States.
According to the Apple data, driving is back to normal, walking is close to normal, but public transit is still off 64% from the pre-crisis level.
Sunday, May 24, 2020
May 24 COVID-19 Test Results
by Calculated Risk on 5/24/2020 05:30:00 PM
In late April, Dr. Fauci said the US might be able to test 400,000 to 600,000 people per day sometime in May, and testing is now close to that range. This might be enough to allow test-and-trace in some areas. However, the US might need more than 900,000 tests per day according to Dr. Jha of Harvard's Global Health Institute.
There were 379,129 test results reported over the last 24 hours.
 Click on graph for larger image.
This data is from the COVID Tracking Project.
The percent positive over the last 24 hours was 5.5% (red line). The US probably needs enough tests to keep the percentage positive well below 5%. (probably much lower based on testing in New Zealand).
Economic Outlook: Not Sanguine
by Calculated Risk on 5/24/2020 11:08:00 AM
On March 31st, I wrote:
This is a healthcare crisis, and the economic outlook is based on presumptions about the course of the pandemic.Unfortunately the course of the pandemic has been worse than I expected. Although social distancing clearly worked in slowing the growth rate of infections, many people have recently relaxed their guard - and COVID-19 cases, hospitalizations and deaths are still rising in many parts of the country.
Stories like this are concerning: Arkansas governor says several people who attended pool party infected with COVID-19
Several people who attended a swim party in Arkansas have contracted coronavirus, Gov. Asa Hutchinson (R) confirmed Saturday.It is possible to open the economy without an increase in infections. For example, in Japan, the economy is mostly open, however 1) everyone wears a mask, 2) there is robust contact tracing, and 3) everyone is urged to follow the 3 C's (avoid Closed spaces, Crowded places, and Close-Contact settings) (Cool graphic!).
"There were positive cases coming out of a high school swim party. A high school swim party that I'm sure everybody thought was harmless. They're young, they're swimming, they're just having activity and positive cases resulted from that," the governor told reporters Saturday.
However, in the US, contact tracing is still ramping up, many people aren't wearing a mask or face covering, and - based on many stories like above - people are not following the 3Cs.
Since the course of the economy will be determined by the course of the virus, I'm not currently sanguine about the economic outlook.


