 RSS Feed
 by Calculated Risk on 5/26/2020 09:10:00 AM
Tuesday, May 26, 2020
Case-Shiller: National House Price Index increased 4.4% year-over-year in March
Note: This is for March and is mostly pre-crisis data.
S&P/Case-Shiller released the monthly Home Price Indices for March ("March" is a 3 month average of January, February and March prices).
This release includes prices for 20 individual cities, two composite indices (for 10 cities and 20 cities) and the monthly National index.
Note: Case-Shiller reports Not Seasonally Adjusted (NSA), I use the SA data for the graphs.
From S&P: Annual Home Price Gains Increased to 4.4% in March According to S&P CoreLogic Case-Shiller Index
The S&P CoreLogic Case-Shiller U.S. National Home Price NSA Index, covering all nine U.S. census divisions, reported a 4.4% annual gain in March, up from 4.2% in the previous month. The 10-City Composite annual increase came in at 3.4%, up from 3.0% in the previous month. The 20-City Composite posted a 3.9% year-over-year gain, up from 3.5% in the previous month.
Phoenix, Seattle and Charlotte reported the highest year-over-year gains among the 19 cities (excluding Detroit for the month). In March, Phoenix led the way with an 8.2% year-over-year price increase, followed by Seattle with a 6.9% increase and Charlotte with a 5.8% increase. Seventeen of the 19 cities reported higher price increases in the year ending March 2020 versus the year ending February 2020.
...
The National Index posted a 0.8% month-over-month increase, while the 10-City and 20-City Composites posted increases of 1.0% and 1.1% respectively before seasonal adjustment in March. After seasonal adjustment, the National Index and the 20-City Composite posted a month-over-month increase of 0.5%, while the 10-City Composite a posted 0.4% increase. In March, all 19 cities (excluding Detroit) reported increases before seasonal adjustment as well as after seasonal adjustment.
"March’s data witnessed the first impact of the COVID-19 pandemic on the S&P CoreLogic Case-Shiller Indices,” says Craig J. Lazzara, Managing Director and Global Head of Index Investment Strategy at S&P Dow Jones Indices. “We have data from only 19 cities this month, since transactions records for Wayne County, Michigan (in the Detroit metropolitan area) were unavailable.
“That said, housing prices continue to be remarkably stable. The National Composite Index rose by 4.4% in March 2020, with comparable growth in the 10- and 20-City Composites (up 3.4% and 3.9%, respectively). In all three cases, March’s year-over-year gains were ahead of February’s, continuing a trend of gently accelerating home prices that began last autumn. March results were broad-based. Prices rose in each of the 19 cities for which we have reported data, and price increases accelerated in 17 cities.
emphasis added
 Click on graph for larger image.
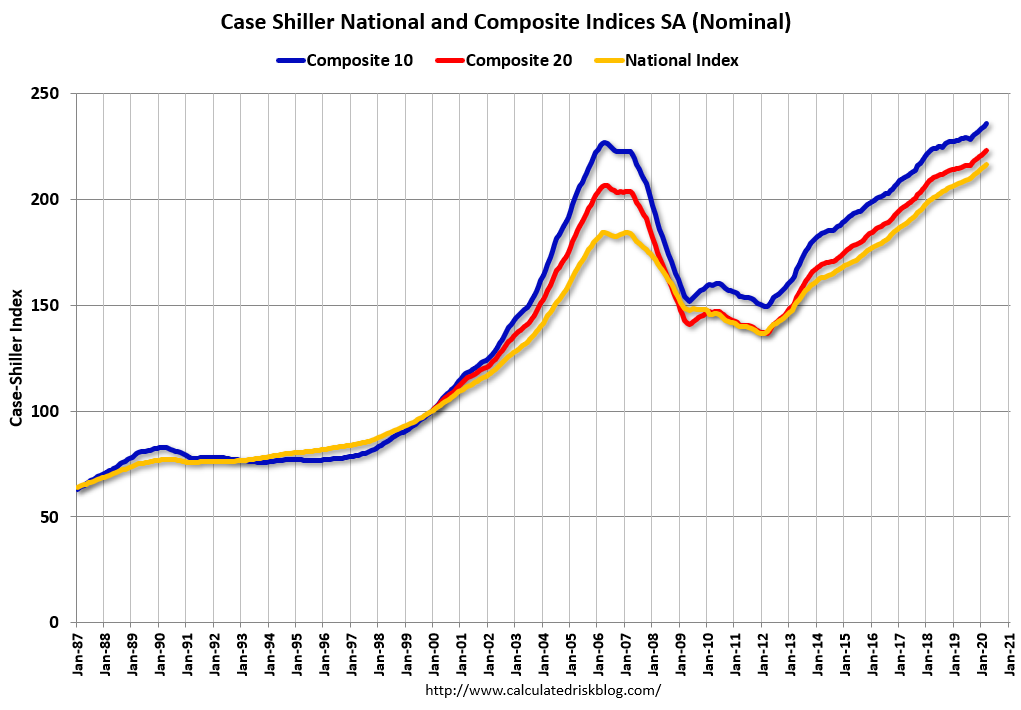
 The first graph shows the nominal seasonally adjusted Composite 10, Composite 20 and National indices (the Composite 20 was started in January 2000).
The Composite 10 index is up 3.9% from the bubble peak, and up 0.4% in March (SA) from February.
The Composite 20 index is 8.0% above the bubble peak, and up 0.5% (SA) in March.
The National index is 17% above the bubble peak (SA), and up 0.5% (SA) in March. The National index is up 59% from the post-bubble low set in December 2011 (SA).
 The second graph shows the Year over year change in all three indices.
The Composite 10 SA is up 3.3% compared to March 2019. The Composite 20 SA is up 3.9% year-over-year.
The National index SA is up 4.4% year-over-year.
Note: According to the data, prices increased in 19 of 20 cities month-over-month seasonally adjusted.
I'll have more later.
"Chicago Fed National Activity Index suggests economic growth fell substantially in April"
by Calculated Risk on 5/26/2020 08:36:00 AM
From the Chicago Fed: Chicago Fed National Activity Index suggests economic growth fell substantially in April
Led by declines in production- and employment-related indicators, the Chicago Fed National Activity Index (CFNAI) fell to –16.74 in April from –4.97 in March. All four broad categories of indicators used to construct the index made negative contributions in April, and all four categories decreased from March. The index’s three-month moving average, CFNAI-MA3, decreased to –7.22 in April from –1.69 in March. Following a period of economic expansion, an increasing likelihood of a recession has historically been associated with a CFNAI-MA3 value below –0.70.This graph shows the Chicago Fed National Activity Index (three month moving average) since 1967.
emphasis added
 Click on graph for larger image.
This suggests economic activity was in a recession starting in March (using the three-month average).
According to the Chicago Fed:
The index is a weighted average of 85 indicators of growth in national economic activity drawn from four broad categories of data: 1) production and income; 2) employment, unemployment, and hours; 3) personal consumption and housing; and 4) sales, orders, and inventories.
...
A zero value for the monthly index has been associated with the national economy expanding at its historical trend (average) rate of growth; negative values with below-average growth (in standard deviation units); and positive values with above-average growth.
Monday, May 25, 2020
Tuesday: New Home Sales, Case-Shiller House Prices
by Calculated Risk on 5/25/2020 10:13:00 PM
Weekend:
• Schedule for Week of May 24, 2020
Tuesday:
• At 8:30 AM ET: Chicago Fed National Activity Index for April. This is a composite index of other data.
• At 9:00 AM: S&P/Case-Shiller House Price Index for March. The consensus is for a 3.3% year-over-year increase in the Comp 20 index for March.
• At 9:00 AM: FHFA House Price Index for March 2020. This was originally a GSE only repeat sales, however there is also an expanded index.
• At 10:00 AM: New Home Sales for April from the Census Bureau. The consensus is for 490 thousand SAAR, down from 627 thousand in March.
10:30 AM: Dallas Fed Survey of Manufacturing Activity for May.
From CNBC: Pre-Market Data and Bloomberg futures S&P 500 are up 42 and DOW futures are up 350 (fair value).
Oil prices were up over the last week with WTI futures at $34.01 per barrel and Brent at $35.87 barrel. A year ago, WTI was at $58, and Brent was at $68 - so WTI oil prices are about 40% year-over-year.
Here is a graph from Gasbuddy.com for nationwide gasoline prices. Nationally prices are at $1.97 per gallon. A year ago prices were at $2.83 per gallon, so gasoline prices are down $0.86 per gallon year-over-year.
May 25 COVID-19 Test Results: Progress
by Calculated Risk on 5/25/2020 10:02:00 PM
In late April, Dr. Fauci said the US might be able to test 400,000 to 600,000 people per day sometime in May, and testing is now close to that range. This might be enough to allow test-and-trace in some areas. However, the US might need more than 900,000 tests per day according to Dr. Jha of Harvard's Global Health Institute.
There were 441,248 test results reported over the last 24 hours.
 Click on graph for larger image.
This data is from the COVID Tracking Project.
The percent positive over the last 24 hours was 4.3% (red line). The US probably needs enough tests to keep the percentage positive well below 5%. (probably much lower based on testing in New Zealand).
Six High Frequency Indicators for the Eventual Recovery
by Calculated Risk on 5/25/2020 10:03:00 AM
These indicators are mostly for travel and entertainment - some of the sectors that will probably recover very slowly.
The TSA is providing daily travel numbers.
 Click on graph for larger image.
This data shows the daily total traveler throughput from the TSA for 2019 (Blue) and 2020 (Red).
On May 24th there were 267,451 travelers compared to 2,070,716 a year ago.
That is a decline of 87.1%. There has been some increase off the bottom, but it is pretty small compared to the normal level of travel.
The second graph shows the year-over-year change in diners as tabulated by OpenTable for the US and several selected cities.
 Thanks to OpenTable for providing this restaurant data:
This data is updated through May 23, 2020.
The US was off 100% YoY as of March 21st.
California and New York are still off 100%.
Some states - like Texas and Georgia - have started to open up. In Texas, diner traffic was only down 63% YoY.
 This data shows domestic box office for each week (red) and the maximum and minimum for the previous four years. Data is from BoxOfficeMojo.
Note that the data is noisy and depends on when blockbusters are released.
Movie ticket sales have been essentially at zero for nine weeks.
Basically movie theaters are closed all across the country, and will probably reopen slowly (probably with limited seating at first).
The following graph shows the seasonal pattern for the hotel occupancy rate using the four week average.
 The red line is for 2020, dash light blue is 2019, blue is the median, and black is for 2009 (the worst year probably since the Great Depression for hotels).
2020 was off to a solid start, however, COVID-19 has crushed hotel occupancy.
Notes: Y-axis doesn't start at zero to better show the seasonal change.
STR reported hotel occupancy was off 54.1% year-over-year last week. Occupancy has increased slightly over the last few of weeks.
 This graph, based on weekly data from the U.S. Energy Information Administration (EIA), shows the year-over-year change in gasoline consumption.
At one point, gasoline consumption was off almost 50% YoY.
As of May 15th, gasoline consumption was off about 20% YoY (about 72% of normal).
The final graph is from Apple mobility.
 This data is through May 22nd for the United States.
According to the Apple data, driving is back to normal, walking is close to normal, but public transit is still off 64% from the pre-crisis level.
Sunday, May 24, 2020
May 24 COVID-19 Test Results
by Calculated Risk on 5/24/2020 05:30:00 PM
In late April, Dr. Fauci said the US might be able to test 400,000 to 600,000 people per day sometime in May, and testing is now close to that range. This might be enough to allow test-and-trace in some areas. However, the US might need more than 900,000 tests per day according to Dr. Jha of Harvard's Global Health Institute.
There were 379,129 test results reported over the last 24 hours.
 Click on graph for larger image.
This data is from the COVID Tracking Project.
The percent positive over the last 24 hours was 5.5% (red line). The US probably needs enough tests to keep the percentage positive well below 5%. (probably much lower based on testing in New Zealand).
Economic Outlook: Not Sanguine
by Calculated Risk on 5/24/2020 11:08:00 AM
On March 31st, I wrote:
This is a healthcare crisis, and the economic outlook is based on presumptions about the course of the pandemic.Unfortunately the course of the pandemic has been worse than I expected. Although social distancing clearly worked in slowing the growth rate of infections, many people have recently relaxed their guard - and COVID-19 cases, hospitalizations and deaths are still rising in many parts of the country.
Stories like this are concerning: Arkansas governor says several people who attended pool party infected with COVID-19
Several people who attended a swim party in Arkansas have contracted coronavirus, Gov. Asa Hutchinson (R) confirmed Saturday.It is possible to open the economy without an increase in infections. For example, in Japan, the economy is mostly open, however 1) everyone wears a mask, 2) there is robust contact tracing, and 3) everyone is urged to follow the 3 C's (avoid Closed spaces, Crowded places, and Close-Contact settings) (Cool graphic!).
"There were positive cases coming out of a high school swim party. A high school swim party that I'm sure everybody thought was harmless. They're young, they're swimming, they're just having activity and positive cases resulted from that," the governor told reporters Saturday.
However, in the US, contact tracing is still ramping up, many people aren't wearing a mask or face covering, and - based on many stories like above - people are not following the 3Cs.
Since the course of the economy will be determined by the course of the virus, I'm not currently sanguine about the economic outlook.
Saturday, May 23, 2020
May 23 COVID-19 Test Results
by Calculated Risk on 5/23/2020 05:54:00 PM
Note: I live in Orange County, CA, and the COVID-19 news has been disappointing. The number of daily deaths has increased recently (12 today), and the number of hospitalizations has been rising steadily. Also the percentage of tests that were positive today was 21% (216 out of 1,033). This is a very high positive rate and indicates testing in the OC is not adequate. The overall number of cases and deaths in the OC is not exceedingly high compared to some areas, but the trend is not favorable.
In late April, Dr. Fauci said the US might be able to test 400,000 to 600,000 people per day sometime in May, and testing is now close to that range. This might be enough to allow test-and-trace in some areas. However, the US might need more than 900,000 tests per day according to Dr. Jha of Harvard's Global Health Institute.
There were 344,384 test results reported over the last 24 hours.
 Click on graph for larger image.
This data is from the COVID Tracking Project.
The percent positive over the last 24 hours was 6.2% (red line). The US probably needs enough tests to keep the percentage positive well below 5%. (probably much lower based on testing in New Zealand).
NOTE: There was something wrong with the Texas numbers today, so this doesn't include Texas tests today.
Schedule for Week of May 24, 2020
by Calculated Risk on 5/23/2020 08:11:00 AM
The key reports this week are the second estimate of Q1 GDP, April New Home Sales, March Case-Shiller house prices, and Personal Income and Outlays for April.
For manufacturing, the May Dallas, Richmond and Kansas City Fed manufacturing surveys will be released.
On Friday, Fed Chair Jerome Powell will participate in a discussion.
All US markets will be closed in observance of Memorial Day.
8:30 AM ET: Chicago Fed National Activity Index for April. This is a composite index of other data.
 9:00 AM: S&P/Case-Shiller House Price Index for March.
This graph shows the year-over-year change in the seasonally adjusted National Index, Composite 10 and Composite 20 indexes through the most recent report (the Composite 20 was started in January 2000).
The consensus is for a 3.3% year-over-year increase in the Comp 20 index for March.
9:00 AM: FHFA House Price Index for March 2020. This was originally a GSE only repeat sales, however there is also an expanded index.
 10:00 AM: New Home Sales for April from the Census Bureau.
 This graph shows New Home Sales since 1963. The dashed line is the sales rate for last month.
The consensus is for 490 thousand SAAR, down from 627 thousand in March.
10:30 AM: Dallas Fed Survey of Manufacturing Activity for May.
7:00 AM ET: The Mortgage Bankers Association (MBA) will release the results for the mortgage purchase applications index.
10:00 AM: Richmond Fed Survey of Manufacturing Activity for May.
2:00 PM: the Federal Reserve Beige Book, an informal review by the Federal Reserve Banks of current economic conditions in their Districts.
8:30 AM ET: The initial weekly unemployment claims report will be released. The consensus is for a 2.100 million initial claims, down from 2.438 million the previous week.
8:30 AM: Gross Domestic Product, 1st quarter 2020 (Second estimate). The consensus is that real GDP decreased 4.8% annualized in Q1, unchanged from the advance estimate of -4.8%.
8:30 AM: Durable Goods Orders for April from the Census Bureau. The consensus is for a 18.5% decrease in durable goods orders.
10:00 AM: Pending Home Sales Index for April. The consensus is for a 15% decrease in the index.
11:00 AM: the Kansas City Fed manufacturing survey for May. This is the last of regional manufacturing surveys for May.
8:30 AM ET: Personal Income and Outlays, April 2020. The consensus is for a 6.5% decrease in personal income, and for a 12.5% decrease in personal spending. And for the Core PCE price index to decrease 0.3%.
9:45 AM: Chicago Purchasing Managers Index for May.
10:00 AM: University of Michigan's Consumer sentiment index (Final for May). The consensus is for a reading of 73.7.
11:00 AM: Discussion, Fed Chair Jerome Powell, At Griswold Center for Economic Policy Studies Princeton Reunions Talk: A Conversation with Jerome Powell, moderated by Alan Blinder (via webcast)
Friday, May 22, 2020
May 22 COVID-19 Test Results
by Calculated Risk on 5/22/2020 05:42:00 PM
In addition to having enough tests for test-and-trace, we also need people to conduct contact tracing. There is a great new website that tracks the progress of each towards test-and-trace. The website also has resources on how to implement test-and-trace. This includes software, training resources, a calculator for how many people to hire and more. Every state should review this site!
Check it out.
In late April, Dr. Fauci said the US might be able to test 400,000 to 600,000 people per day sometime in May, and testing is now close to that range. This might be enough to allow test-and-trace in some areas. However, the US might need more than 900,000 tests per day according to Dr. Jha of Harvard's Global Health Institute.
There were 343,802 test results reported over the last 24 hours.
 Click on graph for larger image.
This data is from the COVID Tracking Project.
The percent positive over the last 24 hours was 7.0% (red line). The US probably needs enough tests to keep the percentage positive well below 5%. (probably much lower based on testing in New Zealand).
NOTE: A few states - reportedly Virginia, Texas, Georgia, and Vermont - have apparently been including antibody tests with virus tests. The COVID tracking project is working to straighten that out. I think the COVID tracking project was able to back out some these antibody tests!


