 RSS Feed
 by Calculated Risk on 5/18/2020 07:34:00 PM
Monday, May 18, 2020
Tuesday: Housing Starts, Fed Chair Powell Testimony
From Matthew Graham at Mortgage News Daily: Mortgage Rates Will Have to Wait to Set More Records
Mortgage rates hit all-time lows on Friday, based on the average rate for a top tier conventional 30yr fixed loan scenario. [MND's 30 Year Fixed (daily survey) 30YR FIXED - 3.12%]Tuesday:
emphasis added
• At 8:30 AM ET, Housing Starts for April. The consensus is for 0.950 million SAAR, down from 1.216 million SAAR in March.
• At 10:00 AM, Testimony, Fed Chair Jerome Powell, Coronavirus Aid, Relief, and Economic Security Act, Before the Senate Banking, Housing, and Urban Affairs Committee, U.S. Senate (Watch Live Here)
May 18 Update: US COVID-19 Test Results
by Calculated Risk on 5/18/2020 05:04:00 PM
In late April, Dr. Fauci said the US might be able to test 400,000 to 600,000 people per day, and yesterday was the first day in that range. This might be enough to allow test-and-trace in some areas.
However, the US might need more than 900,000 tests per day according to Dr. Jha of Harvard's Global Health Institute.
There were 346,094 test results reported over the last 24 hours.
 Click on graph for larger image.
This data is from the COVID Tracking Project.
The percent positive over the last 24 hours was 5.7% (red line). The US probably needs enough tests to keep the percentage positive well below 5%. (probably much lower based on testing in New Zealand).
NOTE: A few states are apparently including antibody tests with virus tests. The Covid tracking project is working to straighten that out.
MBA Survey: "Share of Mortgage Loans in Forbearance Increases to 8.16%" of Portfolio Volume
by Calculated Risk on 5/18/2020 04:00:00 PM
Note: To put these numbers in perspective, the MBA notes "For the week of March 2, only 0.25% of all loans were in forbearance."
From the MBA: Share of Mortgage Loans in Forbearance Increases to 8.16%
The Mortgage Bankers Association’s (MBA) latest Forbearance and Call Volume Survey revealed that the total number of loans now in forbearance increased from 7.91% of servicers’ portfolio volume in the prior week to 8.16% as of May 10, 2020. According to MBA’s estimate, 4.1 million homeowners are now in forbearance plans.
...
“The pace of forbearance requests continued to slow in the second week of May, but the share of loans in forbearance increased,” said Mike Fratantoni, MBA’s Senior Vice President and Chief Economist. “There has been a pronounced flattening in loans put into forbearance – despite April’s uniformly negative economic data, remarkably high unemployment, and it now being past May payment due dates. However, FHA and VA borrowers are more likely to be employed in the sectors hardest hit in this crisis, which is why more than 11 percent of Ginnie Mae loans are currently in forbearance.”
According to Fratantoni, record-low mortgages rates are sustaining the refinance wave, helping homeowners lower their mortgage payments and save money during these challenging times. Furthermore, the consecutive increase in purchase applications in the last four weeks is a sign that housing demand is strengthening as more states ease restrictions on activity and people get back to work.
Added Fratantoni, “We will continue to closely monitor the forbearance request and call volume data for any sign of an uptick, but current trends suggest that if the economy continues to gradually reopen, the situation could be stabilizing.”
emphasis added
 Click on graph for larger image.
This graph shows the weekly forbearance requests as a percent of servicer's portfolio volume.
The requests peaked in the week of March 30th to April 5th.
The MBA notes: "Forbearance requests as a percent of servicing portfolio volume (#) dropped across all investor types for the fifth consecutive week relative to the prior week: from 0.51% to 0.32%."
CAR on California April Housing: Sales down 30% YoY, Listing down 25% YoY
by Calculated Risk on 5/18/2020 11:52:00 AM
The CAR reported: California housing market feels full brunt of coronavirus outbreak in April, C.A.R. reports
alifornia home sales dropped sharply in April from both the previous month and year as the housing market began to feel the full impact of the coronavirus outbreak and the state’s stay-at-home order, the CALIFORNIA ASSOCIATION OF REALTORS® (C.A.R.) said today.CR Note: Existing home sales are reported when the transaction closes, so this was mostly for contracts signed in February and March.
Closed escrow sales of existing, single-family detached homes in California totaled a seasonally adjusted annualized rate of 277,440 units in April, according to information collected by C.A.R. from more than 90 local REALTOR® associations and MLSs statewide. The statewide annualized sales figure represents what would be the total number of homes sold during 2020 if sales maintained the April pace throughout the year. It is adjusted to account for seasonal factors that typically influence home sales.
April’s sales total was down 25.6 percent from the 373,070 level in March and down 30.1 percent from a year ago. It was the first time home sales dropped below the 300,000 level since March 2008, and the month-to-month drop was the largest since at least 1979, when C.A.R. began tracking this data. Additionally, the year-over-year decline was the first double-digit loss in 15 months and the largest decrease since December 2007.
“As expected, California home sales experienced the worst month-to-month sales decline in more than four decades as the coronavirus pandemic prompted stay-at-home orders, which kept both buyers and sellers on the sidelines,” said 2020 C.A.R. President Jeanne Radsick, a second-generation REALTOR® from Bakersfield, Calif. “While some economic activity will resume as the state gradually reopens, the housing market is expected to remain sluggish for the next couple of months as potential market participants deal with the impact of stay-in-place restrictions.”
...
C.A.R.’s Unsold inventory Index jumped to 3.4 months in April from 2.7 months in March and was unchanged from last April. The index indicates the number of months it would take to sell the supply of homes on the market at the current rate of sales.
Total active listings continued to decline on a year-over-year basis for the 10th consecutive month, and the 25 percent decrease in listings was consistent with what has been observed before the shutdown.
emphasis added
Mortgage Rates and Ten Year Yield
by Calculated Risk on 5/18/2020 11:45:00 AM
With the ten year yield at 0.70%, and based on an historical relationship, 30-year rates should currently be around 2.8%.
Mortgage News Daily reports that the most prevalent 30 year fixed rate is now at 3.10% for top tier scenarios. So mortgage rates are a little high compared to the normal relationship.
The graph shows the relationship between the monthly 10 year Treasury Yield and 30 year mortgage rates from the Freddie Mac survey.
 Currently the 10 year Treasury yield is at 0.70%, and 30 year mortgage rates were at 3.28% according to the Freddie Mac survey last week - higher than expected.
The record low in the Freddie Mac survey was 3.23% in April 2020 (Survey started in 1971).
Freddie Mac has a similar graph here with a linear fit (using data since 1990). Using their formula, 30 year rates would be around 2.6%.
NAHB: Builder Confidence Increased to 37 in May
by Calculated Risk on 5/18/2020 10:04:00 AM
The National Association of Home Builders (NAHB) reported the housing market index (HMI) was at 37, up from 30 in April. Any number below 50 indicates that more builders view sales conditions as poor than good.
From NAHB: Builder Confidence Posts Solid Gain Following Last Month’s Historic Drop
In a signal that the housing market is showing signs of stabilizing and gradually moving forward in the wake of the COVID-19 pandemic, builder confidence in the market for newly-built single-family homes increased seven points to 37 in May, according to the latest NAHB/Wells Fargo Housing Market Index (HMI) released today. The rise in builder sentiment follows the largest single monthly decline in the history of the index in April.
“The fact that most states classified housing as an essential business during this crisis helped to keep many residential construction workers on the job, and this is reflected in our latest builder survey,” said NAHB Chairman Dean Mon. “At the same time, builders are showing flexibility in this new business environment by making sure buyers have the knowledge and access to the homes they are seeking through innovative measures such as social media, virtual tours and online closings.”
“Low interest rates are helping to sustain demand,” said NAHB Chief Economist Robert Dietz. “As many states and localities across the nation lift stay-at-home orders and more furloughed workers return to their jobs, we expect this demand will strengthen. Other indicators that suggest a housing rebound include mortgage application data that has posted four weeks of gains and signs that buyer traffic has improved in housing markets in recent weeks. However, high unemployment and supply-side challenges including builder loan access and building material availability are near-term limiting factors.”
...
All the HMI indices posted gains in May. The HMI index gauging current sales conditions increased six points to 42, the component measuring sales expectations in the next six months jumped 10 points to 46 and the measure charting traffic of prospective buyers rose eight points to 21.
Looking at the monthly average regional HMI scores, the Midwest increased seven point to 32, the South rose eight points to 42 and West posted a 12-point gain to 44. The Northeast fell two points to 17.
emphasis added
 Click on graph for larger image.
This graph show the NAHB index since Jan 1985.
This was above the consensus forecast.
Note: The graph shows the 2020 recession starting in March 2020.
Six High Frequency Indicators for the Eventual Recovery
by Calculated Risk on 5/18/2020 08:16:00 AM
These indicators are for travel and entertainment - some of the sectors that will probably recover very slowly.
The TSA is providing daily travel numbers.
 Click on graph for larger image.
This data shows the daily total traveler throughput from the TSA for 2019 (Blue) and 2020 (Red).
On May 17th there were 253,807 travelers compared to 2,620,276 a year ago.
That is a decline of 90.3%. There has been some increase off the bottom, but it is pretty small compared to the normal level of travel.
The second graph shows the year-over-year change in diners as tabulated by OpenTable for the US and several selected cities.
 Thanks to OpenTable for providing this restaurant data:
This data is updated through May 16, 2020.
The US was off 100% YoY as of March 21st.
California and New York are still off 100%.
Some states - like Texas and Georgia - have started to open up. In Texas, diner traffic was only down 75% YoY.
 This data shows domestic box office for each week (red) and the maximum and minimum for the previous four years. Data is from BoxOfficeMojo.
Note that the data is noisy and depends on when blockbusters are released.
Movie ticket sales have been essentially at zero for eight weeks.
Basically movie theaters are closed all across the country, and will probably reopen slowly (probably with limited seating at first).
The following graph shows the seasonal pattern for the hotel occupancy rate using the four week average.
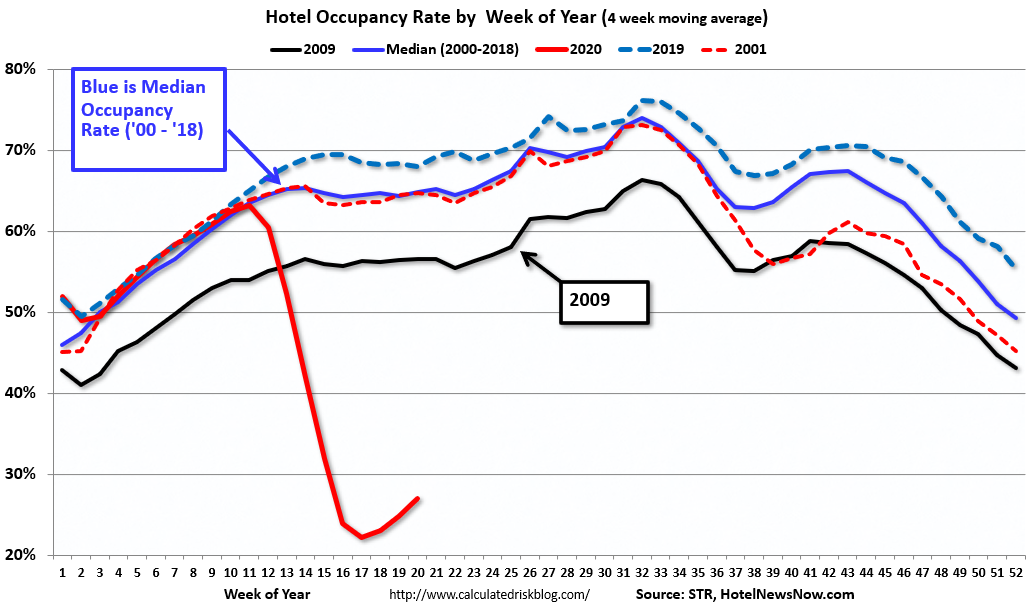 The red line is for 2020, dash light blue is 2019, blue is the median, and black is for 2009 (the worst year probably since the Great Depression for hotels).
2020 was off to a solid start, however, COVID-19 has crushed hotel occupancy.
Notes: Y-axis doesn't start at zero to better show the seasonal change. I added 2001 to show the impact on hotel occupancy after 9/11.
STR reported hotel occupancy was off 55.9% year-over-year last week. Occupancy has increased slightly over the last few of weeks.
 This graph, based on weekly data from the U.S. Energy Information Administration (EIA), shows the year-over-year change in gasoline consumption.
At one point, gasoline consumption was off almost 50% YoY.
As of May 8th, gasoline consumption was off about 20% YoY (about 80% of normal).
The final graph is from Apple mobility.
 This data is through May 16th for the United States.
According to the Apple data, driving is back to normal, walking is a somewhat below normal, but public transit is still off 69% from the pre-crisis level.
Sunday, May 17, 2020
Monday: Builder Confidence
by Calculated Risk on 5/17/2020 07:01:00 PM
Weekend:
• Schedule for Week of May 17, 2020
Monday:
• At 10:00 AM ET, The May NAHB homebuilder survey. The consensus is for an increase to 33 from 30 last month. Any number below 50 indicates that more builders view sales conditions as poor than good.
From CNBC: Pre-Market Data and Bloomberg futures S&P 500 are up 8 and DOW futures are up 88 (fair value).
Oil prices were up over the last week with WTI futures at $30.03 per barrel and Brent at $33.29 barrel. A year ago, WTI was at $63, and Brent was at $74 - so WTI oil prices are down over 50% year-over-year.
Here is a graph from Gasbuddy.com for nationwide gasoline prices. Nationally prices are at $1.88 per gallon. A year ago prices were at $2.86 per gallon, so gasoline prices are down $0.98 per gallon year-over-year.
May 17 Update: US COVID-19 Test Results: Test-and-Trace Success for Smallpox
by Calculated Risk on 5/17/2020 05:50:00 PM
From Dr. Bill Foege (former Director of CDC) in the Atlanta Journal-Constitution: Opinion: Lessons of Smallpox eradication and COVID-19
Contact tracing and isolation were hallmarks of the smallpox program with labor-intensive work before computers and smart phones were available for workers. In a single state in India, in May 1974, they reported 1,500 new cases a day. That required 1,500 new investigations each day, with the isolation of cases, the locating of contacts, vaccination of contacts and isolation of those with symptoms until a diagnosis could be made. It required tens of thousands of people simply to act as watch guards of the homes of cases and to vaccinate all visitors. All of this with difficult communications and yet currently we hear that contact tracing is not possible until the numbers of cases are reduced. Of course, the diseases are different. A vaccine and the lack of subclinical cases favored smallpox work. However, the approaches to control are similar. A current problem is that testing remains inadequate months after the problem was defined.In late April, Dr. Fauci said the US might be able to test 400,000 to 600,000 people per day, and this is the first day in that range. This might be close to enough to allow test-and-trace.
However, the US might need more than 900,000 tests per day according to Dr. Jha of Harvard's Global Health Institute.
There were 422,024 test results reported over the last 24 hours.
 Click on graph for larger image.
This data is from the COVID Tracking Project.
The percent positive over the last 24 hours was 5.0% (red line). The US probably needs enough tests to keep the percentage positive well below 5%. (probably much lower based on testing in New Zealand).
NOTE: A few states are apparently including antibody tests with virus tests. The Covid tracking project is working to straighten that out.
Saturday, May 16, 2020
May 16 Update: US COVID-19 Test Results
by Calculated Risk on 5/16/2020 05:25:00 PM
The US might be able to test 400,000 to 600,000 people per day sometime in May according to Dr. Fauci - and that might be enough for test and trace.
However, the US might need more than 900,000 tests per day according to Dr. Jha of Harvard's Global Health Institute.
There were 356,994 test results reported over the last 24 hours.
 Click on graph for larger image.
This data is from the COVID Tracking Project.
The percent positive over the last 24 hours was 7.0% (red line). The US probably needs enough tests to keep the percentage positive well below 5%. (probably much lower based on testing in New Zealand).
NOTE: A few states are apparently including antibody tests with virus tests. The Covid tracking project is working to straighten that out.


