 RSS Feed
 by Calculated Risk on 4/28/2020 01:32:00 PM
Tuesday, April 28, 2020
Real House Prices and Price-to-Rent Ratio in February
Here is the post earlier on Case-Shiller: Case-Shiller: National House Price Index increased 4.2% year-over-year in February
It has been fourteen years since the bubble peak. In the Case-Shiller release today, the seasonally adjusted National Index (SA), was reported as being 17% above the previous bubble peak. However, in real terms, the National index (SA) is still about 6% below the bubble peak (and historically there has been an upward slope to real house prices). The composite 20, in real terms, is still 13% below the bubble peak.
The year-over-year growth in prices increased to 4.2% nationally, as expected with lower mortgage rates and fewer homes for sell. This was pre-crisis data.
Usually people graph nominal house prices, but it is also important to look at prices in real terms (inflation adjusted). Case-Shiller and others report nominal house prices. As an example, if a house price was $200,000 in January 2000, the price would be close to $291,000 today adjusted for inflation (45%). That is why the second graph below is important - this shows "real" prices (adjusted for inflation).
Nominal House Prices
 The first graph shows the monthly Case-Shiller National Index SA, and the monthly Case-Shiller Composite 20 SA (through February) in nominal terms as reported.
In nominal terms, the Case-Shiller National index (SA)and the Case-Shiller Composite 20 Index (SA) are both at new all times highs (above the bubble peak).
Real House Prices
 The second graph shows the same two indexes in real terms (adjusted for inflation using CPI less Shelter). Note: some people use other inflation measures to adjust for real prices.
In real terms, the National index is back to April 2005 levels, and the Composite 20 index is back to August 2004.
In real terms, house prices are at 2004/2005 levels.
Price-to-Rent
In October 2004, Fed economist John Krainer and researcher Chishen Wei wrote a Fed letter on price to rent ratios: House Prices and Fundamental Value. Kainer and Wei presented a price-to-rent ratio using the OFHEO house price index and the Owners' Equivalent Rent (OER) from the BLS.
 Here is a similar graph using the Case-Shiller National and Composite 20 House Price Indexes.
This graph shows the price to rent ratio (January 2000 = 1.0). The price-to-rent ratio has been moving sideways recently.
On a price-to-rent basis, the Case-Shiller National index is back to March 2004 levels, and the Composite 20 index is back to November 2003 levels.
In real terms, prices are back to late 2004 levels, and the price-to-rent ratio is back to late 2003, early 2004.
HVS: Q1 2020 Homeownership and Vacancy Rates
by Calculated Risk on 4/28/2020 10:44:00 AM
The Census Bureau released the Residential Vacancies and Homeownership report for Q1 2020. This is mostly pre-crisis.
This report is frequently mentioned by analysts and the media to track household formation, the homeownership rate, and the homeowner and rental vacancy rates. However, there are serious questions about the accuracy of this survey.
This survey might show the trend, but I wouldn't rely on the absolute numbers. he Census Bureau is investigating the differences between the HVS, ACS and decennial Census, and analysts probably shouldn't use the HVS to estimate the excess vacant supply or household formation, or rely on the homeownership rate, except as a guide to the trend.
"National vacancy rates in the first quarter 2020 were 6.6 percent for rental housing and 1.1 percent for homeowner housing. The rental vacancy rate of 6.6 percent was 0.4 percentage points lower than the rate in the first quarter 2019 (7.0 percent), but not statistically different from the fourth quarter 2019 (6.4 percent). The homeowner vacancy rate of 1.1 percent was 0.3 percentage points lower than the rate in the first quarter 2019 (1.4 percent) and the rate in the fourth quarter 2019 (1.4 percent).
The homeownership rate of 65.3 percent was 1.1 percentage points higher than the rate in the first quarter 2019 (64.2 percent) but was not statistically different from the rate in the fourth quarter 2019 (65.1 percent)."
 Click on graph for larger image.
The Red dots are the decennial Census homeownership rates for April 1st 1990, 2000 and 2010. The HVS homeownership rate increased to 65.3% in Q1, from 65.1% in Q4.
I'd put more weight on the decennial Census numbers.
 The HVS homeowner vacancy declined to 1.1%.
 Once again - this probably shows the general trend, but I wouldn't rely on the absolute numbers.
 The rental vacancy rate increased to 6.6% in Q1.
The quarterly HVS is the most timely survey on households, but there are many questions about the accuracy of this survey.
Overall this suggests that vacancies have declined significantly, the homeownership rate has bottomed - and that the rental vacancy rate is close to the bottom for this cycle.
Richmond Fed: "Fifth District Manufacturing Activity Declined Sharply in April", Lowest Reading on Record
by Calculated Risk on 4/28/2020 10:03:00 AM
From the Richmond Fed: Manufacturing Activity Declined Sharply in April
Fifth District manufacturing activity declined sharply in April, according to the most recent survey from the Richmond Fed. The composite index plummeted from 2 in March to −53 in April, its lowest reading and largest one-month drop on record. All three components — shipments, new orders, and employment — fell, and the indexes for shipments and new orders reached record lows. Firms reported weakened local business conditions and expected conditions to remain soft in the next six months.This was the last of the regional Fed surveys for April.
Survey results reflected a deterioration in employment conditions in April. More contacts reported drops in employment and average work week, although the wage index remained flat. Manufacturers expected these conditions to persist.
emphasis added
Here is a graph comparing the regional Fed surveys and the ISM manufacturing index:
 Click on graph for larger image.
The New York and Philly Fed surveys are averaged together (yellow, through April), and five Fed surveys are averaged (blue, through April) including New York, Philly, Richmond, Dallas and Kansas City. The Institute for Supply Management (ISM) PMI (red) is through March (right axis).
The ISM manufacturing index for April will be released on Friday, May 1st. The consensus is for the ISM to decline sharply to 36.7, down from 49.1 in March. Based on these regional surveys, the ISM manufacturing index might even be lower than the consensus in April.
Case-Shiller: National House Price Index increased 4.2% year-over-year in February
by Calculated Risk on 4/28/2020 09:11:00 AM
Note: This is for February. This is mostly pre-crisis data.
S&P/Case-Shiller released the monthly Home Price Indices for February ("February" is a 3 month average of December, January and February prices).
This release includes prices for 20 individual cities, two composite indices (for 10 cities and 20 cities) and the monthly National index.
Note: Case-Shiller reports Not Seasonally Adjusted (NSA), I use the SA data for the graphs.
From S&P: S&P CoreLogic Case-Shiller Index Shows Annual Home Price Gains Increased To 4.2% In February
The S&P CoreLogic Case-Shiller U.S. National Home Price NSA Index, covering all nine U.S. census divisions, reported a 4.2% annual gain in February, up from 3.9% in the previous month. The 10-City Composite annual increase came in at 2.9%, up from 2.6% in the previous month. The 20-City Composite posted a 3.5% year-over-year gain, up from 3.1% in the previous month.
Phoenix, Seattle, Tampa and Charlotte reported the highest year-over-year gains among the 20 cities. In February, Phoenix led the way with a 7.5% year-over-year price increase, followed by Seattle with a 6.0% increase, and Tampa and Charlotte with 5.2% increases. Seventeen of the 20 cities reported higher price increases in the year ending February 2020 versus the year ending January 2020.
...
The National Index and the 10-City Composite both posted a 0.4% month-over-month increase, while the 20-City Composite posted a 0.5% increase before seasonal adjustment in February. After seasonal adjustment, the National Index posted a month-over-month increase of 0.5%, while the 10-City and 20-City Composites both posted 0.4% increases. In February, 19 of 20 cities reported increases before seasonal adjustment while all 20 cities reported increases after seasonal adjustment.
The stable growth pattern established in the last half of 2019 continued into February,” says Craig J. Lazzara, Managing Director and Global Head of Index Investment Strategy at S&P Dow Jones Indices. “The National Composite Index rose by 4.2% in February 2020, and the 10- and 20-City Composites also advanced (by 2.9% and 3.5%, respectively). Results for the month were broad-based, with gains in every city in our 20-City Composite; 17 of the 20 cities saw accelerating prices. The National, 10-City, and 20-City Composites all rose at a faster rate in February than they had in January.
“At a regional level, Phoenix retains the top spot for the ninth consecutive month, with a gain of 7.5% for February. Home prices in Seattle rose by 6.0%, with Tampa and Charlotte prices both gaining 5.2%. Prices were particularly strong in the West and Southeast, and comparatively weak in the Midwest and Northeast.
“Importantly, today’s report covers real estate transactions closed during the month of February, and shows no signs of any adverse effect from the governmental suppression of economic activity in response to the COVID-19 pandemic. As much of the U.S. economy was shuttered in March, next month’s data may begin to reflect the impact of these policies on the housing market.”
emphasis added
 Click on graph for larger image.
 The first graph shows the nominal seasonally adjusted Composite 10, Composite 20 and National indices (the Composite 20 was started in January 2000).
The Composite 10 index is up 3.3% from the bubble peak, and up 0.4% in February (SA) from January.
The Composite 20 index is 7.4% above the bubble peak, and up 0.5% (SA) in February.
The National index is 17% above the bubble peak (SA), and up 0.5% (SA) in February. The National index is up 58% from the post-bubble low set in December 2011 (SA).
 The second graph shows the Year over year change in all three indices.
The Composite 10 SA is up 2.9% compared to February 2019. The Composite 20 SA is up 3.4% year-over-year.
The National index SA is up 4.2% year-over-year.
Note: According to the data, prices increased in 20 of 20 cities month-over-month seasonally adjusted.
I'll have more later.
Monday, April 27, 2020
Tuesday: Case-Shiller House Prices, Richmond Fed Mfg
by Calculated Risk on 4/27/2020 09:09:00 PM
CR Note: The Case-Shiller report is for February (before crisis). The Richmond Fed manufacturing survey is the last of the regional surveys for April. All of the surveys have been very weak.
Tuesday:
• At 9:00 AM, S&P/Case-Shiller House Price Index for February. The consensus is for a 3.1% year-over-year increase in the Comp 20 index for February.
• At 10:00 AM, Richmond Fed Survey of Manufacturing Activity for April. This is the last of regional manufacturing surveys for April.
• Also at 10:00 AM, the Q1 2020 Housing Vacancies and Homeownership from the Census Bureau.
April 27 Update: US COVID-19 Test Results: Disappointing
by Calculated Risk on 4/27/2020 04:58:00 PM
Disappointing, but might be weekend related.
From The Hill: Fauci confident US will double coronavirus testing capacity over next several weeks
Fauci said in a webcast hosted by the National Academy of Sciences that that the U.S. is currently averaging between 1.5 million and 2 million tests per week.Based on these comments, the US might be able to test 400,000 to 600,000 people per day in several weeks - and that would probably be sufficient for test and trace.
"We probably should get up to twice that as we get into the next several weeks, and I think we will," Fauci said. "Testing is an important part of what we’re doing, but it is not the only part."
…
"You need enough tests so when you’re doing what we’re trying to do right now, which is trying to ease our way back, that you can very easily identify, test, contact trace and get those who are infected out of society so they don’t infect others," he said, adding that positive test results should account for less than 10 percent of tests administered.
There were 135,505 test results reported over the last 24 hours.
 Click on graph for larger image.
This data is from the COVID Tracking Project.
The percent positive over the last 24 hours was 16.2% (red line). The US probably needs enough tests to push the percentage positive below 5%, although Dr. Fauci said below 10% (probably much lower based on testing in New Zealand).
Freddie Mac: Mortgage Serious Delinquency Rate Unchanged in March
by Calculated Risk on 4/27/2020 04:42:00 PM
Freddie Mac reported that the Single-Family serious delinquency rate in March was 0.60%, unchanged from 0.60% in February. Freddie's rate is down from 0.67% in March 2019.
This matches the last two months as the lowest delinquency rate since November 2007.
Freddie's serious delinquency rate peaked in February 2010 at 4.20%.
These are mortgage loans that are "three monthly payments or more past due or in foreclosure".
 Click on graph for larger image
This is close to a cycle bottom. However, with COVID-19, this rate will increase in a few months (it takes time since these are mortgage three months or more past due).
Note: Fannie Mae will report for March soon.
MBA Survey: "Share of Mortgage Loans in Forbearance Increases to 6.99%" of Portfolio Volume
by Calculated Risk on 4/27/2020 04:00:00 PM
Note: To put these numbers in perspective, the MBA notes "For the week of March 2, only 0.25% of all loans were in forbearance."
From the MBA: Share of Mortgage Loans in Forbearance Increases to 6.99%
The Mortgage Bankers Association’s (MBA) latest Forbearance and Call Volume Survey revealed that the total number of loans now in forbearance increased from 5.95% of servicers’ portfolio volume in the prior week to 6.99% as of April 19, 2020.
“Over 26 million Americans have filed for unemployment over the last month, leading to nearly 7 percent – 3.5 million – of all mortgage borrowers asking to be put into forbearance plans. For FHA and VA borrowers, the share of loans in forbearance is even higher, at 10 percent,” said Mike Fratantoni, MBA’s Senior Vice President and Chief Economist. “Forbearance requests fell relative to the prior week but remain roughly 100 times greater than the early March baseline. While the pace of job losses have slowed from the astronomical heights of just a few weeks ago, millions of people continue to file for unemployment. We expect forbearance requests will pick up again as we approach May payment due dates.”
Added Fratantoni, “The combination of stimulus payments, expanded unemployment insurance benefits, further fiscal and monetary actions, and states reopening will hopefully begin to stabilize forbearance requests and the overall economy.”
emphasis added
 Click on graph for larger image.
This graph shows the weekly forbearance requests as a percent of servicer's portfolio volume.
The requests peaked in the week of March 30th to April 5th, but might pick up again when May payments are due.
The MBA notes: "Forbearance requests as a percent of servicing portfolio volume (#) dropped relative to the prior week: from 1.79% to 1.14%."
Dallas Fed: "Contraction in Texas Manufacturing Sector Worsens", Record Low Activity Index
by Calculated Risk on 4/27/2020 10:35:00 AM
From the Dallas Fed: Contraction in Texas Manufacturing Sector Worsens
Texas factory activity declined further in April, according to business executives responding to the Texas Manufacturing Outlook Survey. The production index, a key measure of state manufacturing conditions, pushed further negative from -35.3 to -55.3, suggesting the contraction in output has steepened since last month.The last of the regional Fed surveys for April will be released tomorrow (Richmond Fed).
Other measures of manufacturing activity also point to a sharper decline in April. The new orders index dropped 26 points to -67.0, its lowest reading since the survey began in 2004. Similarly, the growth rate of orders index fell to -62.2. The capacity utilization and shipments indexes fell to -54.5 and -56.6, respectively. The capital expenditures index declined 20 points to -54.3. Each of these April readings represents a historical low.
Perceptions of broader business conditions remained very pessimistic in April. The general business activity index inched down from -70.0 to -73.7, pushing to a new historical low. The company outlook index remained near an all-time low but inched up from -65.6 to -62.6. The index measuring uncertainty regarding companies’ outlooks retreated slightly to 54.4, a reading still indicative of sharply increased uncertainty.
Labor market measures indicate further employment declines and shorter workweeks this month. The employment index held steady at -21.2. Three percent of firms noted net hiring, while 24 percent noted net layoffs. The hours worked index dropped 18 points to -40.2, signaling a notably reduced workweek length.
emphasis added
TSA checkpoint travel numbers
by Calculated Risk on 4/27/2020 09:37:00 AM
The TSA is providing daily travel numbers.
This is another measure that will be useful to track when the economy starts to reopen.
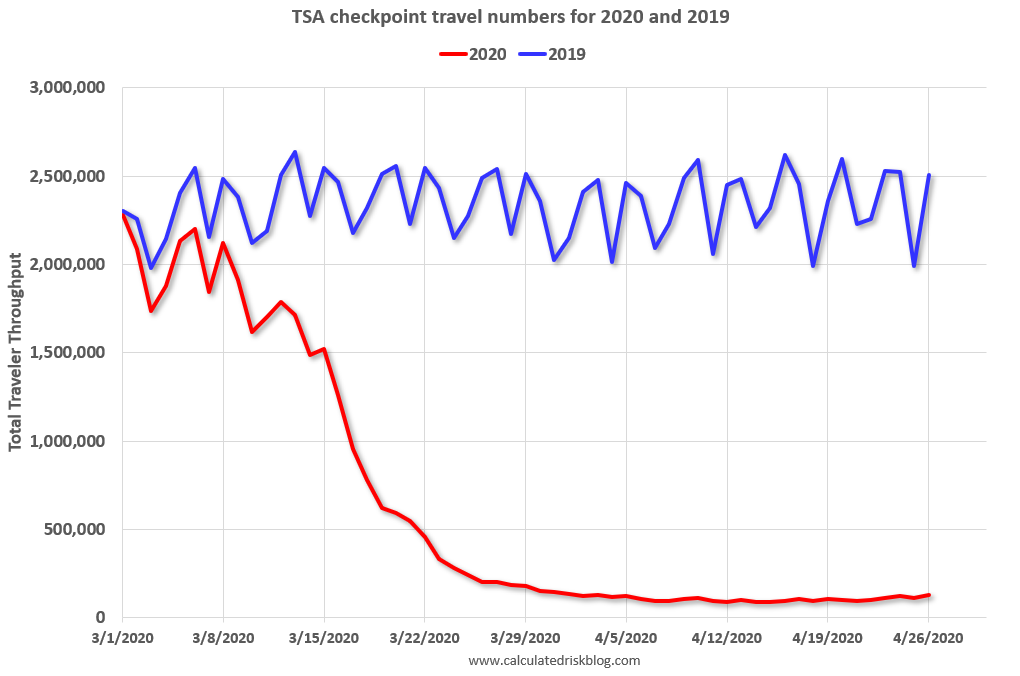 Click on graph for larger image.
This data shows the daily total traveler throughput from the TSA for 2019 (Blue) and 2020 (Red).
On April 26th there were 128,875 travelers compared to 2,506,809 a year ago.
That is a decline of 95%.


