 RSS Feed
 by Calculated Risk on 12/29/2017 10:01:00 AM
Friday, December 29, 2017
Question #9 for 2018: Will housing inventory increase or decrease in 2018?
Earlier I posted some questions for next year: Ten Economic Questions for 2018. I'm adding some thoughts, and maybe some predictions for each question.
9) Housing Inventory: Housing inventory declined in 2015, 2016 and 2017. Will inventory increase or decrease in 2018?
Tracking housing inventory is very helpful in understanding the housing market. The plunge in inventory in 2011 helped me call the bottom for house prices in early 2012 (The Housing Bottom is Here). And the increase in inventory in late 2005 (see first graph below) helped me call the top for house prices in 2006.
This graph shows nationwide inventory for existing homes through November 2017.
 Click on graph for larger image.
According to the NAR, inventory decreased to 1.67 million in November from 1.80 million in October.
Inventory has steadily been decreasing over the last few years.
This was the lowest level for the month of November since 2000.
Inventory is not seasonally adjusted, and usually inventory decreases from the seasonal high in mid-summer to the seasonal lows in December and January as sellers take their homes off the market for the holidays.
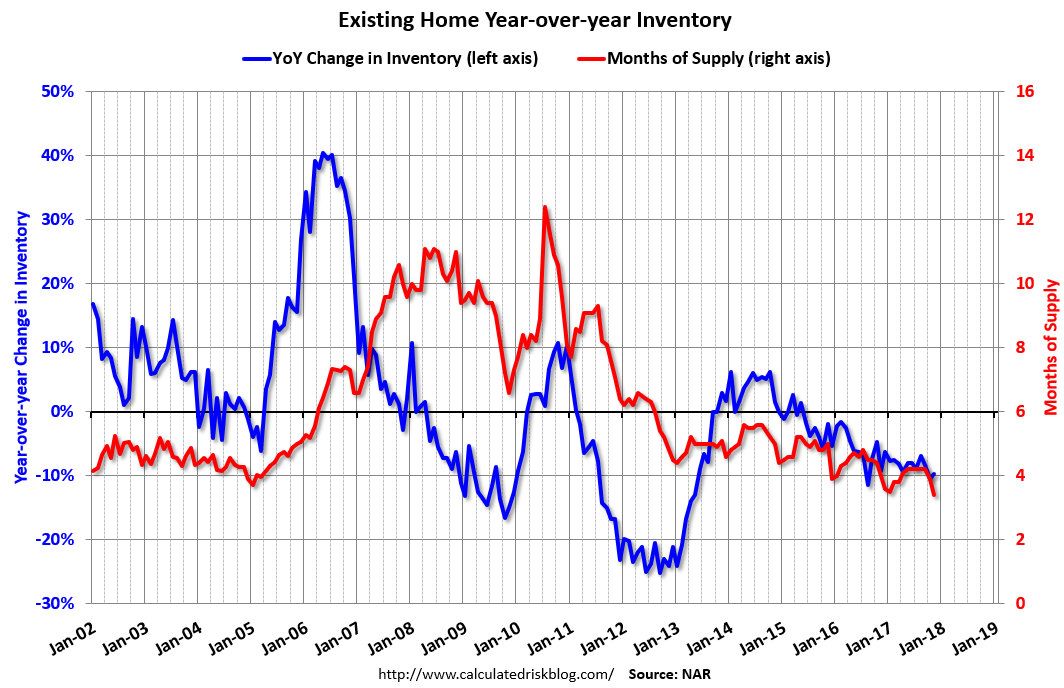 The second graph shows the year-over-year (YoY) change in reported existing home inventory and months-of-supply. Note: Months-of-supply is based on the seasonally adjusted sales and not seasonally adjusted inventory.
Inventory decreased 9.7% year-over-year in November compared to November 2016. Months of supply was at 3.4 months in November.
Note that the blue line (year-over-year change) turned slightly positive in 2013, but has been negative since mid-2015.
Two of the key reasons inventory is low: 1) A large number of single family home and condos were converted to rental units. In 2015, housing economist Tom Lawler estimated there were 17.5 million renter occupied single family homes in the U.S., up from 10.7 million in 2000. Many of these houses were purchased by investors, and rents have increased substantially, and the investors are not selling (even though prices have increased too). Most of these rental conversions were at the lower end, and that is limiting the supply for first time buyers. 2) Baby boomers are aging in place (people tend to downsize when they are 75 or 80, in another 10 to 20 years for the boomers). Instead we have seen a surge in home improvement spending, and this is also limiting supply.
The recent change in the tax law might lead to more inventory in certain areas, and I'll be tracking that over the course of the year.
I was wrong on inventory last year (and the previous year), but right now my guess is active inventory will increase in 2018 (inventory will decline seasonally in December and January, but I expect to see inventory up again year-over-year in December 2018). My reasons for expecting more inventory are 1) inventory is historically low (lowest for November since 2000), 2) and the recent changes to the tax law.
If correct, this will keep house price increases down in 2018 (probably lower than the 6% or so gains in 2017).
Here are the Ten Economic Questions for 2018 and a few predictions:
• Question #1 for 2018: How much will the economy grow in 2018?
• Question #2 for 2018: Will job creation slow further in 2018?
• Question #3 for 2018: What will the unemployment rate be in December 2018?
• Question #4 for 2018: Will the core inflation rate rise in 2018? Will too much inflation be a concern in 2018?
• Question #5 for 2018: Will the Fed raise rates in 2018, and if so, by how much?
• Question #6 for 2018: How much will wages increase in 2018?
• Question #7 for 2018: How much will Residential Investment increase?
• Question #8 for 2018: What will happen with house prices in 2018?
• Question #9 for 2018: Will housing inventory increase or decrease in 2018?
• Question #10 for 2018: Will the New Tax Law impact Home Sales, Inventory, and Price Growth in Certain States?
Chicago PMI "Rises" in December "to Six-and-a-Half Year High"
by Calculated Risk on 12/29/2017 09:33:00 AM
From the Chicago PMI: December Chicago Business Barometer Rises to 67.6
The MNI Chicago Business Barometer rose to 67.6 in December, up from 63.9 in November, closing the year at the highest level since March 2011.This was well above the consensus forecast of 61.8, and a strong reading.
On a calendar quarter basis, the Barometer rose to 65.9 in Q4 from 61.0 in Q3, the best quarterly performance since Q1 2011, only the second time in the last decade there have been three consecutive above-60 readings in the Oct-Dec period.
...
“Sentiment among businesses started 2017 in good shape and only impressed more as the year progressed. December’s result secured the MNI Chicago Business Barometer’s first full year of expansion since 2014 and with New Orders ending the quarter in fine shape there is every chance this form could be carried over into 2018,” said Jamie Satchi, Economist at MNI Indicators.
emphasis added
Thursday, December 28, 2017
Zillow Case-Shiller Forecast: More Solid House Price Gains in November
by Calculated Risk on 12/28/2017 06:43:00 PM
Friday:
• At 9:45 AM ET, Chicago Purchasing Managers Index for December. The consensus is for a reading of 61.8, down from 63.9 in November.
The Case-Shiller house price indexes for October were released on Tuesday. Zillow forecasts Case-Shiller a month early, and I like to check the Zillow forecasts since they have been pretty close.
From Aaron Terrazas at Zillow: Case-Shiller October Results and November Forecast: Still Defying Gravity
The last few months of 2017 have clearly demonstrated the extent to which the housing market refuses to be knocked off its stride. Sales of existing homes have risen strongly and unexpectedly, despite a severe and worsening shortage of homes actually available to buy. To cope, buyers simply linger longer on the market, even into the slower winter months if needed.The Zillow forecast is for the year-over-year change for the Case-Shiller National index to be smaller in November than in October. Zillow is forecasting a larger year-over-year increase for the 10-city index, and a smaller increase for the 20-city index in November.
The Case-Shiller National Index of home prices for October climbed 6.2 percent year-over-year, while its gain from September was 0.7 percent.
The 10-City Composite Index increased 6.0 percent year-over-year and 0.7 percent from September, while the 20-City Composite Index grew 6.4 percent year-over-year and 0.7 percent from September. Seattle, Las Vegas and San Diego continued to post the strongest annual gains among the 20 cities, with increases of 12.7 percent, 10.2 percent and 8.1 percent, respectively.
Home builders have managed to start construction on more homes than at any point since prior to the recession, despite high and rising land, labor and materials costs. An economy that keeps adding jobs and wages that continue to grow both have consumers feeling confident. And they’re boosted by mortgage interest rates that remain near all-time lows, defying expectations and conventional wisdom alike that both say – and have been saying for years – that rates have to begin rising at some point.

Freddie Mac: Mortgage Serious Delinquency rate up sharply in November
by Calculated Risk on 12/28/2017 04:07:00 PM
Freddie Mac reported that the Single-Family serious delinquency rate in November was at 0.95%, up sharply from 0.86% in October. Freddie's rate is down from 1.03% in November 2016.
Freddie's serious delinquency rate peaked in February 2010 at 4.20%.
These are mortgage loans that are "three monthly payments or more past due or in foreclosure".
 Click on graph for larger image
This increase in the delinquency rate was due to the hurricanes - and we might see a further increase over the next month (These are serious delinquencies, so it takes three months late to be counted).
After the hurricane bump, maybe the rate will decline another 0.2 to 0.4 percentage points or so to a cycle bottom, but this is pretty close to normal.
Note: Fannie Mae will report for November soon.
Question #10 for 2018: Will the New Tax Law impact Home Sales, Inventory, and Price Growth in Certain States?
by Calculated Risk on 12/28/2017 02:07:00 PM
Earlier I posted some questions for next year: Ten Economic Questions for 2018. I'm adding some thoughts, and maybe some predictions for each question.
10) Housing and Taxes A key change in the new tax law is limiting the deductibility of State and Local Taxes (SALT) and property taxes to $10,000. Many analysts think this will hit certain segments of the housing market in states like New York, New Jersey and California. The NAR noted their forecast today:
"Heading into 2018, existing-home sales and price growth are forecast to slow, primarily because of the altered tax benefits of homeownership affecting some high-cost areas."Relative to the overall market, will sales slow, inventory increase, and price growth slow in these states?
First, to track the impact over the course of the year, I'll follow certain markets and compare to the overall market (possibly in California, New York and New Jersey).
My sense is the low end of the housing market will be fine. The Mortgage Interest Deduction (MID) will be capped at interest on a mortgage up to $750,000 instead of $1,000,000, so the lower priced markets will not be hit by the reduction in the MID. There might be some additional taxes for these buyers due to the limits on SALT and property taxes, but this should be minor.
I also expect the high end of the market to be fine. The high end is already doing well even with the MID capped at $1 million. For these buyers, the bigger impact will be the SALT and property tax limitations, but there will be offsets for these buyers due to the lower rates - and these buyers will likely benefit from the corporate tax cuts. Many of these buyers will also benefit from the changes to the Alternative Minimum Tax (AMT).
It is the upper-mid-range in the certain markets that will probably slow. This might be in the $750,000 to $1.5 million price range. These potential buyers probably don't benefit from the AMT or corporate changes, but they will likely be hit by the SALT and property tax limits.
There could be a ripple effect. If the upper-mid-range slows, that could impact some of the purchases in the next higher range. This is my current guess on the impact.
Here are the Ten Economic Questions for 2018 and a few predictions:
• Question #1 for 2018: How much will the economy grow in 2018?
• Question #2 for 2018: Will job creation slow further in 2018?
• Question #3 for 2018: What will the unemployment rate be in December 2018?
• Question #4 for 2018: Will the core inflation rate rise in 2018? Will too much inflation be a concern in 2018?
• Question #5 for 2018: Will the Fed raise rates in 2018, and if so, by how much?
• Question #6 for 2018: How much will wages increase in 2018?
• Question #7 for 2018: How much will Residential Investment increase?
• Question #8 for 2018: What will happen with house prices in 2018?
• Question #9 for 2018: Will housing inventory increase or decrease in 2018?
• Question #10 for 2018: Will the New Tax Law impact Home Sales, Inventory, and Price Growth in Certain States?
Reis: Apartment Vacancy Rate increased in Q4 to 4.5%
by Calculated Risk on 12/28/2017 11:03:00 AM
Reis reported that the apartment vacancy rate was at 4.5% in Q4 2017, up from 4.4% in Q3, and up from 4.2% in Q4 2016. This is the highest vacancy rate since Q4 2012 (although the increase has been small). The vacancy rate peaked at 8.0% at the end of 2009, and bottomed at 4.1% in 2016.
From Reis:
The apartment market continued to face pressure from added supply in the fourth quarter as the national vacancy rate increased 10 basis points to 4.5% in the quarter. Asking rents increased 0.4% in the fourth quarter, while effective rents grew 0.3%. Effective rents net out landlord concessions. Over the year, asking rents increased 3.9% while effective rents grew by 3.3%. These growth rates reflect a deceleration in apartment market fundamentals compared to recent years, due in part to the large amount of new supply coming online. New construction totaled 43,769 units in the fourth quarter, raising the year-end total to 213,802 units. The national apartment market has not seen new completions in excess of 200,000 since 1986.
At 4.5%, the national vacancy rate increased 10 basis points from 4.4% in the third quarter. This represents a 30 basis point increase in year-over-year vacancy (the year-end vacancy rate in 2016 was 4.2%); vacancies have more or less been on an upward march since the middle of 2016. The net change in occupied stock, or net absorption, was 31,554 units, lower than new supply. With supply growth outstripping demand, vacancies were pushed upwards this quarter.
At $1,364, the average asking rent grew 0.4% in the quarter. This is well below the 0.9% average quarterly growth rate for the prior six quarters. Effective rent growth was 0.3% in the quarter, also below the 0.8% average quarterly effective rent growth for the prior six quarters. Overall, these statistics reflect a distinct pullback in the national apartment market, especially when compared to 2015. However, the gap between asking rent growth and effective rent growth remained within a 10 basis point range. This suggests that landlords’ offers of free rent were less aggressive – implying that demand remains relatively robust.
emphasis added
 Click on graph for larger image.
This graph shows the apartment vacancy rate starting in 1980. (Annual rate before 1999, quarterly starting in 1999). Note: Reis is just for large cities.
The vacancy rate had been mostly moving sideways for the last few years. However it appears the vacancy rate has bottomed and is starting to increase. With more supply coming on line next year - and less favorable demographics - the vacancy rate will probably continue to increase in 2018.
Apartment vacancy data courtesy of Reis.
Weekly Initial Unemployment Claims unchanged at 245,000
by Calculated Risk on 12/28/2017 08:34:00 AM
The DOL reported:
In the week ending December 23, the advance figure for seasonally adjusted initial claims was 245,000, unchanged from the previous week's unrevised level of 245,000. The 4-week moving average was 237,750, an increase of 1,750 from the previous week's unrevised average of 236,000.The previous week was unrevised.
Claims taking procedures continue to be disrupted in the Virgin Islands. The claims taking process in Puerto Rico has still not returned to normal.
emphasis added
The following graph shows the 4-week moving average of weekly claims since 1971.
 Click on graph for larger image.
The dashed line on the graph is the current 4-week average. The four-week average of weekly unemployment claims increased to 237,750.
This was higher than the consensus forecast. The low level of claims suggest relatively few layoffs.
Wednesday, December 27, 2017
Thursday: Unemployment Claims, Apartment Survey
by Calculated Risk on 12/27/2017 09:00:00 PM
Thursday:
• At 8:30 AM ET, The initial weekly unemployment claims report will be released. The consensus is for 240 thousand initial claims, down from 245 thousand the previous week.
• Early: Reis Q4 2017 Apartment Survey of rents and vacancy rates.
Ten Economic Questions for 2018
by Calculated Risk on 12/27/2017 05:21:00 PM
Here is a review of the Ten Economic Questions for 2017.
Here are my ten questions for 2018. I'll follow up with some thoughts on each of these questions.
The purpose of these questions is to provide a framework to think about how the U.S. economy will perform in 2018, and - when there are surprises - to adjust my thinking.
1) Economic growth: Heading into 2018, most analysts are pretty sanguine and expecting some pickup in growth due to the recent tax cuts. From Goldman Sachs:
"We are adjusting our forecasts to reflect the final details of the tax bill, as well as the incremental easing in financial conditions and continued strong economic momentum to end the year. We are increasing our GDP forecasts for 2018 and 2019 by 0.3pp and 0.2pp, respectively, on a Q4/Q4 basis (to 2.6% and 1.7%)."How much will the economy grow in 2018?
2) Employment: Through November, the economy has added just over 1,900,000 jobs this year, or 174,000 per month. As expected, this was down from the 187 thousand per month in 2016. Will job creation in 2018 be as strong as in 2017? Or will job creation be even stronger, like in 2014 or 2015? Or will job creation slow further in 2018?
3) Unemployment Rate: The unemployment rate was at 4.1% in November, down 0.5 percentage points year-over-year. Currently the FOMC is forecasting the unemployment rate will be in the 3.7% to 4.0% range in Q4 2018. What will the unemployment rate be in December 2018?
4) Inflation: The inflation rate has increased a little recently, and some key measures are now close to the the Fed's 2% target. Will core inflation rate rise in 2018? Will too much inflation be a concern in 2018?
5) Monetary Policy: The Fed raised rates three times in 2017 and started to reduce their balance sheet. The Fed is forecasting three more rate hikes in 2018. Some analysts think there will be more, from Goldman Sachs:
"We expect the next rate hike to come in March with subjective odds of 75%, and we continue to expect a total of four hikes in 2018."Will the Fed raise rates in 2018, and if so, by how much?
6) Real Wage Growth: Wage growth picked up in 2016 (up 2.9%), but slowed in 2017 (up 2.5% year-over-year in November). How much will wages increase in 2018?
7) Residential Investment: Residential investment (RI) was sluggish in 2017, although new home sales were up solidly. Note: RI is mostly investment in new single family structures, multifamily structures, home improvement and commissions on existing home sales. How much will RI increase in 2018? How about housing starts and new home sales in 2018?
8) House Prices: It appears house prices - as measured by the national repeat sales index (Case-Shiller, CoreLogic) - will be up over 6% in 2017. What will happen with house prices in 2018?
9) Housing Inventory: Housing inventory declined in 2015, 2016 and 2017. Will inventory increase or decrease in 2018?
10) Housing and Taxes A key change in the new tax law is limiting the deductibility of State and Local Taxes (SALT) and property taxes to $10,000. Many analysts think this will hit certain segments of the housing market in states like New York, New Jersey and California. The NAR noted their forecast today:
"Heading into 2018, existing-home sales and price growth are forecast to slow, primarily because of the altered tax benefits of homeownership affecting some high-cost areas."Relative to the overall market, will sales slow, inventory increase, and price growth slow in these states?
There are other important questions, but these are the ones I'm focused on right now. I'll write on each of these questions over the next couple of weeks.
Here is some discussion and a few predictions:
• Question #1 for 2018: How much will the economy grow in 2018?
• Question #2 for 2018: Will job creation slow further in 2018?
• Question #3 for 2018: What will the unemployment rate be in December 2018?
• Question #4 for 2018: Will the core inflation rate rise in 2018? Will too much inflation be a concern in 2018?
• Question #5 for 2018: Will the Fed raise rates in 2018, and if so, by how much?
• Question #6 for 2018: How much will wages increase in 2018?
• Question #7 for 2018: How much will Residential Investment increase?
• Question #8 for 2018: What will happen with house prices in 2018?
• Question #9 for 2018: Will housing inventory increase or decrease in 2018?
• Question #10 for 2018: Will the New Tax Law impact Home Sales, Inventory, and Price Growth in Certain States?
Philly Fed: State Coincident Indexes increased in 35 states in November
by Calculated Risk on 12/27/2017 03:00:00 PM
From the Philly Fed:
The Federal Reserve Bank of Philadelphia has released the coincident indexes for the 50 states for November 2017. Over the past three months, the indexes increased in 43 states and decreased in seven, for a three-month diffusion index of 72. In the past month, the indexes increased in 35 states, decreased in 11, and remained stable in four, for a one-month diffusion index of 48.Note: These are coincident indexes constructed from state employment data. An explanation from the Philly Fed:
emphasis added
The coincident indexes combine four state-level indicators to summarize current economic conditions in a single statistic. The four state-level variables in each coincident index are nonfarm payroll employment, average hours worked in manufacturing by production workers, the unemployment rate, and wage and salary disbursements deflated by the consumer price index (U.S. city average). The trend for each state’s index is set to the trend of its gross domestic product (GDP), so long-term growth in the state’s index matches long-term growth in its GDP.
 Click on map for larger image.
Here is a map of the three month change in the Philly Fed state coincident indicators. This map was all red during the worst of the recession, and all or mostly green during most of the recent expansion.
Recently several states have turned red.
Source: Philly Fed.
Note: For complaints about red / green issues, please contact the Philly Fed.
 And here is a graph is of the number of states with one month increasing activity according to the Philly Fed. This graph includes states with minor increases (the Philly Fed lists as unchanged).
In November, 37 states had increasing activity (including minor increases).
The downturn in 2015 and 2016, in the number of states increasing, was mostly related to the decline in oil prices.
The reason for the mid-to-late 2017 sharp decrease in the number of states with increasing activity is unclear.


