 RSS Feed
 by Calculated Risk on 12/21/2017 11:15:00 AM
Thursday, December 21, 2017
Earlier: Philly Fed Manufacturing Survey showed "Solid Growth" in December
Earlier from the Philly Fed: December 2017 Manufacturing Business Outlook Survey
Results from the December Manufacturing Business Outlook Survey suggest that regional manufacturing conditions continued to improve. Indexes for general activity, new orders, and shipments were all positive this month and increased from their readings last month. The firms also reported continued expansion of employment. Most indicators reflecting expectations for the next six months suggest continued optimism.Here is a graph comparing the regional Fed surveys and the ISM manufacturing index:
...
The diffusion index for current general activity increased from a reading of 22.7 in November to 26.2 this month ... The firms continued to report increases in employment. The current employment index fell 5 points but remained in positive territory, where it has been for 13 consecutive months. More than 29 percent of the responding firms reported increases in employment, while 11 percent of the firms reported decreases this month. The average workweek index declined 3 points after being in positive territory for 14 consecutive months.
emphasis added
 Click on graph for larger image.
The New York and Philly Fed surveys are averaged together (yellow, through December), and five Fed surveys are averaged (blue, through November) including New York, Philly, Richmond, Dallas and Kansas City. The Institute for Supply Management (ISM) PMI (red) is through November (right axis).
This suggests the ISM manufacturing index night increase slightly in December, and show solid expansion again.
Q3 GDP Revised down to 3.2% Annual Rate
by Calculated Risk on 12/21/2017 08:45:00 AM
From the BEA: Gross Domestic Product: Third Quarter 2017 (Third Estimate)
eal gross domestic product (GDP) increased at an annual rate of 3.2 percent in the third quarter of 2017, according to the "third" estimate released by the Bureau of Economic Analysis. In the second quarter, real GDP increased 3.1 percent.Here is a Comparison of Third and Second Estimates. PCE growth was revised down from 2.3% to 2.2%. Residential investment was revised up slightly from -5.1% to -4.7%. This was lower than the consensus forecast.
he GDP estimate released today is based on more complete source data than were available for the "second" estimate issued last month. In the second estimate, the increase in real GDP was 3.3 percent. With this third estimate for the third quarter, personal consumption expenditures increased less than previously estimated, but the general picture of economic growth remains the same ...
emphasis added
Weekly Initial Unemployment Claims increase to 245,000
by Calculated Risk on 12/21/2017 08:37:00 AM
The DOL reported:
In the week ending December 16, the advance figure for seasonally adjusted initial claims was 245,000, an increase of 20,000 from the previous week's unrevised level of 225,000. The 4-week moving average was 236,000, an increase of 1,250 from the previous week's unrevised average of 234,750.The previous week was unrevised.
Claims taking procedures continue to be disrupted in the Virgin Islands. The claims taking process in Puerto Rico has still not returned to normal.
emphasis added
The following graph shows the 4-week moving average of weekly claims since 1971.
 Click on graph for larger image.
The dashed line on the graph is the current 4-week average. The four-week average of weekly unemployment claims increased to 236,000.
This was higher than the consensus forecast. The low level of claims suggest relatively few layoffs.
Wednesday, December 20, 2017
Thursday: GDP, Unemployment Claims, Philly Fed Mfg Survey
by Calculated Risk on 12/20/2017 08:20:00 PM
Thursday:
• At 8:30 AM ET, The initial weekly unemployment claims report will be released. The consensus is for 234 thousand initial claims, up from 225 thousand the previous week.
• Also at 8:30 AM, Gross Domestic Product, 3rd quarter 2017 (Third estimate). The consensus is that real GDP increased 3.3% annualized in Q3, unchanged from 3.3% in the second report.
• Also at 8:30 AM, the Philly Fed manufacturing survey for December. The consensus is for a reading of 21.8, down from 22.7.
• Also at 8:30 AM, Chicago Fed National Activity Index for November. This is a composite index of other data.
• At 9:00 AM, FHFA House Price Index for October 2017. This was originally a GSE only repeat sales, however there is also an expanded index.
Phoenix Real Estate in November: Sales up 4%, Inventory down 11% YoY
by Calculated Risk on 12/20/2017 04:00:00 PM
A little late this month ... but this is a key housing market to follow since Phoenix saw a large bubble / bust followed by strong investor buying.
The Arizona Regional Multiple Listing Service (ARMLS) reports (table below):
1) Overall sales in November were up 4.3% year-over-year (including homes, condos and manufactured homes).
2) Active inventory is now down 10.9% year-over-year.
More inventory (a theme in most of 2014) - and less investor buying - suggested price increases would slow in 2014. And prices increases did slow in 2014, only increasing 2.4% according to Case-Shiller.
In 2015, with falling inventory, prices increased a little faster. Prices were up 6.3% in 2015 according to Case-Shiller.
With flat inventory in 2016, prices were up 4.8%.
This is the thirteenth consecutive month with a YoY decrease in inventory, and prices are rising a little faster this year (4.6% through September or 6.1% annual rate).
| November Residential Sales and Inventory, Greater Phoenix Area, ARMLS | ||||||
|---|---|---|---|---|---|---|
| Sales | YoY Change Sales | Cash Sales | Percent Cash | Active Inventory | YoY Change Inventory | |
| Nov-08 | 4,417 | --- | 1,217 | 27.6% | 56,2271 | --- |
| Nov-09 | 7,494 | 69.7% | 2,572 | 34.3% | 40,372 | -28.2% |
| Nov-10 | 6,789 | -9.4% | 2,966 | 43.7% | 45,353 | 12.3% |
| Nov-11 | 7,147 | 5.3% | 3,245 | 45.4% | 26,798 | -40.9% |
| Nov-12 | 6,810 | -4.7% | 2,945 | 43.2% | 23,232 | -13.3% |
| Nov-13 | 5,181 | -23.9% | 1,761 | 34.0% | 26,762 | 15.2% |
| Nov-14 | 4,986 | -3.8% | 1,396 | 28.0% | 27,426 | 2.5% |
| Nov-15 | 5,308 | 6.5% | 1,542 | 29.1% | 25,022 | -8.8% |
| Nov-16 | 6,911 | 30.2% | 1,618 | 23.4% | 24,582 | -1.8% |
| Nov-17 | 7,209 | 4.3% | 1,650 | 22.9% | 21,898 | -10.9% |
| 1 November 2008 probably includes pending listings | ||||||
A Few Comments on November Existing Home Sales
by Calculated Risk on 12/20/2017 01:52:00 PM
Earlier: NAR: "Existing-Home Sales Soar 5.6 Percent in November"
A few key points:
1) As usual, housing economist Tom Lawler's forecast was closer to the NAR report than the consensus. See: Lawler: Early Read on Existing Home Sales in November. The consensus was for sales of 5.52 million SAAR in November. Lawler estimated 5.77 million, and the NAR reported 5.81 million.
""Based on what I've seen so far, I project that existing home sales as estimated by the National Association of Realtors ran at a seasonally adjusted annual rate of 5.77 million in November."2) There might have been some bounce back in November from the hurricanes.
3) Inventory is still very low and falling year-over-year (down 9.7% year-over-year in November). More inventory would probably mean smaller price increases, and less inventory somewhat larger price increases. This was the 30th consecutive month with a year-over-year decline in inventory.
The following graph shows existing home sales Not Seasonally Adjusted (NSA).
 Click on graph for larger image.
Sales NSA in November (427,000, red column) were above sales in November 2016 (418,000, NSA) and at the highest level for November since 2006 (472,000).
Sales NSA are now slowing seasonally, and sales NSA will be lower through February.
AIA: Architecture Billings Index Increases in November
by Calculated Risk on 12/20/2017 11:37:00 AM
Note: This index is a leading indicator primarily for new Commercial Real Estate (CRE) investment.
From the AIA: Architecture billings upturn shows broad strength
Even with the uncertainty related to pending tax reform legislation that likely will have a mixed effect on the construction industry, design services at architecture firms remains in high demand. The American Institute of Architects (AIA) reported the November ABI score was 55.0, up from a score of 51.7 in the previous month. This score reflects an increase in design services provided by U.S. architecture firms (any score above 50 indicates an increase in billings). The new projects inquiry index was 61.1, up from a reading of 60.2 the previous month, while the new design contracts index rose slightly from 52.8 to 53.2.
“Not only are design billings overall seeing their strongest growth of the year, the strength is reflected in all major regions and construction sectors,” said AIA Chief Economist, Kermit Baker, Hon. AIA, PhD. “The construction industry continues to show surprising momentum heading into 2018.”
...
• Regional averages: West (54.8), Northeast (52.8), South (52.8), Midwest (50.4)
• Sector index breakdown: multi-family residential (53.9), mixed practice (53.6), commercial / industrial (53.3), institutional (52.4)
emphasis added
 Click on graph for larger image.
This graph shows the Architecture Billings Index since 1996. The index was at 55.0 in November, up from 51.7 in October. Anything above 50 indicates expansion in demand for architects' services.
Note: This includes commercial and industrial facilities like hotels and office buildings, multi-family residential, as well as schools, hospitals and other institutions.
According to the AIA, there is an "approximate nine to twelve month lag time between architecture billings and construction spending" on non-residential construction. This index was positive in 10 of the last 12 months, suggesting a further increase in CRE investment into 2018.
NAR: "Existing-Home Sales Soar 5.6 Percent in November"
by Calculated Risk on 12/20/2017 10:19:00 AM
From the NAR: Existing-Home Sales Soar 5.6 Percent in November to Strongest Pace in Over a Decade
Existing-home sales surged for the third straight month in November and reached their strongest pace in almost 11 years, according to the National Association of Realtors®. All major regions except for the West saw a significant hike in sales activity last month.
Total existing-home sales, which are completed transactions that include single-family homes, townhomes, condominiums and co-ops, jumped 5.6 percent to a seasonally adjusted annual rate of 5.81 million in November from an upwardly revised 5.50 million in October. After last month’s increase, sales are 3.8 percent higher than a year ago and are at their strongest pace since December 2006 (6.42 million).
...
Total housing inventory at the end of November dropped 7.2 percent to 1.67 million existing homes available for sale, and is now 9.7 percent lower than a year ago (1.85 million) and has fallen year-over-year for 30 consecutive months. Unsold inventory is at a 3.4-month supply at the current sales pace, which is down from 4.0 months a year ago.
emphasis added
 Click on graph for larger image.
This graph shows existing home sales, on a Seasonally Adjusted Annual Rate (SAAR) basis since 1993.
Sales in November (5.81 million SAAR) were 5.6% higher than last month, and were 3.8% above the November 2016 rate.
The second graph shows nationwide inventory for existing homes.
 According to the NAR, inventory decreased to 1.67 million in November from 1.80 million in October. Headline inventory is not seasonally adjusted, and inventory usually decreases to the seasonal lows in December and January, and peaks in mid-to-late summer.
The last graph shows the year-over-year (YoY) change in reported existing home inventory and months-of-supply. Since inventory is not seasonally adjusted, it really helps to look at the YoY change. Note: Months-of-supply is based on the seasonally adjusted sales and not seasonally adjusted inventory.
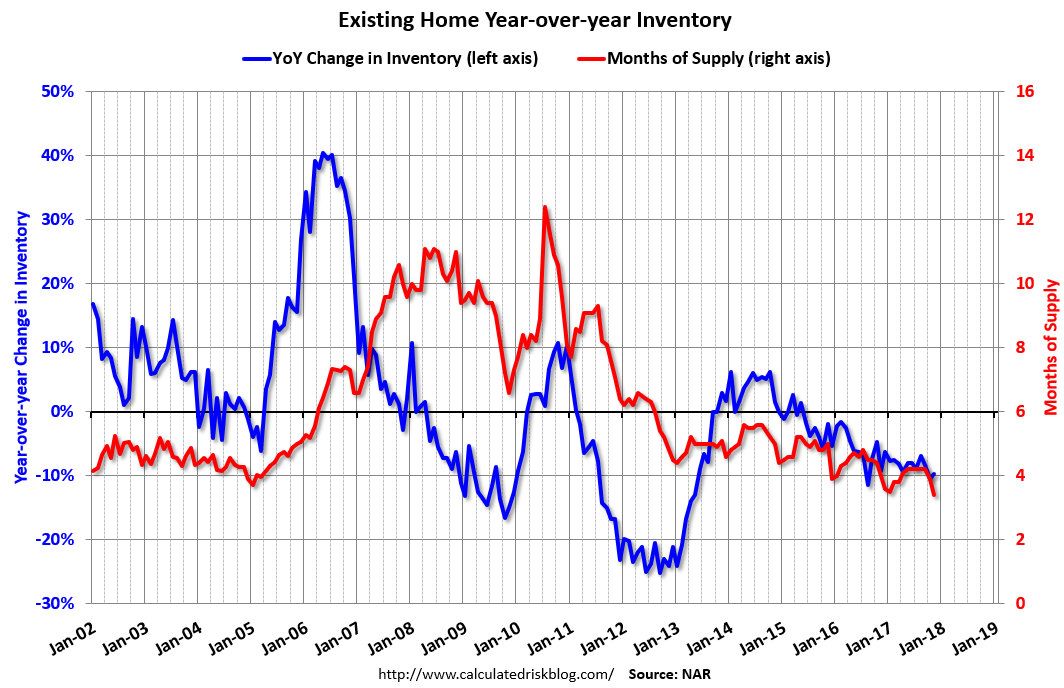 Inventory decreased 9.7% year-over-year in November compared to November 2016.
 Months of supply was at 3.4 months in November.
As expected by CR readers, sales were above the consensus view. For existing home sales, a key number is inventory - and inventory is still low. I'll have more later ...
MBA: Mortgage Applications Decrease in Latest Weekly Survey
by Calculated Risk on 12/20/2017 07:00:00 AM
From the MBA: Mortgage Applications Decrease in Latest MBA Weekly Survey
Mortgage applications decreased 4.9 percent from one week earlier, according to data from the Mortgage Bankers Association’s (MBA) Weekly Mortgage Applications Survey for the week ending December 15, 2017.
... The Refinance Index decreased 3 percent from the previous week. The seasonally adjusted Purchase Index decreased 6 percent from one week earlier. The unadjusted Purchase Index decreased 9 percent compared with the previous week and was 1 percent higher than the same week one year ago. ...
The average contract interest rate for 30-year fixed-rate mortgages with conforming loan balances ($424,100 or less) decreased to 4.16 percent from 4.20 percent, with points decreasing to 0.35 from 0.39 (including the origination fee) for 80 percent loan-to-value ratio (LTV) loans.
emphasis added
 Click on graph for larger image.
The first graph shows the refinance index since 1990.
Refinance activity will not pick up significantly unless mortgage rates fall well below 4%.
 The second graph shows the MBA mortgage purchase index.
 According to the MBA, purchase activity is up 1% year-over-year.
Tuesday, December 19, 2017
Wednesday: Existing Home Sales
by Calculated Risk on 12/19/2017 07:33:00 PM
Wednesday:
• At 7:00 AM ET, The Mortgage Bankers Association (MBA) will release the results for the mortgage purchase applications index.
• At 10:00 AM, Existing Home Sales for November from the National Association of Realtors (NAR). The consensus is for 5.52 million SAAR, up from 5.48 million in October. Housing economist Tom Lawler expects the NAR to report sales of 5.77 million SAAR for November.
• During the day, The AIA's Architecture Billings Index for November (a leading indicator for commercial real estate).


