 RSS Feed
 by Calculated Risk on 10/06/2017 12:55:00 PM
Friday, October 06, 2017
Las Vegas Real Estate in September: Sales up Slightly YoY, Inventory down Sharply
This is a key distressed market to follow since Las Vegas saw the largest price decline, following the housing bubble, of any of the Case-Shiller composite 20 cities.
The Greater Las Vegas Association of Realtors reported Local Home Prices Keep Climbing, While Sales Stabilize in September, GLVAR Housing Statistics for September 2017
The Greater Las Vegas Association of REALTORS® (GLVAR) reported today that local home prices continued to rise while home sales stabilized in September.1) Overall sales were up about 1% year-over-year.
...
By the end of September, GLVAR reported 4,969 single-family homes listed for sale without any sort of offer. That’s down 33.1 percent from one year ago. For condos and townhomes, the 680 properties listed without offers in September represented a 41.4 percent drop from one year ago.
The total number of existing local homes, condos and townhomes sold during September was 3,571, up from 3,541 in September 2016. Compared to one year ago, sales were down 0.4 percent for homes, but up 7.0 percent for condos and townhomes.
According to GLVAR, total sales so far in 2017 continue to outpace 2016, when 41,720 total properties were sold in Southern Nevada. At this rate, GLVAR statistics show that 2017 is on pace to be the best year for local home sales since at least 2012.
...
In recent years, GLVAR has been reporting fewer distressed sales and more traditional home sales, where lenders are not controlling the transaction. That trend continued in September, when 2.9 percent of all local sales were short sales – which occur when lenders allow borrowers to sell a home for less than what they owe on the mortgage. That’s down from 4.6 percent of all sales in September 2016. Another 2.3 percent of all September sales were bank-owned, down from 6.0 percent one year ago.
emphasis added
2) Active inventory (single-family and condos) is down sharply from a year ago.
3) Fewer distressed sales.
Comment: A Hurricane Impacted Employment Report
by Calculated Risk on 10/06/2017 10:00:00 AM
The headline jobs number was well below expectations, and there were downward revisions to the previous two months combined. However wages were up, and the unemployment rate down (the household survey counts people as employed even if there weren't paid during the reference week - like those in hurricane impacted areas).
Earlier: September Employment Report: 33,000 Jobs Lost, 4.2% Unemployment Rate
This negative headline jobs report followed a record 83 consecutive months of positive jobs reports (although this might be revised up - that is what happened following hurricane Katrina).
In September, the year-over-year change was 1.777 million jobs. This is the lowest year-over-year job growth since August 2011.
On the impact of Hurricane Harvey from the BLS:
Hurricane Irma made landfall in Florida on September 10--during the reference period for both the establishment and household surveys--causing severe damage in Florida and other parts of the Southeast. Hurricane Harvey made landfall in Texas on August 25--prior to the September reference periods--resulting in severe damage in Texas and other areas of the Gulf Coast.The hurricanes were the key reason I took the under versus the consensus view.
Our analysis suggests that the net effect of these hurricanes was to reduce the estimate of total nonfarm payroll employment for September. There was no discernible effect on the national unemployment rate.
Average Hourly Earnings
 Click on graph for larger image.
This graph is based on “Average Hourly Earnings” from the Current Employment Statistics (CES) (aka "Establishment") monthly employment report. Note: There are also two quarterly sources for earnings data: 1) “Hourly Compensation,” from the BLS’s Productivity and Costs; and 2) the Employment Cost Index which includes wage/salary and benefit compensation.
The graph shows the nominal year-over-year change in "Average Hourly Earnings" for all private employees. Nominal wage growth was at 2.9% YoY in September.
Wage growth has generally been trending up.
Part Time for Economic Reasons
 From the BLS report:
The number of persons employed part time for economic reasons (sometimes referred to as involuntary part-time workers) was little changed at 5.1 million in September. These individuals, who would have preferred full-time employment, were working part time because their hours had been cut back or because they were unable to find full-time jobs.The number of persons working part time for economic reasons decreased in September. This is the lowest level since March 2008. The number working part time for economic reasons suggests a little slack still in the labor market.
These workers are included in the alternate measure of labor underutilization (U-6) that declined to 8.3% in September. This is the lowest level for U-6 since 2007.
Unemployed over 26 Weeks
 This graph shows the number of workers unemployed for 27 weeks or more.
 According to the BLS, there are 1.73 million workers who have been unemployed for more than 26 weeks and still want a job. This was down from 1.74 million in August.
This is generally trending down, but still a little elevated.
The headline jobs number was disappointing, but that was impacted by the hurricanes. Wages were up, the unemployment rate down, and U-6 the lowest since 2007 - all positive signs. Overall this was a hurricane impacted employment report.
September Employment Report: 33,000 Jobs Lost, 4.2% Unemployment Rate
by Calculated Risk on 10/06/2017 08:46:00 AM
From the BLS:
The unemployment rate declined to 4.2 percent in September, and total nonfarm payroll employment changed little (-33,000), the U.S. Bureau of Labor Statistics reported today. A sharp employment decline in food services and drinking places and below-trend growth in some other industries likely reflected the impact of Hurricanes Irma and Harvey.
...
Hurricane Irma made landfall in Florida on September 10--during the reference period for both the establishment and household surveys--causing severe damage in Florida and other parts of the Southeast. Hurricane Harvey made landfall in Texas on August 25--prior to the September reference periods--resulting in severe damage in Texas and other areas of the Gulf Coast.
Our analysis suggests that the net effect of these hurricanes was to reduce the estimate of total nonfarm payroll employment for September. There was no discernible effect on thenational unemployment rate.
...
The change in total nonfarm payroll employment for July was revised down from +189,000 to +138,000, and the change for August was revised up from +156,000 to +169,000. With these revisions, employment gains in July and August combined were 38,000 less than previously reported.
...
In September, average hourly earnings for all employees on private nonfarm payrolls rose by 12 cents to $26.55. Over the past 12 months, average hourly earnings have increased by 74 cents, or 2.9 percent.
emphasis added
 Click on graph for larger image.
The first graph shows the monthly change in payroll jobs, ex-Census (meaning the impact of the decennial Census temporary hires and layoffs is removed - mostly in 2010 - to show the underlying payroll changes).
Total payrolls decreased by 33 thousand in September (private payrolls decreased 40 thousand).
Payrolls for July and August were revised down by a combined 38 thousand.
 This graph shows the year-over-year change in total non-farm employment since 1968.
In September the year-over-year change was 1.78 million jobs. This is the smallest year-over-year gain since 2012.
The third graph shows the employment population ratio and the participation rate.
 The Labor Force Participation Rate was increased in September at 63.1%. This is the percentage of the working age population in the labor force. A large portion of the recent decline in the participation rate is due to demographics.
 The Employment-Population ratio decreased to 60.4% (black line).
I'll post the 25 to 54 age group employment-population ratio graph later.
 The fourth graph shows the unemployment rate.
 The unemployment rate decreased in September to 4.2%.
This was below expectations of 95,000 jobs, and the previous two months combined were revised down. The headline jobs number was weak - mostly due to the impact of the hurricanes - but wages picked up and the unemployment rate declined further.
I'll have much more later ...
Thursday, October 05, 2017
Hotel Occupancy Rate just Behind Record Year
by Calculated Risk on 10/05/2017 05:44:00 PM
From HotelNewsNow.com: STR: US hotel results for week ending 30 September
The U.S. hotel industry reported positive year-over-year results in the three key performance metrics during the week of 24-30 September 2017, according to data from STR.The following graph shows the seasonal pattern for the hotel occupancy rate using the four week average.
In comparison with the week of 25 September through 1 October 2016, the industry recorded the following:
• Occupancy: +0.4% to 70.3%
• Average daily rate (ADR): +0.8% to US$128.29
• Revenue per available room (RevPAR): +1.2% to US$90.13
Among the Top 25 Markets, Houston, Texas, reported the largest year-over-year increases in occupancy (+42.9% to 86.7%) and RevPAR (+55.6% to US$100.59). Amid recovery from Hurricane Harvey, Houston also posted the second-largest ADR increase (+8.9% to US$116.08).
Orlando, Florida, posted the second-highest lift in occupancy (+18.0% to 83.3%), that coupled with the only double-digit increase in ADR (+17.9% to US$125.34), led the second-largest jump in RevPAR (+39.0% to US$104.36).
emphasis added
 The red line is for 2017, dash light blue is 2016, dashed orange is 2015 (best year on record), blue is the median, and black is for 2009 (the worst year since the Great Depression for hotels).
Currently the occupancy rate, to date, is ahead of last year, and just behind the record year in 2015. The hurricanes might push the annual occupancy rate to a new record.
Seasonally, the occupancy rate will increase into the Fall business travel season.
Data Source: STR, Courtesy of HotelNewsNow.com
Goldman: September Payrolls Preview
by Calculated Risk on 10/05/2017 01:57:00 PM
A few brief excerpts from a note by Goldman Sachs economist Spencer Hill:
We estimate that nonfarm payroll growth slowed to +50k in September, below consensus of +80k and the 3-month average pace of +185k. Our forecast reflects the widespread flooding and power outages caused by Hurricanes Harvey and Irma, which affected over 10% of the population and caused over $100bn in damages. The impact on tomorrow’s report is highly uncertain, but our base-case assumes a significant impact of -125k that partially offsets continued job growth in the rest of the country.CR Note: I posted an employment preview yesterday.
We also expect the hurricanes to weigh on the household survey results ... we estimate a rise [in the unemployment rate] to 4.5%). Finally, we estimate average hourly earnings increased 0.4% month over month and 2.7% year over year, reflecting positive calendar effects.
emphasis added
Trade Deficit at $42.4 Billion in August
by Calculated Risk on 10/05/2017 09:34:00 AM
Earlier from the Department of Commerce reported:
The U.S. Census Bureau and the U.S. Bureau of Economic Analysis, through the Department of Commerce, announced today that the goods and services deficit was $42.4 billion in August, down $1.2 billion from $43.6 billion in July, revised. August exports were $195.3 billion, $0.8 billion more than July exports. August imports were $237.7 billion, $0.4 billion less than July imports.
 Click on graph for larger image.
Exports increased, and imports decreased, in August.
Exports are 18% above the pre-recession peak and up 4% compared to August 2016; imports are 2% above the pre-recession peak, and up 4% compared to August 2016.
In general, trade has been picking up.
The second graph shows the U.S. trade deficit, with and without petroleum.
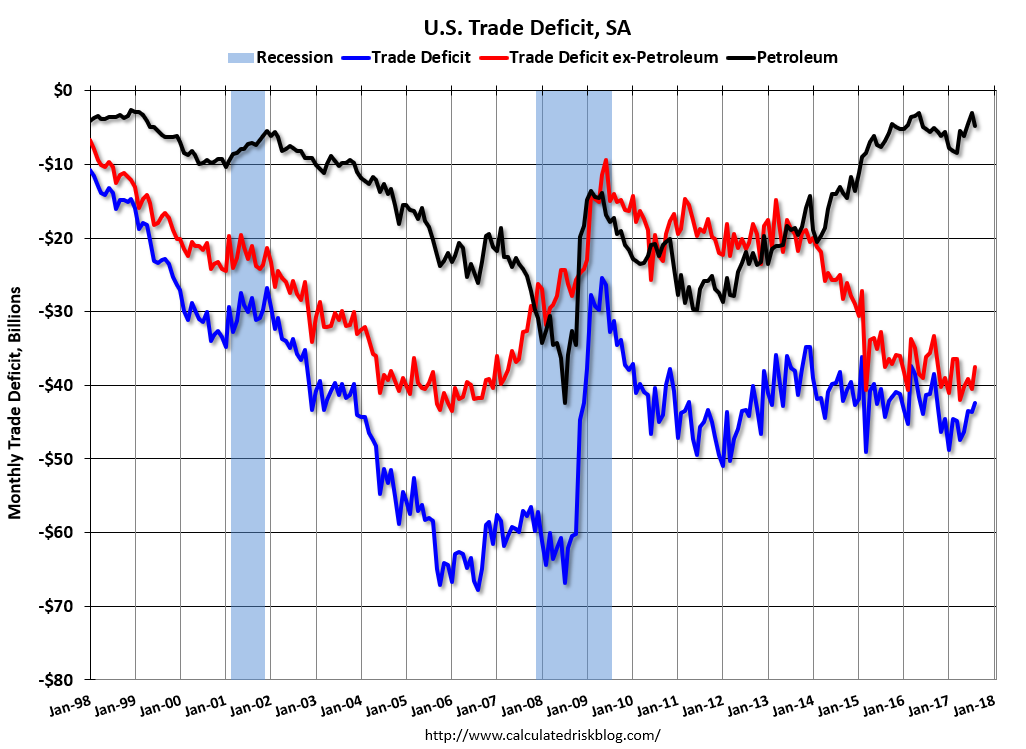 The blue line is the total deficit, and the black line is the petroleum deficit, and the red line is the trade deficit ex-petroleum products.
Oil imports averaged $44.11 in August, up from $43.20 in July, and up from $39.38 in August 2016. The petroleum deficit had been declining for years - and is the major reason the overall deficit has mostly moved sideways since early 2012.
The trade deficit with China increased to $34.9 billion in August, from $33.9 billion in August 2016.
Weekly Initial Unemployment Claims decrease to 260,000
by Calculated Risk on 10/05/2017 08:33:00 AM
The DOL reported:
In the week ending September 30, the advance figure for seasonally adjusted initial claims was 260,000, a decrease of 12,000 from the previous week's unrevised level of 272,000. The 4-week moving average was 268,250, a decrease of 9,500 from the previous week's unrevised average of 277,750.The previous week was unrevised.
Hurricanes Harvey and Irma impacted this week's claims.
emphasis added
The following graph shows the 4-week moving average of weekly claims since 1971.
 Click on graph for larger image.
The dashed line on the graph is the current 4-week average. The four-week average of weekly unemployment claims decreased to 268,250.
This was slightly below the consensus forecast. The recent increase in claims is due to the hurricanes.
Wednesday, October 04, 2017
Thursday: Trade Deficit, Unemployment Claims
by Calculated Risk on 10/04/2017 06:32:00 PM
From Matthew Graham at Mortgage News Daily: Mortgage Rates Still Holding Near Recent Highs
Mortgage rates were very slightly lower today, but not by enough to have an impact on the actual interest rates being quoted. Specifically, the "effective rate"--which factors upfront costs into an overall cost of financing is slightly lower due to changes in those upfront costs. But borrowers will be seeing the same interest rate at the top of the page on today's loan quotes compared to yesterday. [30YR FIXED - 3.875-4.0%]Thursday:
• At 8:30 AM ET, The initial weekly unemployment claims report will be released. The consensus is for 265 thousand initial claims, down from 272 thousand the previous week.
• Also at 8:30 AM, Trade Balance report for August from the Census Bureau. The consensus is for the U.S. trade deficit to be at $42.5 billion in August from $43.7 billion in July.
September Employment Preview
by Calculated Risk on 10/04/2017 01:58:00 PM
On Friday at 8:30 AM ET, the BLS will release the employment report for September. A key question is how much hurricanes Harvey and Irma impacted employment in September. Merrill Lynch economists noted this morning:
"While Hurricane Irma made landfall on September 10th, preparations and evacuations began well in advance of the storm which likely impacted business and employment activity to start the month. Moreover, many homes and businesses remained without power throughout the week of September 10th (the BLS’s survey reference week) which could also distort the payroll figures. The unemployment rate should not be materially affected as workers who were not at work due to weather issues would still be counted as employed in the household survey."In September 2005, following Hurricane Katrina in late August of that year, the BLS initially reported 35,000 jobs lost (later revised up to a gain of 67,000 jobs). That was a sharp slowdown from prior months - and something similar probably happened this year.
Note: Puerto Rico is not included in the national employment report.
The consensus, according to Bloomberg, is for an increase of 100,000 non-farm payroll jobs in September (with a range of estimates between 0 to 140,000), and for the unemployment rate to be unchanged at 4.4%.
The BLS reported 156,000 jobs added in August.
Here is a summary of recent data:
• The ADP employment report showed an increase of 135,000 private sector payroll jobs in September. This was below consensus expectations of 150,000 private sector payroll jobs added. The ADP report hasn't been very useful in predicting the BLS report for any one month, but in general, this suggests employment growth below expectations.
• The ISM manufacturing employment index increased in September to 60.3%. A historical correlation between the ISM manufacturing employment index and the BLS employment report for manufacturing, suggests that private sector BLS manufacturing payroll increased about 35,000 in September. The ADP report indicated manufacturing jobs increased 18,000 in September.
The ISM non-manufacturing employment index increased in September to 56.8%. A historical correlation between the ISM non-manufacturing employment index and the BLS employment report for non-manufacturing, suggests that private sector BLS non-manufacturing payroll jobs increased about 255,000 in September.
Combined, the ISM indexes suggests employment gains of about 290,000. This suggests employment growth well above expectations.
• Initial weekly unemployment claims averaged 278,000 in September, up sharply from 237,000 in August. For the BLS reference week (includes the 12th of the month), initial claims were at 260,000, up from 232,000 during the reference week in August.
The increase during the reference week suggests a weaker employment report in September than in August.
• The final September University of Michigan consumer sentiment index decreased to 95.1 from the August reading of 96.8. Sentiment is frequently coincident with changes in the labor market, but there are other factors too like gasoline prices and politics.
• Conclusion: It is difficult to guess the impact of the hurricanes on the employment report. The ADP report and weekly claims suggest a weaker employment report. The ISM surveys probably miss the impact of the hurricanes - otherwise those reports would suggest solid employment gains in September. My guess is the employment report comes in below the consensus forecast.
Note: Any number below 152,000 jobs means the year-over-year gain in employment will fall below 2 million for the first time since early 2013. A negative headline payroll number (not impossible), would break the streak of 83 consecutive months of job gains - by far the longest streak of positive monthly gains in BLS history.
ISM Non-Manufacturing Index increased to 59.8% in September
by Calculated Risk on 10/04/2017 10:05:00 AM
The September ISM Non-manufacturing index was at 59.8%, up from 55.3% in August. The employment index increased in September to 56.8%, from 56.2%. Note: Above 50 indicates expansion, below 50 contraction.
From the Institute for Supply Management: September 2017 Non-Manufacturing ISM Report On Business®
Economic activity in the non-manufacturing sector grew in September for the 93rd consecutive month, say the nation’s purchasing and supply executives in the latest Non-Manufacturing ISM® Report On Business®.
The report was issued today by Anthony Nieves, CPSM, C.P.M., A.P.P., CFPM, Chair of the Institute for Supply Management® (ISM®) Non-Manufacturing Business Survey Committee: "The NMI® registered 59.8 percent, which is 4.5 percentage points higher than the August reading of 55.3 percent. This represents continued growth in the non-manufacturing sector at a faster rate. This is the highest reading since August 2005 when the index registered 61.3 percent. The Non-Manufacturing Business Activity Index increased to 61.3 percent, 3.8 percentage points higher than the August reading of 57.5 percent, reflecting growth for the 98th consecutive month, at a faster rate in September. The New Orders Index registered 63 percent, 5.9 percentage points higher than the reading of 57.1 percent in August. The Employment Index increased 0.6 percentage point in September to 56.8 percent from the August reading of 56.2 percent. The Prices Index increased substantially by 8.4 percentage points from the August reading of 57.9 percent to 66.3 percent, indicating prices increased in September for the fourth consecutive month. This is the highest reading since February 2012 when the index registered 67.6 percent. According to the NMI®, 15 non-manufacturing industries reported growth. The non-manufacturing sector has reflected strong growth in the month of September despite the impact on the supply chain from the recent hurricanes. Respondents’ comments indicate a good outlook for business conditions."
emphasis added
 Click on graph for larger image.
This graph shows the ISM non-manufacturing index (started in January 2008) and the ISM non-manufacturing employment diffusion index.
This suggests faster expansion in September than in August.


