 RSS Feed
 by Calculated Risk on 10/02/2017 01:22:00 PM
Monday, October 02, 2017
Reis: Mall Vacancy Rate increased in Q3 2017
Reis reported that the vacancy rate for regional malls was 8.3% in Q3 2017, up from 8.1% in Q2, and up from 7.8% in Q3 2016. This is down from a cycle peak of 9.4% in Q3 2011.
For Neighborhood and Community malls (strip malls), the vacancy rate was 10.0% in Q3, unhanged from 10.0% in Q2, and up from 9.9% in Q3 2016. For strip malls, the vacancy rate peaked at 11.1% in Q3 2011.
Comments from Reis Economist Barbara Byrne Denham:
The increase in the Mall vacancy rate was due to confirmed closings of JC Penney and Sears stores. This only increased vacancy by 0.2% to 8.3%. Since the third quarter of 2016, the mall vacancy rate has increased 50 basis points from 7.8% which was the lowest since 2008. Rents increased only 0.2% as most owners kept rents flat.
The [strip mall] retail statistics continued to defy the otherwise negative reports of store closures, posting positive net absorption (occupancy growth) in the quarter and holding vacancy at 10.0%. Asking rents increased 0.4%, low by any standard but still positive and contrary to the sentiment expressed in the media.
New construction of 1.6 million square feet was the lowest level of completions since 2014. Net absorption was 578,000 square feet, the lowest since 2010 and the second quarter in a row of less than 1.0 million square feet occupancy growth. The underlying data shows that absorption was positive in July and August but negative in September as a number of stores in the Reis survey pool closed in the month.
emphasis added
 Click on graph for larger image.
This graph shows the strip mall vacancy rate starting in 1980 (prior to 2000 the data is annual). The regional mall data starts in 2000. Back in the '80s, there was overbuilding in the mall sector even as the vacancy rate was rising. This was due to the very loose commercial lending that led to the S&L crisis.
In the mid-'00s, mall investment picked up as mall builders followed the "roof tops" of the residential boom (more loose lending). This led to the vacancy rate moving higher even before the recession started. Then there was a sharp increase in the vacancy rate during the recession and financial crisis.
Recently both the strip mall and regional mall vacancy rates have increased from an already elevated level.
Mall vacancy data courtesy of Reis.
Construction Spending increased in August
by Calculated Risk on 10/02/2017 11:06:00 AM
Earlier today, the Census Bureau reported that overall construction spending increased in August:
Construction spending during August 2017 was estimated at a seasonally adjusted annual rate of $1,218.3 billion, 0.5 percent above the revised July estimate of $1,212.3 billion. The August figure is 2.5 percent above the August 2016 estimate of $1,189.1 billion.Private and public spending both increased in August:
Spending on private construction was at a seasonally adjusted annual rate of $954.8 billion, 0.4 percent above the revised July estimate of $950.5 billion. ...
In August, the estimated seasonally adjusted annual rate of public construction spending was $263.5 billion, 0.7 percent above the revised July estimate of $261.7 billion.
emphasis added
 Click on graph for larger image.
This graph shows private residential and nonresidential construction spending, and public spending, since 1993. Note: nominal dollars, not inflation adjusted.
Private residential spending has been increasing, but is still 23% below the bubble peak.
Non-residential spending is now 5% above the previous peak in January 2008 (nominal dollars).
Public construction spending is now 19% below the peak in March 2009, and only slightly above the austerity low in February 2014.
 The second graph shows the year-over-year change in construction spending.
On a year-over-year basis, private residential construction spending is up 12%. Non-residential spending is down 2% year-over-year. Public spending is down 5% year-over-year.
This was above the consensus forecast of a 0.3% increase for August, and spending for previous months were revised up slightly. A solid report.
ISM Manufacturing index increased to 60.8 in September
by Calculated Risk on 10/02/2017 10:04:00 AM
The ISM manufacturing index indicated expansion in September. The PMI was at 60.8% in September, up from 56.3% in August. The employment index was at 60.3%, up from 59.9% last month, and the new orders index was at 64.6%, up from 60.3%.
From the Institute for Supply Management: September 2017 Manufacturing ISM® Report On Business®
Economic activity in the manufacturing sector expanded in September, and the overall economy grew for the 100th consecutive month, say the nation's supply executives in the latest Manufacturing ISM® Report On Business®.
The report was issued today by Timothy R. Fiore, CPSM, C.P.M., Chair of the Institute for Supply Management® (ISM®) Manufacturing Business Survey Committee: "The September PMI® registered 60.8 percent, an increase of 2 percentage points from the August reading of 58.8 percent. The New Orders Index registered 64.6 percent, an increase of 4.3 percentage points from the August reading of 60.3 percent. The Production Index registered 62.2 percent, a 1.2 percentage point increase compared to the August reading of 61 percent. The Employment Index registered 60.3 percent, an increase of 0.4 percentage point from the August reading of 59.9 percent. The Supplier Deliveries Index registered 64.4 percent, a 7.3 percentage point increase from the August reading of 57.1 percent. The Inventories Index registered 52.5 percent, a decrease of 3 percentage points from the August reading of 55.5 percent. The Prices Index registered 71.5 percent in September, a 9.5 percentage point increase from the August level of 62, indicating higher raw materials prices for the 19th consecutive month. Comments from the panel reflect expanding business conditions, with new orders, production, employment, order backlogs and export orders all growing in September; as well as, supplier deliveries slowing (improving) and inventories growing at a slower rate during the period. The Customers’ Inventories Index remains at low levels."
emphasis added
 Click on graph for larger image.
Here is a long term graph of the ISM manufacturing index.
This was above expectations of 58.0%, and suggests manufacturing expanded at a faster pace in September than in August.
A strong report.
Black Knight Mortgage Monitor: "350,000 in Hurricane Irma Disaster Areas Have Negative or Limited Equity"
by Calculated Risk on 10/02/2017 08:09:00 AM
Black Knight released their Mortgage Monitor report for August today. According to Black Knight, 3.93% of mortgages were delinquent in August, down from 4.24% in August 2016. Black Knight also reported that 0.76% of mortgages were in the foreclosure process, down from 1.04% a year ago.
This gives a total of 4.69% delinquent or in foreclosure.
Press Release: Black Knight’s Mortgage Monitor: Most Borrowers Impacted by Hurricane Harvey Have Significant Equity; 350,000 in Hurricane Irma Disaster Areas Have Negative or Limited Equity
Today, the Data & Analytics division of Black Knight, Inc. released its latest Mortgage Monitor Report, based on data as of the end of August 2017. On the heels of reporting an early, 16 percent spike in mortgage delinquencies in Hurricane Harvey-related disaster areas, Black Knight examined the equity outlook for mortgage holders impacted by either Hurricane Harvey or Hurricane Irma. As Black Knight Data & Analytics Executive Vice President Ben Graboske explained, despite the extent of the damage in Texas, Hurricane Harvey-impacted borrowers have a greater equity stake, which may bode well for long-term recovery.
“Before Hurricane Harvey made landfall, the average combined loan-to-value ratio (CLTV) for homeowners with mortgages in what became FEMA-designated disaster areas was 53 percent,” said Graboske. “Right on par with the national average, that’s the lowest we’ve seen since prior to 2004. This equates to approximately $131,000 in equity per borrower. That works out to a lot of skin in the game, and will likely serve as strong motivation for borrowers not to walk away from a storm-damaged home. In addition, over 75 percent of mortgages in the Hurricane Harvey footprint are held in Fannie Mae, Freddie Mac or Ginnie Mae securities. Therefore, the bulk of borrowers affected by the storm will be able to find assistance under the various foreclosure moratoriums and forbearance programs that have been instituted. While we have already seen an early spike in delinquencies in Hurricane Harvey-impacted disaster areas, with many more likely to follow in September’s data, the combination of available assistance and healthy equity stakes on the part of borrowers are both very positive signs for the long term.
“In Florida, Hurricane Irma impacted a much larger portion of the state. The 48 FEMA-declared Hurricane Irma disaster areas include over 90 percent of the state’s mortgaged properties. To put this in perspective, that means that by balance, over five percent of all mortgages in the U.S. are included in Hurricane Irma’s disaster areas. Unlike Houston, though, where all-time-high home prices have contributed to a significant reduction in negative equity, home prices in Florida remain 17 percent below their 2006 peak. On average, borrowers in Hurricane Irma-related disaster areas have a CLTV of 57 percent, somewhat higher than the national average. Of the 3.2 million borrowers impacted by Irma, an estimated 170,000 were still in negative equity positions before the storm, with another 180,000 having less than 10 percent equity in their homes. Due to lackluster home price recovery since the housing crisis, the negative equity rate in Irma’s disaster area is nearly twice the national average.”
emphasis added
 Click on graph for larger image.
This graphic from Black Knight looks at negative equity volumes and rates over time.
From Black Knight:
• Along with increasing the amount of lendable equity, strong home price gains so far in 2017 have helped to continue to shrink the population of borrowers who owe more on their mortgages than their homes are worthThere is much more in the mortgage monitor.
• Thus far in 2017, the number of borrowers underwater on their mortgage has fallen by nearly 750K, from 2.2M entering the year to 1.4M as of the end of Q2
• Today, just 1.4M borrowers remain underwater, representing 2.8 percent of all homeowners with a mortgage
• This is down from over 15M and more than 28 percent of the mortgage market at the end of 2011
Sunday, October 01, 2017
Monday: ISM Mfg Index, Construction Spending
by Calculated Risk on 10/01/2017 07:18:00 PM
Weekend:
• Schedule for Week of Oct 1, 2017
Monday:
• Early, Reis Q3 2017 Mall Survey of rents and vacancy rates.
• At 10:00 AM ET, ISM Manufacturing Index for September. The consensus is for the ISM to be at 58.0, down from 58.8 in August. The ISM manufacturing index indicated expansion in August. The PMI was at 58.8% in August, the employment index was at 59.9%, and the new orders index was at 60.3%.
• Also at 10:00 AM, Construction Spending for August. The consensus is for a 0.3% increase in construction spending.
From CNBC: Pre-Market Data and Bloomberg futures: S&P 500 are up 4, and DOW futures are up 38 (fair value).
Oil prices were mixed over the last week with WTI futures at $51.67 per barrel and Brent at $56.72 per barrel. A year ago, WTI was at $48, and Brent was at $48 - so oil prices are up year-over-year.
Here is a graph from Gasbuddy.com for nationwide gasoline prices. Nationally prices are at $2.53 per gallon - up sharply in September due to Hurricane Harvey, but now declining - a year ago prices were at $2.22 per gallon - so gasoline prices are up 31 cents per gallon year-over-year.
September 2017: Unofficial Problem Bank list declines to 119 Institutions, Q3 2017 Transition Matrix
by Calculated Risk on 10/01/2017 08:09:00 AM
Note: Surferdude808 compiles an unofficial list of Problem Banks compiled only from public sources.
Here is the unofficial problem bank list for September 2017.
Here are the monthly changes and a few comments from surferdude808:
Update on the Unofficial Problem Bank List for September 2017. During the month, the list fell a bit from 123 institutions to 119 after five removals and one addition. Assets declined to $27.6 billion from $28.3 billion a month earlier. A year ago, the list held 177 institutions with assets of $55.5 billion.
This month, actions have been terminated against Community Bank of Pickens County, Jasper, GA ($331 million); Commerce Bank of Arizona, Tucson, AZ ($183 million Ticker: CBOF); The First Bank of Baldwin, Baldwin, WI ($170 million); The State Bank of Geneva, Geneva, IL ($84 million) and Champion Bank, Parker, CO ($50 million).
The addition this month was Markesan State Bank, Markesan, WI ($154 million).
With it being the end of the third quarter, we bring an updated transition matrix to detail how banks are moving off the Unofficial Problem Bank List. Since the Unofficial Problem Bank List was first published on August 7, 2009 with 389 institutions, a total of 1,722 institutions have appeared on a weekly or monthly list at some point. Only 6.9 percent of the banks that have appeared on a list remain today. In all, there have been 1,603 institutions that have transitioned through the list. Departure methods include 929 action terminations, 405 failures, 252 mergers, and 17 voluntary liquidations. Of the 389 institutions on the first published list, only 12 or 3.1 percent still remain in a designated troubled status eight years later. The 405 failures represent 23.5 percent of the 1,722 institutions that have made an appearance on the list. This failure rate is well above the 10-12 percent rate frequently cited in media reports on the failure rate of banks on the FDIC's official list.
| Unofficial Problem Bank List | |||
|---|---|---|---|
| Change Summary | |||
| Number of Institutions | Assets ($Thousands) | ||
| Start (8/7/2009) | 389 | 276,313,429 | |
| Subtractions | |||
| Action Terminated | 175 | (64,753,748) | |
| Unassisted Merger | 40 | (9,818,439) | |
| Voluntary Liquidation | 4 | (10,584,114) | |
| Failures | 158 | (186,397,337) | |
| Asset Change | (517,200) | ||
| Still on List at 9/30/2017 | 12 | 4,242,591 | |
| Additions after 8/7/2009 | 107 | 23,392,839 | |
| End (9/30//2017) | 119 | 27,635,430 | |
| Intraperiod Removals1 | |||
| Action Terminated | 754 | 312,105,466 | |
| Unassisted Merger | 212 | 81,200,015 | |
| Voluntary Liquidation | 13 | 2,515,855 | |
| Failures | 247 | 125,118,011 | |
| Total | 1,226 | 520,939,347 | |
| 1Institution not on 8/7/2009 or 9/30/2017 list but appeared on a weekly list. | |||
Saturday, September 30, 2017
Schedule for Week of Oct 1, 2017
by Calculated Risk on 9/30/2017 08:11:00 AM
The key report this week is the September employment report on Friday.
Other key indicators include the September ISM manufacturing and non-manufacturing indexes, September auto sales and the August Trade deficit.
Early: Reis Q3 2017 Mall Survey of rents and vacancy rates.
 10:00 AM: ISM Manufacturing Index for September. The consensus is for the ISM to be at 58.0, down from 58.8 in August.
Here is a long term graph of the ISM manufacturing index.
The ISM manufacturing index indicated expansion in August. The PMI was at 58.8% in August, the employment index was at 59.9%, and the new orders index was at 60.3%.
10:00 AM: Construction Spending for August. The consensus is for a 0.3% increase in construction spending.
 All day: Light vehicle sales for September. The consensus is for light vehicle sales to be 16.7 million SAAR in September, up from 16.1 million in August (Seasonally Adjusted Annual Rate).
This graph shows light vehicle sales since the BEA started keeping data in 1967. The dashed line is the August sales rate.
10:00 AM ET: The CoreLogic House Price index for August.
7:00 AM ET: The Mortgage Bankers Association (MBA) will release the results for the mortgage purchase applications index.
8:15 AM: The ADP Employment Report for September. This report is for private payrolls only (no government). The consensus is for 150,000 payroll jobs added in September, down from 237,000 added in August.
10:00 AM: the ISM non-Manufacturing Index for September. The consensus is for index to increase to 55.4 from 55.3 in August.
3:15 PM: Speech by Fed Chair Janet Yellen, Brief welcoming remarks, At the Community Banking in the 21st Century Research and Policy Conference, hosted by the Federal Reserve System and the Conference of State Bank Supervisors, St. Louis, Missouri
8:30 AM ET: The initial weekly unemployment claims report will be released. The consensus is for 265 thousand initial claims, down from 272 thousand the previous week.
 8:30 AM: Trade Balance report for August from the Census Bureau.
 This graph shows the U.S. trade deficit, with and without petroleum, through July. The blue line is the total deficit, and the black line is the petroleum deficit, and the red line is the trade deficit ex-petroleum products.
The consensus is for the U.S. trade deficit to be at $42.5 billion in August from $43.7 billion in July.
8:30 AM: Employment Report for September. The consensus is for an increase of 95,000 non-farm payroll jobs added in September, down from the 156,000 non-farm payroll jobs added in August.
 The consensus is for the unemployment rate to increase to 4.4%.
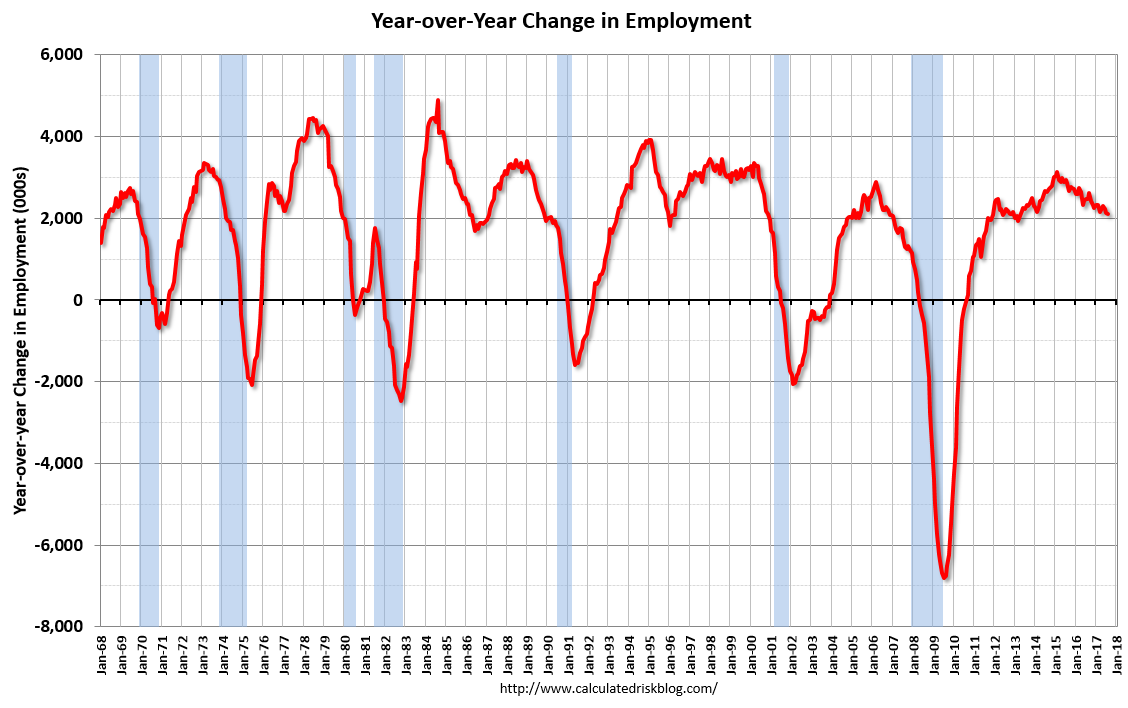
This graph shows the year-over-year change in total non-farm employment since 1968.
In August the year-over-year change was 2.10 million jobs.
A key will be the change in wages.
3:00 PM: Consumer Credit for August from the Federal Reserve.
Friday, September 29, 2017
Fannie Mae: Mortgage Serious Delinquency rate declined in August, Lowest since December 2007
by Calculated Risk on 9/29/2017 04:39:00 PM
Fannie Mae reported that the Single-Family Serious Delinquency rate declined to 0.99% in August, from 1.00% in July. The serious delinquency rate is down from 1.24% in August 2016.
This is the lowest serious delinquency rate since December 2007.
These are mortgage loans that are "three monthly payments or more past due or in foreclosure".
The Fannie Mae serious delinquency rate peaked in February 2010 at 5.59%.
 Click on graph for larger image
By vintage, for loans made in 2004 or earlier (4% of portfolio), 2.65% are seriously delinquent. For loans made in 2005 through 2008 (7% of portfolio), 5.71% are seriously delinquent, For recent loans, originated in 2009 through 2017 (89% of portfolio), only 0.32% are seriously delinquent. So Fannie is still working through poor performing loans from the bubble years.
In the short term - over the next several months - the delinquency rate will probably increase slightly due to the hurricanes. After the hurricane bump, maybe the rate will decline another 0.3 percentage points or so to a cycle bottom, but this is pretty close to normal.
Note: Freddie Mac reported earlier.
Oil Rigs "Signs of life in the rig count"
by Calculated Risk on 9/29/2017 02:33:00 PM
A few comments from Steven Kopits of Princeton Energy Advisors LLC on Sept 29, 2017:
• Rig counts were off modestly this week
• Total US oil rigs were up 6 to 750
• Horizontal oil rigs were up 6 to 640
...
• WTI suggests we have seen the rig bottom for the mini-cycle.
 Click on graph for larger image.
CR note: This graph shows the US horizontal rig count by basin.
Graph and comments Courtesy of Steven Kopits of Princeton Energy Advisors LLC.
Q3 GDP Forecasts: Close to 2%
by Calculated Risk on 9/29/2017 11:43:00 AM
From the Altanta Fed: GDPNow
The GDPNow model forecast for real GDP growth (seasonally adjusted annual rate) in the third quarter of 2017 is 2.3 percent on September 29, up from 2.1 percent on September 27. Since the previous GDPNow update on Wednesday, the forecasts of the contributions of net exports and inventory investment to third-quarter GDP growth increased from -0.16 percentage points and 0.90 percentage points, respectively, to -0.01 percentage points and 1.13 percentage points, respectively. The forecasts of real consumer spending growth and real nonresidential equipment investment growth declined from 2.0 percent and 5.7 percent, respectively, to 1.8 percent and 4.0 percent, respectively.From the NY Fed Nowcasting Report
emphasis added
The New York Fed Staff Nowcast stands at 1.5% for 2017:Q3 and 2.0% for 2017:Q4.CR Note: Based on the August report, PCE looks sluggish in Q3 (mid-month method at 1.7%).


