 RSS Feed
 by Calculated Risk on 5/03/2017 06:40:00 PM
Wednesday, May 03, 2017
Thursday: Unemployment Claims, Trade Deficit
From Merrill Lynch on FOMC announcement:
The FOMC communicated today a lack of concern about the recent slowdown in economic data, describing it as "transitory" while "the fundamentals underpinning the continued growth of consumption remained solid". Not surprisingly then the statement was interpreted as hawkish relative to market expectations, as the Treasury curve bear flattened (10-year Treasury yield was 4bps higher while 30-year was flat) and the dollar appreciated.Thursday:
• At 8:30 AM ET, The initial weekly unemployment claims report will be released. The consensus is for 246 thousand initial claims, down from 257 thousand the previous week.
• Also at 8:30 AM, Trade Balance report for March from the Census Bureau. The consensus is for the U.S. trade deficit to be at $44.5 billion in March from $43.6 billion in February.
• At 10:00 AM, Manufacturers' Shipments, Inventories and Orders (Factory Orders) for March. The consensus is a 0.4% increase in orders.
FOMC Statement: No Change to Policy, Q1 Weakness "likely to be transitory"
by Calculated Risk on 5/03/2017 02:03:00 PM
As expected ...
FOMC Statement:
Information received since the Federal Open Market Committee met in March indicates that the labor market has continued to strengthen even as growth in economic activity slowed. Job gains were solid, on average, in recent months, and the unemployment rate declined. Household spending rose only modestly, but the fundamentals underpinning the continued growth of consumption remained solid. Business fixed investment firmed. Inflation measured on a 12-month basis recently has been running close to the Committee's 2 percent longer-run objective. Excluding energy and food, consumer prices declined in March and inflation continued to run somewhat below 2 percent. Market-based measures of inflation compensation remain low; survey-based measures of longer-term inflation expectations are little changed, on balance.
Consistent with its statutory mandate, the Committee seeks to foster maximum employment and price stability. The Committee views the slowing in growth during the first quarter as likely to be transitory and continues to expect that, with gradual adjustments in the stance of monetary policy, economic activity will expand at a moderate pace, labor market conditions will strengthen somewhat further, and inflation will stabilize around 2 percent over the medium term. Near-term risks to the economic outlook appear roughly balanced. The Committee continues to closely monitor inflation indicators and global economic and financial developments.
In view of realized and expected labor market conditions and inflation, the Committee decided to maintain the target range for the federal funds rate at 3/4 to 1 percent. The stance of monetary policy remains accommodative, thereby supporting some further strengthening in labor market conditions and a sustained return to 2 percent inflation.
In determining the timing and size of future adjustments to the target range for the federal funds rate, the Committee will assess realized and expected economic conditions relative to its objectives of maximum employment and 2 percent inflation. This assessment will take into account a wide range of information, including measures of labor market conditions, indicators of inflation pressures and inflation expectations, and readings on financial and international developments. The Committee will carefully monitor actual and expected inflation developments relative to its symmetric inflation goal. The Committee expects that economic conditions will evolve in a manner that will warrant gradual increases in the federal funds rate; the federal funds rate is likely to remain, for some time, below levels that are expected to prevail in the longer run. However, the actual path of the federal funds rate will depend on the economic outlook as informed by incoming data.
The Committee is maintaining its existing policy of reinvesting principal payments from its holdings of agency debt and agency mortgage-backed securities in agency mortgage-backed securities and of rolling over maturing Treasury securities at auction, and it anticipates doing so until normalization of the level of the federal funds rate is well under way. This policy, by keeping the Committee's holdings of longer-term securities at sizable levels, should help maintain accommodative financial conditions. Voting for the FOMC monetary policy action were: Janet L. Yellen, Chair; William C. Dudley, Vice Chairman; Lael Brainard; Charles L. Evans; Stanley Fischer; Patrick Harker; Robert S. Kaplan; Neel Kashkari; and Jerome H. Powell.
emphasis added
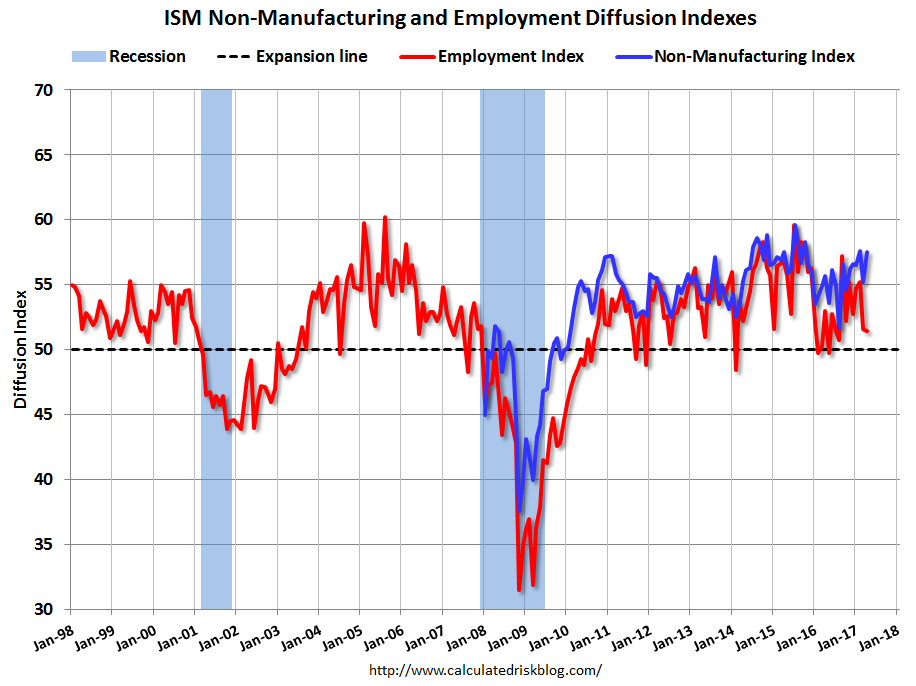
ISM Non-Manufacturing Index increased to 57.5% in April
by Calculated Risk on 5/03/2017 10:04:00 AM
The April ISM Non-manufacturing index was at 57.5%, up from 55.2% in March. The employment index decreased in April to 51.4%, from 51.6%. Note: Above 50 indicates expansion, below 50 contraction.
From the Institute for Supply Management:April 2017 Non-Manufacturing ISM Report On Business®
Economic activity in the non-manufacturing sector grew in April for the 88th consecutive month, say the nation's purchasing and supply executives in the latest Non-Manufacturing ISM® Report On Business®.
The report was issued today by Anthony Nieves, CPSM, C.P.M., A.P.P., CFPM, Chair of the Institute for Supply Management® (ISM®) Non-Manufacturing Business Survey Committee: "The NMI® registered 57.5 percent, which is 2.3 percentage points higher than the March reading of 55.2 percent. This represents continued growth in the non-manufacturing sector at a faster rate. The Non-Manufacturing Business Activity Index increased to 62.4 percent, 3.5 percentage points higher than the March reading of 58.9 percent, reflecting growth for the 93rd consecutive month, at a faster rate in April. The New Orders Index registered 63.2 percent, 4.3 percentage points higher than the reading of 58.9 percent in March. The Employment Index decreased 0.2 percentage point in April to 51.4 percent from the March reading of 51.6 percent. The Prices Index increased 4.1 percentage points from the March reading of 53.5 percent to 57.6 percent, indicating prices increased for the 13th consecutive month, at a faster rate in April. According to the NMI®, 16 non-manufacturing industries reported growth. In April the non-manufacturing sector reflected strong growth after a slowing in the rate from the previous month. Respondents’ comments are mostly positive about business conditions and the overall economy."
emphasis added
 Click on graph for larger image.
This graph shows the ISM non-manufacturing index (started in January 2008) and the ISM non-manufacturing employment diffusion index.
This suggests faster expansion in April than in March.
ADP: Private Employment increased 177,000 in April
by Calculated Risk on 5/03/2017 08:21:00 AM
Private sector employment increased by 177,000 jobs from March to April according to the April ADP National Employment Report®. ... The report, which is derived from ADP’s actual payroll data, measures the change in total nonfarm private employment each month on a seasonally-adjusted basis.This was above the consensus forecast for 170,000 private sector jobs added in the ADP report.
...
“In April we saw a moderate slowdown from the strong pace of hiring in the first quarter,” said Ahu Yildirmaz, vice president and co-head of the ADP Research Institute. “Despite a dip in job creation, the growth is more than strong enough to accommodate the growing population as the labor market nears full employment. Looking across company sizes, midsized businesses showed persistent growth for the past six months.”
Mark Zandi, chief economist of Moody’s Analytics said, “Job growth slowed in April due to a pullback in construction and retail jobs. The softness in construction is continued payback from outsized growth during the mild winter. Brick-and-mortar retailers cut jobs in response to withering competition from online merchants.”
The BLS report for April will be released Friday, and the consensus is for 185,000 non-farm payroll jobs added in April.
MBA: Mortgage "Purchase Apps Up, Refis Down in Latest Weekly Survey"
by Calculated Risk on 5/03/2017 07:00:00 AM
From the MBA: Purchase Apps Up, Refis Down in Latest MBA Weekly Survey
Mortgage applications decreased 0.1 percent from one week earlier, according to data from the Mortgage Bankers Association’s (MBA) Weekly Mortgage Applications Survey for the week ending April 28, 2017.
... The Refinance Index decreased 5 percent from the previous week. The seasonally adjusted Purchase Index increased 4 percent from one week earlier. The unadjusted Purchase Index increased 5 percent compared with the previous week and was 5 percent higher than the same week one year ago.
...
The average contract interest rate for 30-year fixed-rate mortgages with conforming loan balances ($424,100 or less) increased to 4.23 percent from 4.20 percent, with points decreasing to 0.32 from 0.37 (including the origination fee) for 80 percent loan-to-value ratio (LTV) loans.
emphasis added
 Click on graph for larger image.
The first graph shows the refinance index since 1990.
Refinance activity remains low - and will not increase significantly unless rates fall sharply.
 The second graph shows the MBA mortgage purchase index.
 Even with the increase in mortgage rates late last year, purchase activity is still up year-over-year.
Tuesday, May 02, 2017
Wednesday: FOMC Announcement, ADP Employment, ISM non-mfg Survey
by Calculated Risk on 5/02/2017 06:26:00 PM
A few excerpts from an FOMC preview by Goldman Sachs economist Spencer Hill:
• We expect the FOMC to keep policy unchanged next week and see only limited changes to the statement.Wednesday:
• Similar to the March statement, we expect constructive comments on economic activity, as we think Fed officials will view the slowdown in reported growth last quarter as temporary in nature ...We do expect a brief acknowledgement of the softer March core inflation data ...
...
• We look for the balance of risk assessment and the characterization of current policy (“accommodative”) to remain unchanged. We also believe the statement will probably leave out any explicit mention of fiscal policy, given the lack of incremental clarity on the legislative outlook since the March meeting.
• At 7:00 AM ET, The Mortgage Bankers Association (MBA) will release the results for the mortgage purchase applications index.
• At 8:15 AM, The ADP Employment Report for April. This report is for private payrolls only (no government). The consensus is for 170,000 payroll jobs added in April, down from 263,000 added in March.
• At 10:00 AM, the ISM non-Manufacturing Index for April. The consensus is for index to increase to 55.8 from 55.2 in March.
• At 2:00 PM, FOMC Meeting Announcement. No change to policy is expected at this meeting.
U.S. Light Vehicle Sales at 16.8 million annual rate in April
by Calculated Risk on 5/02/2017 02:57:00 PM
Based on a preliminary estimate from WardsAuto (and some CR calculations), light vehicle sales were at a 16.79 million SAAR in April.
That is down 3% from April 2016, and up 1.6% from last month.

Click on graph for larger image.
This graph shows the historical light vehicle sales from the BEA (blue) and an estimate for April (red, light vehicle sales of 16.79 million SAAR mostly from WardsAuto).
This was below the consensus forecast of 17.2 million for April.
After two consecutive years of record sales, it looks like sales will be down or move sideways in 2017.
 The second graph shows light vehicle sales since the BEA started keeping data in 1967.
Note: dashed line is current estimated sales rate.
Q1 2017 GDP Details on Residential and Commercial Real Estate
by Calculated Risk on 5/02/2017 01:14:00 PM
The BEA has released the underlying details for the Q1 advance GDP report.
The BEA reported that investment in non-residential structures increased at a 9.4% annual pace in Q1. This is a turnaround from early last year when non-residential investment declined due to less investment in petroleum exploration. Investment in petroleum and natural gas exploration increased substantially in Q1, from a $44.7 billion annual rate in Q4 2016 to a $70.6 billion annual rate in Q1 2017 - but is still down from a recent peak of $151 billion in Q4 2014 (down by more than one-half).
Excluding petroleum, non-residential investment in structures increased at a 10% annual rate in Q3.
 Click on graph for larger image.
The first graph shows investment in offices, malls and lodging as a percent of GDP. Office, mall and lodging investment has increased a little recently, but from a very low level.
Investment in offices increased in Q1, and is up 22% year-over-year - and is now almost as high as the housing bubble years as a percent of GDP.
Investment in multimerchandise shopping structures (malls) peaked in 2007 and was up year-over-year. The vacancy rate for malls is still very high, so investment will probably stay low for some time.
Lodging investment increased further in Q1. Lodging investment is up 15% year-over-year.
My guess is office and hotel investment growth will start to slow (office vacancies are still high, although hotel occupancy is near record levels). But investment growth is still very strong this year.
 The second graph is for Residential investment components as a percent of GDP. According to the Bureau of Economic Analysis, RI includes new single family structures, multifamily structures, home improvement, Brokers’ commissions and other ownership transfer costs, and a few minor categories (dormitories, manufactured homes).
Home improvement was the top category for five consecutive years following the housing bust ... but now investment in single family structures has been back on top for three years and will probably stay there for a long time.
However - even though investment in single family structures has increased from the bottom - single family investment is still very low, and still below the bottom for previous recessions as a percent of GDP. I expect further increases over the next few years.
Investment in single family structures was $257 billion (SAAR) (about 1.4% of GDP), and was up in Q1 compared to Q4.
Investment in home improvement was at a $238 billion Seasonally Adjusted Annual Rate (SAAR) in Q1 (about 1.3% of GDP). Home improvement growth has been solid.
CoreLogic: House Prices up 7.1% Year-over-year in March
by Calculated Risk on 5/02/2017 09:29:00 AM
Notes: This CoreLogic House Price Index report is for March. The recent Case-Shiller index release was for February. The CoreLogic HPI is a three month weighted average and is not seasonally adjusted (NSA).
From CoreLogic: CoreLogic US Home Price Report Shows Prices Up 7.1 Percent in March 2017
Home prices nationwide, including distressed sales, increased year over year by 7.1 percent in March 2017 compared with March 2016 and increased month over month by 1.6 percent in March 2017 compared with February 2017, according to the CoreLogic HPI.
...
“Home prices posted strong gains in March 2017, and the CoreLogic Home Price Index is only 2.8 percent from its 2006 peak,” said Dr. Frank Nothaft, chief economist for CoreLogic. “With a forecasted increase of almost 5 percent over the next 12 months, the index is expected to reach the previous peak during the second half of this year. Prices in more than half the country have already surpassed their previous peaks, and almost 20 percent of metropolitan areas are now at their price peaks. Nationally, price growth has gradually accelerated over the past half-year, while rent growth for single-family rental homes has slowly decelerated over the same period, according to the CoreLogic Single-family Rental Index, recording a 3 percent rise over the year through March.”
“A potent mix of strong job gains, household formation, population growth and still-attractive mortgage rates in the face of tight inventories are fueling a continuing surge in home prices across the U.S.,” said Frank Martell, president and CEO of CoreLogic. “Price gains were broad-based with 90 percent of metropolitan areas posting year-over-year gains. Major metropolitan areas were especially hot with CoreLogic data indicating that four of the largest 10 markets are now overvalued. Geographically, gains were strongest in the West with Washington showing the highest appreciation at almost 13 percent, and Seattle, Tacoma and Bellingham posting gains of 13 to 14 percent.
emphasis added
 Click on graph for larger image.
 This graph shows the national CoreLogic HPI data since 1976. January 2000 = 100.
The index was up 1.6% in March (NSA), and is up 7.1% over the last year.
This index is not seasonally adjusted, and this was another strong month-to-month increase.
The index is still 2.8% below the bubble peak in nominal terms (not inflation adjusted).
 The second graph shows the YoY change in nominal terms (not adjusted for inflation).
The YoY increase had been moving sideways over the last two years, but might have picked up recently (the recent pickup could be revised away).
The year-over-year comparison has been positive for five consecutive years since turning positive year-over-year in February 2012.
Monday, May 01, 2017
Tuesday: Auto Sales
by Calculated Risk on 5/01/2017 06:44:00 PM
From Matthew Graham at Mortgage News Daily: Mortgage Rates Unchanged to Slightly Higher
Mortgage rates were unchanged to slightly higher today, keeping them in line with the previous 4 business days. This 5-day block stands out from the previous trend that had taken rates generally lower since the middle of March, ultimately hitting the best levels of the year on April 18th. At the time, a majority of lenders were quoting conventional 30yr fixed rates of 4.00% on top tier scenarios.Tuesday:
While there are still several lenders at 4.0%, most have moved up to 4.125%. Most borrowers will be quoted the same NOTE rate today and Friday, but with higher upfront costs (thus making for a higher EFFECTIVE rate).
emphasis added
• All day: Light vehicle sales for April. The consensus is for light vehicle sales to increase to 17.2 million SAAR in April, from 16.6 million in March (Seasonally Adjusted Annual Rate).


