 RSS Feed
 by Calculated Risk on 4/13/2017 04:16:00 PM
Thursday, April 13, 2017
OIl: Solid increase for Oil Rig Count
A few comments from Steven Kopits of Princeton Energy Advisors LLC on Apr 13, 2017:
• Total US oil rigs were up 11 to 673
• US horizontal oil rigs added 11 to 572
...
• The US horizontal oil rig count is now within three weeks of the entire number necessary to cover the US contribution to incremental global oil supply.
• US supply is blowing right through earlier production gain forecasts, up by 600 kbpd over the last half year
 Click on graph for larger image.
Graph and comments Courtesy of Steven Kopits of Princeton Energy Advisors LLC.
LA area Port Traffic increased in March
by Calculated Risk on 4/13/2017 12:28:00 PM
Container traffic gives us an idea about the volume of goods being exported and imported - and usually some hints about the trade report since LA area ports handle about 40% of the nation's container port traffic.
The following graphs are for inbound and outbound traffic at the ports of Los Angeles and Long Beach in TEUs (TEUs: 20-foot equivalent units or 20-foot-long cargo container).
To remove the strong seasonal component for inbound traffic, the first graph shows the rolling 12 month average.
 Click on graph for larger image.
On a rolling 12 month basis, inbound traffic was up 1.6% compared to the rolling 12 months ending in February. Outbound traffic was up 0.8% compared to 12 months ending in February.
The downturn in exports in 2015 was probably due to the slowdown in China and the stronger dollar. Now exports are picking up again,
The 2nd graph is the monthly data (with a strong seasonal pattern for imports).
 Usually imports peak in the July to October period as retailers import goods for the Christmas holiday, and then decline sharply and bottom in February or March depending on the timing of the Chinese New Year.
The Chinese New Year was early this year, so imports declined in February and rebounded in March
In general both exports and imports have been increasing.
Sacramento Housing in March: Sales down 2%, Active Inventory down 23% YoY
by Calculated Risk on 4/13/2017 10:29:00 AM
During the recession, I started following the Sacramento market to look for changes in the mix of houses sold (equity, REOs, and short sales). For several years, not much changed. But in 2012 and 2013, we saw some significant changes with a dramatic shift from distressed sales to more normal equity sales.
This data suggests healing in the Sacramento market and other distressed markets are showing similar improvement. Note: The Sacramento Association of REALTORS® started breaking out REOs in May 2008, and short sales in June 2009.
In March, total sales were down 2.3% from March 2016, and conventional equity sales were up 1.4% compared to the same month last year.
In March, 5.5% of all resales were distressed sales. This was down from 5.9% last month, and down from 10.1% in March 2016.
The percentage of REOs was at 3.2%, and the percentage of short sales was 2.3%.
Here are the statistics.
 Click on graph for larger image.
This graph shows the percent of REO sales, short sales and conventional sales.
There has been a sharp increase in conventional (equity) sales that started in 2012 (blue) as the percentage of distressed sales declined sharply.
Active Listing Inventory for single family homes decreased 22.7% year-over-year (YoY) in March. This was the 23rd consecutive monthly YoY decrease in inventory in Sacramento.
Cash buyers accounted for 15.2% of all sales - this has been generally declining (frequently investors).
Summary: This data suggests a normal market with few distressed sales, and less investor buying - but with limited inventory.
Weekly Initial Unemployment Claims decrease to 234,000
by Calculated Risk on 4/13/2017 08:59:00 AM
The DOL reported:
In the week ending April 8, the advance figure for seasonally adjusted initial claims was 234,000, a decrease of 1,000 from the previous week's revised level. The previous week's level was revised up by 1,000 from 234,000 to 235,000. The 4-week moving average was 247,250, a decrease of 3,000 from the previous week's revised average. The previous week's average was revised up by 250 from 250,000 to 250,250.The previous week was revised up.
emphasis added
The following graph shows the 4-week moving average of weekly claims since 1971.
 Click on graph for larger image.
The dashed line on the graph is the current 4-week average. The four-week average of weekly unemployment claims decreased to 247,250.
This was below the consensus forecast.
The low level of claims suggests relatively few layoffs.
Wednesday, April 12, 2017
Thursday: PPI, Unemployment Claims, Consumer Sentiment
by Calculated Risk on 4/12/2017 09:14:00 PM
From Matthew Graham at Mortgage News Daily: Rates Move Deeper Into 2017 Lows After Trump Comments
Mortgage rates continued lower today, bringing them even deeper into new lows for 2017. Bond markets (which underlie rate movement) were already doing just fine this morning, but got a boost from Trump's comments on the strength of the US Dollar in the afternoon. Specifically, Trump said the dollar is "too strong." The implication is that the administration will do what it can to promote a weaker dollar, and such efforts are seen simultaneously putting downward pressure on rates.Thursday:
Whereas lenders were more evenly split between 4.0% and 4.125% yesterday, the former now enjoys a small majority. That means that 4.0% is now the most prevalently-quoted conventional 30yr fixed rate for top tier scenarios and that some of the more aggressive lenders are quoting 3.875%.
emphasis added
• At 8:30 AM ET, The initial weekly unemployment claims report will be released. The consensus is for 243 thousand initial claims, up from 234 thousand the previous week.
• Also at 8:30 AM, The Producer Price Index for March from the BLS. The consensus is for no change in PPI, and a 0.2% increase in core PPI.
• At 10:00 AM, University of Michigan's Consumer sentiment index (preliminary for April). The consensus is for a reading of 97.0, up from 96.9 in March.
Mortgage Rates below 4% Again?
by Calculated Risk on 4/12/2017 03:55:00 PM
With the ten year yield falling slightly today to under 2.3%, how much would the ten year need to rally to have mortgage rates fall under 4% again?
With the ten year at 2.29% today, and based on an historical relationship, 30-year rates should currently be around 4.2%.
As of this morning, Mortgage News Daily reports that 30 year fixed rate mortgages are around 4.1%. Pretty close to expected.
The graph shows the relationship between the monthly 10 year Treasury Yield and 30 year mortgage rates from the Freddie Mac survey.
 Currently the 10 year Treasury yield is at 2.29%, and 30 year mortgage rates were at 4.1% according to the Freddie Mac survey last week.
Based on the historical relationship, the ten year yield would have to fall to around 2.1% for 30 year fixed mortgage rates to be at or below 4%.
Q1 Review: Ten Economic Questions for 2017
by Calculated Risk on 4/12/2017 12:09:00 PM
At the end of last year, I posted Ten Economic Questions for 2017. I followed up with a brief post on each question. The goal was to provide an overview of what I expected in 2017 (I don't have a crystal ball, but I think it helps to outline what I think will happen - and understand - and change my mind, when the outlook is wrong).
By request, here is a quick Q1 review (it is very early in the year). I've linked to my posts from the beginning of the year, with a brief excerpt and a few comments:
10) Question #10 for 2017: Will housing inventory increase or decrease in 2017?
I was wrong on inventory last year, but right now my guess is active inventory will increase in 2017 (inventory will decline seasonally in December and January, but I expect to see inventory up again year-over-year in December 2017). My reasons for expecting more inventory are 1) inventory is historically low (lowest for November since 2000), 2) and the recent increase in interest rates.According to the February NAR report on existing home sales, inventory was down 6.4% year-over-year in February, and the months-of-supply was at 3.8 months. This was a smaller year-over-year decline than in January, and I still expect inventory to be up slightly by year end.
9) Question #9 for 2017: What will happen with house prices in 2017?
Inventories will probably remain low in 2017, although I expect inventories to increase on a year-over-year basis by December of 2017. Low inventories, and a decent economy suggests further price increases in 2017.If is very early, but the CoreLogic data released last week showed prices up 7.0% year-over-year in February. The CoreLogic year-over-year increase is higher than last year so far.
Perhaps higher mortgage rates will slow price appreciation. If we look back at the "taper tantrum" in 2013, price appreciation slowed somewhat over the next year - but that was from a high level. In June 2013, the Case-Shiller National index was up 9.3% year-over-year. By June 2014, the index was up 6.3% year-over-year.
If inventory increases year-over-year as I expect by December 2017, it seems likely that price appreciation will slow to the low-to-mid single digits.
8) Question #8 for 2017: How much will Residential Investment increase?
Most analysts are looking for starts to increase to around 1.25 million in 2017, and for new home sales of around 600 to 650 thousand. This would be an increase of around 7% for starts and maybe 10% for new home sales.Through February, starts were up 7.5% year-over-year compared to the same period in 2016. New home sales were up 7.1% year-over-year (more difficult comparison).
I think there will be further growth in 2017, but I think a combination of higher mortgage rates, less multi-family starts, and not enough lots for low-to-mid range new homes will mean sluggish growth in 2017.
My guess is starts will increase to just over 1.2 million in 2017 and new home sales will be in the low 600 thousand range.
7) Question #7 for 2017: How much will wages increase in 2017?
As the labor market continues to tighten, we should see more wage pressure as companies have to compete for employees. I expect to see some further increases in both the Average hourly earning from the CES, and in the Altanta Fed Wage Tracker. Perhaps nominal wages will increase more than 3% in 2017 according to the CES.Through March 2017, nominal hourly wages were up 2.7% year-over-year. This is a pickup from last year, and so far it appears wages will increase at a faster rate in 2017.
6) Question #6 for 2017: Will the Fed raise rates in 2017, and if so, by how much?
Analysts are being cautious on forecasting rate hikes, probably because they forecasted too many hikes over the last few years. However, as the economy approaches full employment, and with the possibility of fiscal stimulus in 2017, it is possible that inflation will pick up a little - and, if so, the Fed could hike more than expected.The Fed has already hiked once in 2017, and they are still forecasting three hikes this year (and to slow reinvesting by the end of the year).
My current guess is the Fed will hike twice in 2017.
5) Question #5 for 2017: Will the core inflation rate rise in 2017? Will too much inflation be a concern in 2017?
The Fed is projecting core PCE inflation will increase to 1.8% to 1.9% by Q4 2017. However there are risks for higher inflation. The labor market is approaching full employment, and the new administration is proposing some fiscal stimulus (tax cuts, possible infrastructure spending), so it is possible - as a result - that inflation will increase more than expected in 2017 and 2018.It is early, but inflation has moved up close to the Fed target through February.
Currently I think PCE core inflation (year-over-year) will increase further and be close to 2% in 2017, but too much inflation will still not be a serious concern in 2017.
4) Question #4 for 2017: What will the unemployment rate be in December 2017?
Depending on the estimate for the participation rate and job growth (next question), it appears the unemployment rate will declining slightly by December 2017 from the current 4.7%.The unemployment rate decline to 4.5% in March - about the level I expected for the end of 2017.
3) Question #3 for 2017: Will job creation slow further in 2017?
So my forecast is for gains of 125,000 to 150,000 payroll jobs per month in 2017. Lower than in 2016, but another solid year for employment gains given current demographics.Through March 2017, the economy has added 533,000 thousand jobs, or 178,000 per month, down from 187,000 per month in 2016. I still expect employment gains to slow this year.
2) Question #2 for 2017: How much will the economy grow in 2017?
There will probably be some economic boost from oil sector investment in 2017 since oil prices have increased (this was a drag last year).Once again, GDP will be sluggish in Q1 - and it is way too early to tell if there will be any pickup in GDP growth this year.
The housing recovery is ongoing, however auto sales might have peaked.
And demographics are improving (the prime working age population is growing about 0.5% per year, compared to declining a few years ago).
All these factors combined will probably push GDP growth into the mid-to-high 2% range in 2017, but this will depend somewhat on which policies are enacted.
1) Question #1 for 2017: What about fiscal and regulatory policy in 2017?
We are still waiting for the details. As far as the impact on 2017, my expectation is there will be both individual and corporate tax cuts - and some sort of infrastructure program. I expect that something will happen with the ACA (those that have insurance for 2017 will keep their insurance, but they might not have insurance in 2018 - and that impact would be in 2018). I think the negative proposals (immigration, trade) will impact the economy in 2018 or later - overall there will be a small boost to GDP in 2017.So far nothing has happened with the ACA, taxes, infrastructure, or trade. Policy remains a wild card.
A final comment: The words of a President matter. Mr Trump has been impulsive, reckless and irresponsible with his comments, and that has continued since the election. One absurd comment could send the markets into a tailspin and negatively impact the economy (and that could happen at any time).
It is very early in the year. Currently it looks like 2017 is unfolding somewhat as expected - although I'd revise up my forecast for FOMC rate hikes from 2 to 3.
MBA: Mortgage Applications Increase in Latest Weekly Survey
by Calculated Risk on 4/12/2017 07:00:00 AM
From the MBA: Mortgage Applications Increase in Latest MBA Weekly Survey
Mortgage applications increased 1.5 percent from one week earlier, according to data from the Mortgage Bankers Association’s (MBA) Weekly Mortgage Applications Survey for the week ending April 7, 2017.
... The Refinance Index remained unchanged from the previous week. The seasonally adjusted Purchase Index increased 3 percent from one week earlier. The unadjusted Purchase Index increased 5 percent compared with the previous week and was 3 percent higher than the same week one year ago.
...
The average contract interest rate for 30-year fixed-rate mortgages with conforming loan balances ($424,100 or less) decreased to 4.28 percent from 4.34 percent, with points increasing to 0.38 from 0.31 (including the origination fee) for 80 percent loan-to-value ratio (LTV) loans.
emphasis added
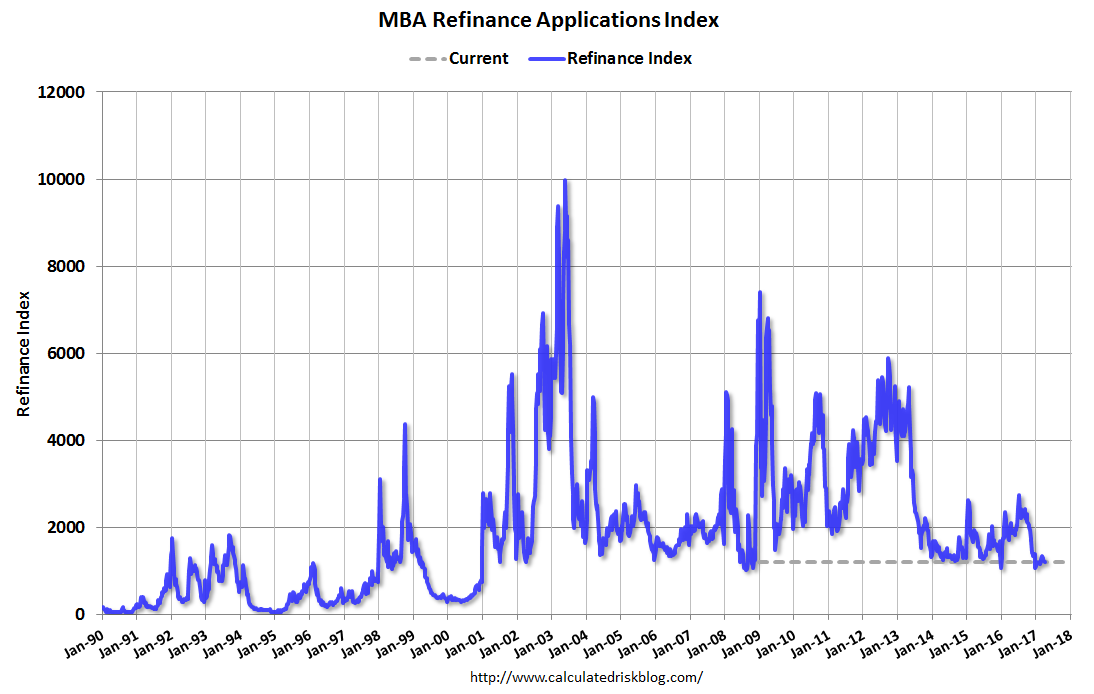 Click on graph for larger image.
The first graph shows the refinance index since 1990.
Refinance activity remains low - and will not increase significantly unless rates fall sharply.
 The second graph shows the MBA mortgage purchase index.
 Even with the increase in mortgage rates late last year, purchase activity is still up.
However refinance activity has declined significantly since rates increased.
Tuesday, April 11, 2017
"Mortgage Rates Hit New 2017 Lows"
by Calculated Risk on 4/11/2017 10:19:00 PM
From Matthew Graham at Mortgage News Daily: Mortgage Rates Hit New 2017 Lows
Mortgage rates moved lower today--significantly in some cases--with the average lender making it back to 2017's lows for the first time since January. Rates came close to 2017's lows in late February and again last week before officially crossing the line today.Here is a table from Mortgage News Daily:
...
Lenders are now fairly evenly split between 4.0% and 4.125% in terms of the most prevalent conventional 30yr fixed quote on top tier scenarios. A few of the most aggressive lenders are now quoting rates in the high 3's (emphasis on "few"), and there are still more than a few lenders up at 4.25%.
emphasis added
Update: Predicting the Next Recession
by Calculated Risk on 4/11/2017 03:45:00 PM
CR April 2017 Update: In 2013, I wrote a post "Predicting the Next Recession". I repeated the post in January 2015 (and in the summer of 2015, early last year and in August 2016) because of all the recession calls. In late 2015, the recession callers were out in force - arguing the problems in China, combined with the impact on oil producers of lower oil prices (and defaults by energy companies) - would lead to a global recession and drag the US into recession. I didn't think so - and I was correct.
I've added a few updates in italics by year. Most of the text is from January 2013.
A few thoughts on the "next recession" ... Forecasters generally have a terrible record at predicting recessions. There are many reasons for this poor performance. In 1987, economist Victor Zarnowitz wrote in "The Record and Improvability of Economic Forecasting" that there was too much reliance on trends, and he also noted that predictive failure was also due to forecasters' incentives. Zarnowitz wrote: "predicting a general downturn is always unpopular and predicting it prematurely—ahead of others—may prove quite costly to the forecaster and his customers".
Incentives motivate Wall Street economic forecasters to always be optimistic about the future (just like stock analysts). Of course, for the media and bloggers, there is an incentive to always be bearish, because bad news drives traffic (hence the prevalence of yellow journalism).
In addition to paying attention to incentives, we also have to be careful not to rely "heavily on the persistence of trends". One of the reasons I focus on residential investment (especially housing starts and new home sales) is residential investment is very cyclical and is frequently the best leading indicator for the economy. UCLA's Ed Leamer went so far as to argue that: "Housing IS the Business Cycle". Usually residential investment leads the economy both into and out of recessions. The most recent recovery was an exception, but it was fairly easy to predict a sluggish recovery without a contribution from housing.
Since I started this blog in January 2005, I've been pretty lucky on calling the business cycle. I argued no recession in 2005 and 2006, then at the beginning of 2007 I predicted a recession would start that year (made it by one month with the Great Recession starting in December 2007). And in 2009, I argued the economy had bottomed and we'd see sluggish growth.
Finally, over the last 18 months, a number of forecasters (mostly online) have argued a recession was imminent. I responded that I wasn't even on "recession watch", primarily because I thought residential investment was bottoming.
[CR 2015 Update: this was written two years ago - I'm not sure if those calling for a recession then have acknowledged their incorrect forecasts and / or changed theirs views (like ECRI and various bloggers). Clearly they were wrong.]
[CR April 2017 Update: Now it has been over four years! And yes, ECRI has admitted their recession calls were incorrect. Not sure about the rest of the recession callers.]
Now one of my blogging goals is to see if I can get lucky again and call the next recession correctly. Right now I'm pretty optimistic (see: The Future's so Bright ...) and I expect a pickup in growth over the next few years (2013 will be sluggish with all the austerity).
The next recession will probably be caused by one of the following (from least likely to most likely):
3) An exogenous event such as a pandemic, significant military conflict, disruption of energy supplies for any reason, a major natural disaster (meteor strike, super volcano, etc), and a number of other low probability reasons. All of these events are possible, but they are unpredictable, and the probabilities are low that they will happen in the next few years or even decades.
[CR 2016 Update: The recent recession calls are mostly based on exogenous events: the problems in China and in commodity based economies (especially oil based). There will be some spillover to the US such as fewer exports (and an impact on oil producing regions in the US), but unless there is a related financial crisis, I think the spillover will be insufficient to cause a recession in the US.]
2) Significant policy error. This might involve premature or too rapid fiscal or monetary tightening (like the US in 1937 or eurozone in 2012). Two examples: not reaching a fiscal agreement and going off the "fiscal cliff" probably would have led to a recession, and Congress refusing to "pay the bills" would have been a policy error that would have taken the economy into recession. Both are off the table now, but there remains some risk of future policy errors.
Note: Usually the optimal path for reducing the deficit means avoiding a recession since a recession pushes up the deficit as revenues decline and automatic spending (unemployment insurance, etc) increases. So usually one of the goals for fiscal policymakers is to avoid taking the economy into recession. Too much austerity too quickly is self defeating.
[CR 2017 Update: Austerity was a mistake (obvious at the time). And it is possible that we will see serious policy mistakes from the new administration (a complete wildcard). And it is possible the Fed could tighten too quickly. ]
1) Most of the post-WWII recessions were caused by the Fed tightening monetary policy to slow inflation. I think this is the most likely cause of the next recession. Usually, when inflation starts to become a concern, the Fed tries to engineer a "soft landing", and frequently the result is a recession. Since inflation is not an immediate concern, the Fed will probably stay accommodative for a few more years.
So right now I expect further growth for the next few years (all the austerity in 2013 concerns me, especially over the next couple of quarters as people adjust to higher payroll taxes, but I think we will avoid contraction). [CR 2015 Update: We avoided contraction in 2013!] I think the most likely cause of the next recession will be Fed tightening to combat inflation sometime in the future - and residential investment (housing starts, new home sales) will probably turn down well in advance of the recession. In other words, I expect the next recession to be a more normal economic downturn - and I don't expect a recession for a few years.
[CR April 2017 Update: This was written in 2013 - and my prediction for no "recession for a few years" was correct. This still seems correct today, so no recession in the immediate future (not in 2017). ]


