 RSS Feed
 by Calculated Risk on 4/07/2017 05:58:00 PM
Friday, April 07, 2017
AAR: Rail Traffic increased in March
From the Association of American Railroads (AAR) Rail Time Indicators. Graphs and excerpts reprinted with permission.
Total carloads on U.S. railroads in March 2017 were up 7.3% (87,183 carloads) over March 2016; excluding coal, carloads in March were up 2.7% (23,337 carloads). Intermodal containers and trailers were up 3.8% (47,180 units) for the month. Year-to-date total carloads through March were up 5.7% (180,665 carloads), while year-to-date intermodal volume was up 1.4% (47,977 units) over last year.
 Click on graph for larger image.
This graph from the Rail Time Indicators report shows U.S. average weekly rail carloads (NSA). Dark blue is 2017.
Rail carloads have been weak over the last decade due to the decline in coal shipments.
U.S. railroads originated 1,283,489 total carloads in March 2017, up 87,183 carloads (7.3%) over March 2016. It’s the fifth straight year-over-year carload increase (see the chart below right) and the biggest percentage carload increase in those five months. Total carloads averaged 256,698 per week in March 2017, much better than the 239,261 weekly average in March 2016 but otherwise the lowest weekly average for March since our data begin in 1988. The best March ever was 2006, when carloads averaged 337,465 per week — 31.5% higher than in March 2017. Note that Easter Sunday and the preceding week are included in March 2016 numbers, but will be included in April 2017 numbers. For the first three months of 2017, total U.S. carloads were 3,324,102, up 5.7% (180,665 carloads) over the first three months of 2016 but otherwise the lowest January-March total since sometime prior to 1988 ...
 The second graph is for intermodal traffic (using intermodal or shipping containers):
U.S. railroads originated 1,298,173 intermodal containers and trailers in March 2017, up 3.8% (47,180 units) over March 2016. Average weekly volume of 259,635 containers and trailers was the second highest for March ever (behind 2015).
Public and Private Sector Payroll Jobs: Carter, Reagan, Bush, Clinton, Bush, Obama, Trump
by Calculated Risk on 4/07/2017 01:53:00 PM
Here is another update of tracking employment during Presidential terms. We frequently use Presidential terms as time markers - we could use Speaker of the House, or any other marker.
NOTE: Several readers have asked if I could add a lag to these graphs (obviously a new President has zero impact on employment for the month they are elected). But that would open a debate on the proper length of the lag, so I'll just stick to the beginning of each term.
Important: There are many differences between these periods. Overall employment was smaller in the '80s, however the participation rate was increasing in the '80s (younger population and women joining the labor force), and the participation rate is generally declining now. But these graphs give an overview of employment changes.
The first graph shows the change in private sector payroll jobs from when each president took office until the end of their term(s). Presidents Carter and George H.W. Bush only served one term, and President Obama is in the final months of his second term.
Mr. G.W. Bush (red) took office following the bursting of the stock market bubble, and left during the bursting of the housing bubble. Mr. Obama (blue) took office during the financial crisis and great recession. There was also a significant recession in the early '80s right after Mr. Reagan (yellow) took office.
There was a recession towards the end of President G.H.W. Bush (purple) term, and Mr Clinton (light blue) served for eight years without a recession.
 Click on graph for larger image.
The first graph is for private employment only.
Mr. Trump is in Orange (just two months).
The employment recovery during Mr. G.W. Bush's (red) first term was sluggish, and private employment was down 811,000 jobs at the end of his first term. At the end of Mr. Bush's second term, private employment was collapsing, and there were net 396,000 private sector jobs lost during Mr. Bush's two terms.
Private sector employment increased slightly under President G.H.W. Bush (purple), with 1,510,000 private sector jobs added.
Private sector employment increased by 20,966,000 under President Clinton (light blue), by 14,717,000 under President Reagan (yellow), and 9,041,000 under President Carter (dashed green).
There were only 1,937,000 more private sector jobs at the end of Mr. Obama's first term. At the end of his second term, there were 11,756,000 more private sector jobs than when Mr. Obama initially took office.
During the first two months of Mr. Trump's term, the economy has added 310,000 private sector jobs.
 A big difference between the presidencies has been public sector employment. Note the bumps in public sector employment due to the decennial Census in 1980, 1990, 2000, and 2010.
The public sector grew during Mr. Carter's term (up 1,304,000), during Mr. Reagan's terms (up 1,414,000), during Mr. G.H.W. Bush's term (up 1,127,000), during Mr. Clinton's terms (up 1,934,000), and during Mr. G.W. Bush's terms (up 1,744,000 jobs).
However the public sector declined significantly while Mr. Obama was in office (down 268,000 jobs).
During the first two months of Mr. Trump's term, the economy has added 7,000 public sector jobs.
 The third graph shows the progress towards the Trump goal of adding 10 million jobs over the next 4 years.
After two months, the economy has added 317,000 jobs, about 100,000 behind the goal.
Comment: A Mostly Solid Employment Report
by Calculated Risk on 4/07/2017 09:55:00 AM
The headline jobs number was below expectations, and there were combined downward revisions to the previous two months. However the weakness in the headline jobs number can be blamed on the weather (both payback from a warm February, and storms during the reference week in March).
Note: The weather impact was no surprise (I took the under in my employment preview).
There was plenty of good news - especially with the unemployment rate falling to 4.5% (with the participation rate steady), and wages picking up. Overall this was mostly a solid report.
Earlier: March Employment Report: 98,000 Jobs, 4.5% Unemployment Rate
In March, the year-over-year change was 2.13 million jobs. Decent job growth.
Average Hourly Earnings
 Click on graph for larger image.
This graph is based on “Average Hourly Earnings” from the Current Employment Statistics (CES) (aka "Establishment") monthly employment report. Note: There are also two quarterly sources for earnings data: 1) “Hourly Compensation,” from the BLS’s Productivity and Costs; and 2) the Employment Cost Index which includes wage/salary and benefit compensation.
The graph shows the nominal year-over-year change in "Average Hourly Earnings" for all private employees. Nominal wage growth was at 2.7% YoY in March.
Wage growth is trending up.
Employment-Population Ratio, 25 to 54 years old
 Since the overall participation rate has declined recently due to cyclical (recession) and demographic (aging population, younger people staying in school) reasons, here is the employment-population ratio for the key working age group: 25 to 54 years old.
In the earlier period the participation rate for this group was trending up as women joined the labor force. Since the early '90s, the participation rate moved more sideways, with a downward drift starting around '00 - and with ups and downs related to the business cycle.
The 25 to 54 participation rate was unchanged in March at 81.7%, and the 25 to 54 employment population ratio increase to 78.5%.
The participation rate has been trending down for this group since the late '90s, however, with more younger workers (and fewer older workers), the participation rate might move up some more.
Part Time for Economic Reasons
 From the BLS report:
The number of persons employed part time for economic reasons (sometimes referred to as involuntary part-time workers), at 5.6 million, was little changed in March but was down by 567,000 over the year. These individuals, who would have preferred full-time employment, were working part time because their hours had been cut back or because they were unable to find full-time jobs.The number of persons working part time for economic reasons decreased in March. The number working part time for economic reasons suggests a little slack still in the labor market. This is the lowest level since May 2008.
These workers are included in the alternate measure of labor underutilization (U-6) that decreased to 8.9% in March. This is the lowest level for U-6 since December 2007.
Unemployed over 26 Weeks
 This graph shows the number of workers unemployed for 27 weeks or more.
 According to the BLS, there are 1.69 million workers who have been unemployed for more than 26 weeks and still want a job. This was down from 1.80 million in February.
This was the lowest number since 2008.
This is generally trending down, but still somewhat elevated.
Overall this was mostly a solid report.
March Employment Report: 98,000 Jobs, 4.5% Unemployment Rate
by Calculated Risk on 4/07/2017 08:43:00 AM
From the BLS:
The unemployment rate declined to 4.5 percent in March, and total nonfarm payroll employment edged up by 98,000, the U.S. Bureau of Labor Statistics reported today. Employment increased in professional and business services and in mining, while retail trade lost jobs.
...
The change in total nonfarm payroll employment for January was revised down from +238,000 to +216,000, and the change for February was revised down from +235,000 to +219,000. With these revisions, employment gains in January and February combined were 38,000 less than previously reported.
...
In March, average hourly earnings for all employees on private nonfarm payrolls increased by 5 cents to $26.14, following a 7-cent increase in February. Over the year, average hourly earnings have risen by 68 cents, or 2.7 percent.
emphasis added
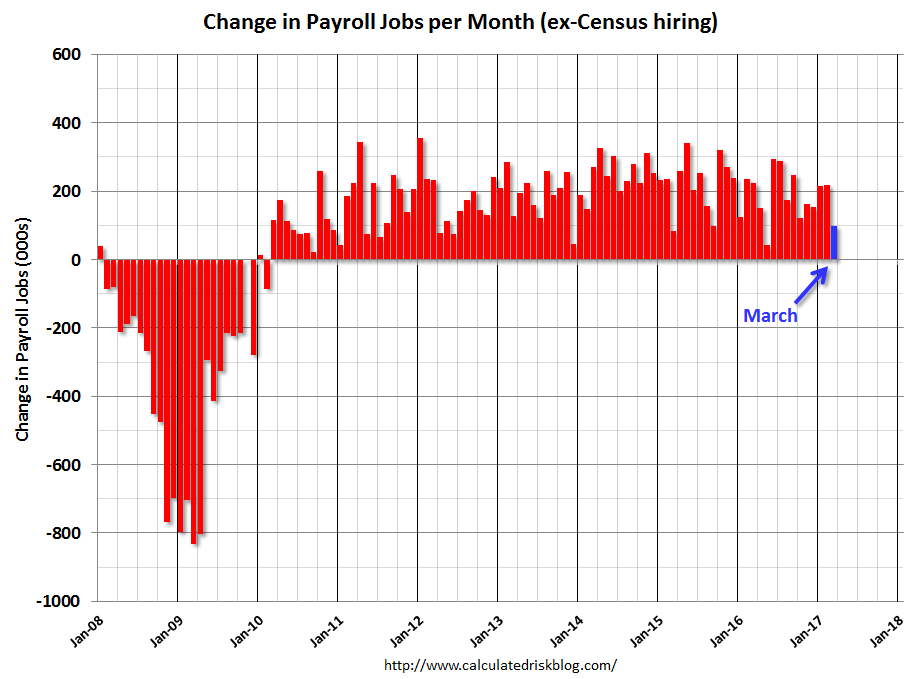 Click on graph for larger image.
The first graph shows the monthly change in payroll jobs, ex-Census (meaning the impact of the decennial Census temporary hires and layoffs is removed - mostly in 2010 - to show the underlying payroll changes).
Total payrolls increased by 98 thousand in March (private payrolls increased 89 thousand).
Payrolls for January and February were revised down by a combined 38 thousand.
 This graph shows the year-over-year change in total non-farm employment since 1968.
In March, the year-over-year change was 2.13 million jobs. This is a decent year-over-year gain.
The third graph shows the employment population ratio and the participation rate.
 The Labor Force Participation Rate was unchanged in March at 63.0%. This is the percentage of the working age population in the labor force. A large portion of the recent decline in the participation rate is due to demographics.
 The Employment-Population ratio increased to 60.1% (black line).
I'll post the 25 to 54 age group employment-population ratio graph later.
 The fourth graph shows the unemployment rate.
 The unemployment rate decreased in February to 4.5%.
This was well below expectations of 178,000 jobs, and the previous two months were revised down.
I'll have much more later ...
Thursday, April 06, 2017
Friday: Jobs and Wages
by Calculated Risk on 4/06/2017 08:09:00 PM
Earlier:, my March Employment Preview: Mixed Signals and Goldman: March Employment Preview
Friday:
• At 8:30 AM ET, Employment Report for March. The consensus is for an increase of 178,000 non-farm payroll jobs added in March, down from the 235,000 non-farm payroll jobs added in February. The consensus is for the unemployment rate to be unchanged at 4.7%.
• At 10:00 AM, Monthly Wholesale Trade: Sales and Inventories for February.
• At 3:00 PM, Consumer credit from the Federal Reserve. The consensus is for a $15.0 billion increase in credit.
Goldman: March Payrolls Preview
by Calculated Risk on 4/06/2017 02:51:00 PM
A few excerpts from a note by Goldman Sachs economist Spencer Hill:
We estimate nonfarm payrolls increased 170k in March, compared to consensus of +180k and February’s 235k increase. Our forecast reflects above-trend underlying job growth that is more than offset by a significant drag from unseasonable winter weather, which we believe may have boosted February payroll growth by 30-50k and could weigh on March growth by as much as 30-60k. We are not assuming a significant impact from the federal hiring freeze implemented in late January, which did not appear to materially affect the February report.CR Note: My employment preview is here.
...
We estimate that the unemployment remained stable at 4.7%, as upside risk from a potential pause in household employment growth is offset by some scope for a pullback in the participation rate, following its sharp year-to-date increase. We also estimate average hourly earnings increased 0.2% month over month and 2.7% year over year, reflecting tightening labor markets offset by slightly negative calendar effects.
March Employment Preview: Mixed Signals
by Calculated Risk on 4/06/2017 12:04:00 PM
On Friday at 8:30 AM ET, the BLS will release the employment report for March. The consensus, according to Bloomberg, is for an increase of 175,000 non-farm payroll jobs in March (with a range of estimates between 125,000 to 202,000), and for the unemployment rate to be unchanged at 4.7%.
The BLS reported 235,000 jobs added in February.
Here is a summary of recent data:
• The ADP employment report showed an increase of 263,000 private sector payroll jobs in March. This was well above expectations of 170,000 private sector payroll jobs added. The ADP report hasn't been very useful in predicting the BLS report for any one month, but in general, this suggests employment growth ABOVE expectations.
• The ISM manufacturing employment index increased in March to 58.9%. A historical correlation between the ISM manufacturing employment index and the BLS employment report for manufacturing, suggests that private sector BLS manufacturing payroll increased about 30,000 in March. The ADP report indicated 30,000 manufacturing jobs added in March.
The ISM non-manufacturing employment index decreased in March to 51.6%. A historical correlation between the ISM non-manufacturing employment index and the BLS employment report for non-manufacturing, suggests that private sector BLS non-manufacturing payroll jobs increased about 115,000 in March.
Combined, the ISM indexes suggests employment gains of about 145,000. This suggests employment growth BELOW expectations.
• Initial weekly unemployment claims averaged 250,000 in March, down from 234,000 in February. For the BLS reference week (includes the 12th of the month), initial claims were at 258,000, up from 244,000 during the reference week in February.
The increase during the reference suggests more layoffs during the reference week in March than in February. This suggests a somewhat weaker employment report in March than in February.
• The final March University of Michigan consumer sentiment index increased slightly to 96.9 from the February reading of 96.3. Sentiment is frequently coincident with changes in the labor market, but there are other factors too like gasoline prices and politics.
• Weather: There was probably some payback from the warmer than normal weather in February. According to research economist Francois Gourio at the Chicago Fed: "Our models predict a strong negative weather effect for March NFP - around 100K jobs less than with normal weather". This suggests a weaker than expected report.
• Conclusion: None of the indicators alone is very good at predicting the initial BLS employment report. The ADP report suggests another strong report, however the ISM surveys suggest weaker job growth. Weekly unemployment claims suggest weaker job growth, and the weather impact appears to be negative. I'll break with my recent "over" picks, and take the "under" for March.
Las Vegas Real Estate in March: Sales up 11.9% YoY, Inventory down Sharply
by Calculated Risk on 4/06/2017 10:25:00 AM
This is a key distressed market to follow since Las Vegas saw the largest price decline, following the housing bubble, of any of the Case-Shiller composite 20 cities.
The Greater Las Vegas Association of Realtors reported Raiders Aren’t Only Ones Moving to Las Vegas, Where Home Prices and Sales Are Rising, GLVAR Housing Statistics for March 2017
The recent trend of rising home prices and sales in Southern Nevada continued through March, according to a report released Friday by the Greater Las Vegas Association of REALTORS® (GLVAR).1) Overall sales were up 11.9% year-over-year.
...
... The total number of existing local homes, condos and townhomes sold in March was 3,903, up from 3,488 in March 2016. Compared to one year ago, sales were up 14.8 percent for homes and up 0.4 percent for condos and townhomes.
According to GLVAR, 2017 is ahead of the sales pace in 2016, when 41,720 total properties were sold in Southern Nevada. That was more than the 38,577 properties sold during 2015. It was also more than in 2014, but fewer than each year from 2009 through 2013.
...
By the end of March, GLVAR reported 5,488 single-family homes listed for sale without any sort of offer. That’s down 23.9 percent from one year ago. For condos and townhomes, the 715 properties listed without offers in March represented a 69.0 percent drop from one year ago.
For several years, GLVAR has been reporting fewer distressed sales and more traditional home sales, where lenders are not controlling the transaction. That trend continued in March, when 4.4 percent of all local sales were short sales – which occur when lenders allow borrowers to sell a home for less than what they owe on the mortgage. That’s down from 5.9 percent of all sales in March 2016. Another 5.4 percent of all March sales were bank-owned, down from 7.1 percent one year ago.
emphasis added
2) Active inventory (single-family and condos) is down sharply from a year ago (A very sharp decline in condo inventory).
3) Fewer distressed sales.
Weekly Initial Unemployment Claims decrease to 234,000
by Calculated Risk on 4/06/2017 08:48:00 AM
The DOL reported:
In the week ending April 1, the advance figure for seasonally adjusted initial claims was 234,000, a decrease of 25,000 from the previous week's revised level. The previous week's level was revised up by 1,000 from 258,000 to 259,000. The 4-week moving average was 250,000, a decrease of 4,500 from the previous week's revised average. The previous week's average was revised up by 250 from 254,250 to 254,500.The previous week was revised up.
emphasis added
The following graph shows the 4-week moving average of weekly claims since 1971.
 Click on graph for larger image.
The dashed line on the graph is the current 4-week average. The four-week average of weekly unemployment claims decreased to 250,000.
This was below the consensus forecast.
The low level of claims suggests relatively few layoffs.
Wednesday, April 05, 2017
FOMC Minutes: "A change to the Committee's reinvestment policy would likely be appropriate later this year"
by Calculated Risk on 4/05/2017 02:10:00 PM
From the Fed: Minutes of the Federal Open Market Committee, March 14 - 15, 2017. Excerpts:
Provided that the economy continued to perform about as expected, most participants anticipated that gradual increases in the federal funds rate would continue and judged that a change to the Committee's reinvestment policy would likely be appropriate later this year. Many participants emphasized that reducing the size of the balance sheet should be conducted in a passive and predictable manner. ...
...
When the time comes to implement a change to reinvestment policy, participants generally preferred to phase out or cease reinvestments of both Treasury securities and agency MBS. Policymakers also discussed the potential benefits and costs of approaches that would either phase out or cease all at once reinvestments of principal from these securities. An approach that phased out reinvestments was seen as reducing the risks of triggering financial market volatility or of potentially sending misleading signals about the Committee's policy intentions while only modestly slowing reductions in the Committee's securities holdings. An approach that ended reinvestments all at once, however, was generally viewed as easier to communicate while allowing for somewhat swifter normalization of the size of the balance sheet. To promote rapid normalization of the size and composition of the balance sheet, one participant preferred to set a minimum pace for reductions in MBS holdings and, if and when necessary, to sell MBS to maintain such a pace.
Nearly all participants agreed that the Committee's intentions regarding reinvestment policy should be communicated to the public well in advance of an actual change. It was noted that the Committee would continue its deliberations on reinvestment policy during upcoming meetings and would release additional information as it becomes available. In that context, several participants indicated that, when the Committee announces its plans for a change to its reinvestment policy, it would be desirable to also provide more information to the public about the Committee's expectations for the size and composition of the Federal Reserve's assets and liabilities in the longer run.
emphasis added


