 RSS Feed
 by Calculated Risk on 3/07/2017 11:05:00 AM
Tuesday, March 07, 2017
CoreLogic: House Prices up 6.9% Year-over-year in January
Notes: This CoreLogic House Price Index report is for January. The recent Case-Shiller index release was for December. The CoreLogic HPI is a three month weighted average and is not seasonally adjusted (NSA).
From CoreLogic: CoreLogic US Home Price Report Shows Prices Up 6.9 Percent in January 2017
Home prices nationwide, including distressed sales, increased year over year by 6.9 percent in January 2017 compared with January 2016 and increased month over month by 0.7 percent in January 2017 compared with December 2016, according to the CoreLogic HPI.
...
“With lean for-sale inventories and low rental vacancy rates, many markets have seen housing prices outpace inflation,” said Dr. Frank Nothaft, chief economist for CoreLogic. “Over the 12 months through January of this year, the CoreLogic Home Price Index recorded a 6.9 percent rise in home prices nationally and the CoreLogic Single-Family Rental Index was up 2.7 percent—both rising faster than inflation.”
emphasis added
 Click on graph for larger image.
 This graph shows the national CoreLogic HPI data since 1976. January 2000 = 100.
The index was up 0.7% in January (NSA), and is up 6.9% over the last year.
This index is not seasonally adjusted, and this was another solid month-to-month increase.
The index is still 4.0% below the bubble peak in nominal terms (not inflation adjusted).
 The second graph shows the YoY change in nominal terms (not adjusted for inflation).
The YoY increase had been moving sideways over the last two years, but might have picked up recently (the recent pickup could be revised away).
The year-over-year comparison has been positive for five consecutive years since turning positive year-over-year in February 2012.
Trade Deficit at $48.5 Billion in January
by Calculated Risk on 3/07/2017 08:47:00 AM
From the Department of Commerce reported:
The U.S. Census Bureau and the U.S. Bureau of Economic Analysis, through the Department of Commerce, announced today that the goods and services deficit was $48.5 billion in January, up $4.2 billion from $44.3 billion in December, revised. January exports were $192.1 billion, $1.1 billion more than December exports. January imports were $240.6 billion, $5.3 billion more than December imports.The trade deficit was at the consensus forecast.
The first graph shows the monthly U.S. exports and imports in dollars through January 2017.
 Click on graph for larger image.
Imports and exports increased in January.
Exports are 16% above the pre-recession peak and up 7% compared to January 2016; imports are 4% above the pre-recession peak, and up 8% compared to January 2016.
Clearly trade is picking up.
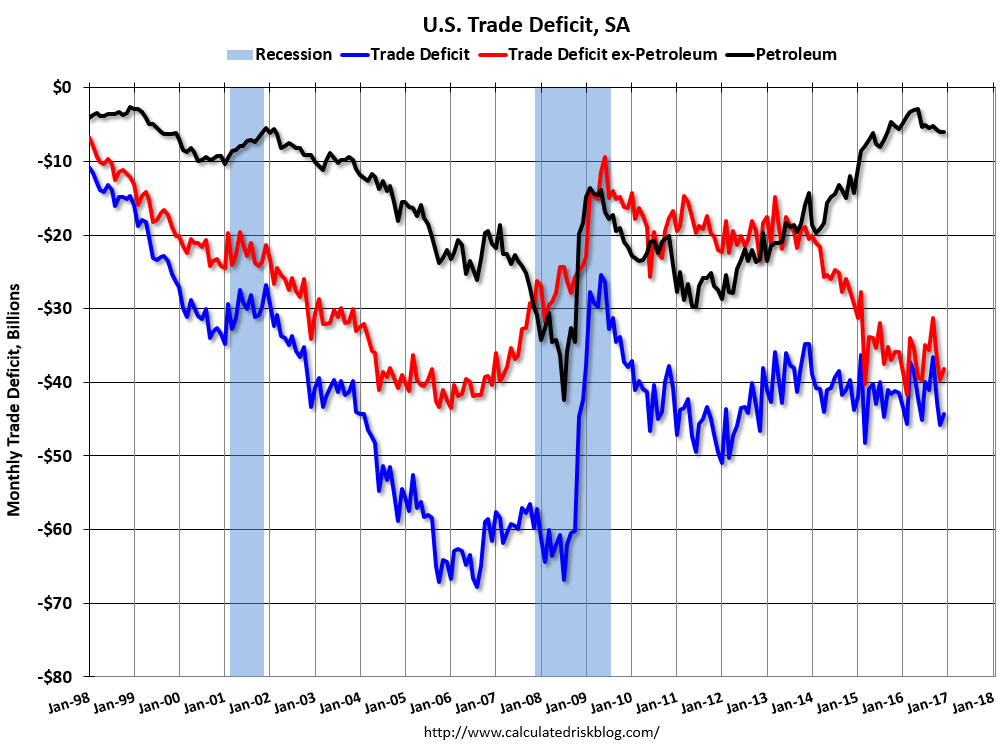
The second graph shows the U.S. trade deficit, with and without petroleum.
 The blue line is the total deficit, and the black line is the petroleum deficit, and the red line is the trade deficit ex-petroleum products.
Oil imports averaged $43.94 in January, up from $41.45 in December, and up from $32.06 in January 2016. The petroleum deficit has generally been declining and is the major reason the overall deficit has mostly moved sideways since early 2012.
The trade deficit with China increased to $31.3 billion in January, from $28.9 billion in January 2016. The increase this year was probably due to the timing of the Chinese New Year (the deficit will probably be smaller in February). In general the deficit with China has generally been declining.
Monday, March 06, 2017
Tuesday: Trade Deficit
by Calculated Risk on 3/06/2017 07:49:00 PM
From Matthew Graham at Mortgage News Daily: Mortgage Rate Losing Streak Pauses
After moving higher for 5 days in a row, mortgage rates finally moved a bit lower today [4.24% 30 year fixed on top tier]. The improvement was fairly small, however, merely undoing Friday's modest move higher.Tuesday:
It would take something very compelling to push rates significantly lower between now and next Wednesday's Fed announcement. This could come in the form of shockingly bad employment numbers on Friday or massive geopolitical drama, but until it happens, it's safer to remain defensive with respect to locking and floating. Inclined floaters should understand there's not a huge payout if rates manage to improve this week.
emphasis added
• At 8:30 AM ET, Trade Balance report for January from the Census Bureau. The consensus is for the U.S. trade deficit to be at $48.5 billion in January from $44.3 billion in December.
• At 3:00 PM, Consumer credit from the Federal Reserve. The consensus is for a $18.3 billion increase in credit.
February NFP Forecasts
by Calculated Risk on 3/06/2017 01:35:00 PM
A couple of NFP forecasts ...
From Nomura:
Incoming data on the labor market suggest strong job gains in February. Data on sentiment, including the Empire State, Philly Fed and ISM manufacturing surveys, point to better hiring activity in February. Initial and continuing claims data continued to trend lower, implying that involuntary layoffs remain low and that firms are eager to retain workers. In particular, the 4-week moving average of initial jobless claims inched down further, reaching its lowest point in decades. Based on these positive readings, we forecast private nonfarm payrolls to have added 215k jobs in February. Given the recent employment trend in the public sector, we expect public sector payrolls to remain unchanged. ...From Merrill Lynch:
Moreover, we forecast the unemployment rate to inch down slightly to 4.7% in February ... we expect average hourly earnings to have increased by 0.3% m-o-m (2.7% y-o-y) ...
emphasis added
We expect nonfarm payrolls to grow by 185,000 in February ... Given the recent bump up in optimism in manufacturing surveys, we could see better job growth in the industrial sector. Moreover, weather conditions have been broadly favorable for construction activity in February as temperatures have been warmer than normal. This could lead to another month of strong payroll gains in the construction sector. We expect limited gains in government payrolls.
We are forecasting the unemployment rate to tick down to 4.7% from 4.8% ... We are forecasting a solid rebound of 0.3% mom gain which will boost the yoy rate to 2.8% (unrounded: 2.75%), which was the trend over the second half of last year.
Update: It Does Rain in California!
by Calculated Risk on 3/06/2017 11:22:00 AM
California has endured a five year drought, but for much of the state, the drought is over.
Here are a few resources to track the rain and snow.
These tables show the snowpack in the North, Central and South Sierra. Currently the snowpack is about 153% of normal for this date in the North, 189% of normal in the Central Sierra, and 197% of normal in the Southern Sierra.
And here are some plots comparing the current and previous years to the average, a very dry year ('14-'15) and a wet year ('82-'83). This winter is well above the average and close to the record winter of '82-'83 in the Central and Southern Sierra.
And for Los Angeles, here is a historical table of annual rainfall. After five years of significantly below average rainfall, this year is well above normal. On average, there is about 11" of rain through February in LA (rain is measured July through June). This year, LA has received over 18" of rain through February.
This is good news for the state and the state economy.
 For Pacific Crest Trail and John Muir Trail hikers, I recommend using the Upper Tyndall Creek sensor to track the snow conditions. This graph shows the snow water content for Upper Tyndall Creek for the last 40 years. Note: I hiked the trail in September 1998 - a very wet year - and there was snow all year on Mt. Whitney.
There were four very dry years in a row, and then last winter was a little better - but still below normal.
For the Tyndall Creek area, this is the wettest year since 1998, and it is still early March!
Black Knight: Mortgage "Origination volumes in 2016 highest level seen in nine years"
by Calculated Risk on 3/06/2017 08:01:00 AM
Black Knight Financial Services (BKFS) released their Mortgage Monitor report for January today. According to BKFS, 4.25% of mortgages were delinquent in January, down from 5.09% in January 2016. BKFS also reported that 0.94% of mortgages were in the foreclosure process, down from 1.30% a year ago.
This gives a total of 5.19% delinquent or in foreclosure.
Press Release: Black Knight’s Mortgage Monitor: Strong Q4 Pushes 2016 Originations to Highest Level in Nine Years; Reperforming Loan Population Sits at Nearly Two Million
Today, the Data & Analytics division of Black Knight Financial Services, Inc. (NYSE: BKFS) released its latest Mortgage Monitor Report, based on data as of the end of January 2017. This month, Black Knight examined final Q4 2016 origination data to get a sense of purchase and refinance lending volumes and trends for the year as a whole. In addition, the report also looked at the nation’s population of reperforming loans (RPLs), mortgages that had been at least 120 days or more delinquent or in active foreclosure at some point in the past but have now been current for at least four months. As Black Knight Data & Analytics Executive Vice President Ben Graboske explained, 2016 was the best year for overall mortgage originations since 2007.
“A strong fourth quarter finish to the year pushed total 2016 origination volumes to the highest level seen in nine years,” said Graboske. “We’ve now seen nine consecutive quarters of double-digit purchase origination growth, and growth overall in the purchase market in 21 of the past 22 quarters. The $2.1 trillion in first lien mortgages originated throughout the year represented a 17 percent increase over 2015, stemming from a 22 percent jump in refinance lending and a 13 percent increase in purchase loans. This was the second straight year of double-digit growth in purchase lending, which hit its highest yearly total since 2006 at $1.1 trillion. As good of a year as it was for purchase lending, it was still 28 percent off the peak volume seen in 2005.”
emphasis added
 Click on graph for larger image.
This graph from Black Knight shows first lien mortgage originations per year.
From Black Knight:
• A strong Q4 pushed total 2016 origination volumes to the highest level seen in nine years
• $2.1 trillion in first lien mortgages originated in 2016 represented a 17 percent increase over 2015
• Refinance lending was up 22 percent, while purchase originations rose 13 percent
 This graph from Black Knight shows purchases origination per quarter - and the year-over-year change.
From Black Knight:
• We’ve now seen nine consecutive quarters of double digit purchase origination growth, and overall growth in the purchase market in 21 of the past 22 quartersThere is much more in the mortgage monitor.
• $260B in purchase volume in Q4 2016 was the highest fourth quarter origination volume since 2006
• The annual purchase origination growth rate accelerated in Q4 from 11 percent to 14 percent
Sunday, March 05, 2017
Sunday Night Futures
by Calculated Risk on 3/05/2017 07:03:00 PM
Weekend:
• Schedule for Week of Mar 5, 2017
From CNBC: Pre-Market Data and Bloomberg futures: S&P futures are down 8, and DOW futures are down 68 (fair value).
Oil prices were down slightly over the last week with WTI futures at $53.24 per barrel and Brent at $55.90 per barrel. A year ago, WTI was at $36, and Brent was at $38 - so oil prices are up almost 50% year-over-year.
Here is a graph from Gasbuddy.com for nationwide gasoline prices. Nationally prices are at $2.31 per gallon - a year ago prices were at $1.82 per gallon - so gasoline prices are up about 50 cents a gallon year-over-year.
Oil: "Another big week for horizontal rigs"
by Calculated Risk on 3/05/2017 11:35:00 AM
A few comments from Steven Kopits of Princeton Energy Advisors LLC on Feb 4, 2017:
• US oil rig count up by 7 this week to 609
• US horizontal oil rigs were up by 11
...
• Horizontal oil rigs adds have averaged 12 per week for the last seven weeks
• The OPEC production cut thesis now warrants a closer review—shales are going to prove more resilient than people are thinking
 Click on graph for larger image.
Graph and comments Courtesy of Steven Kopits of Princeton Energy Advisors LLC.
Saturday, March 04, 2017
Schedule for Week of Mar 5, 2017
by Calculated Risk on 3/04/2017 08:09:00 AM
The key report this week is the February employment report on Friday.
Also the January Trade Deficit, and the Q4 Quarterly Services and the Fed's Q4 Flow of Funds reports, will be released this week.
10:00 AM: Manufacturers' Shipments, Inventories and Orders (Factory Orders) for January. The consensus is a 1.1% increase in orders.
 8:30 AM: Trade Balance report for January from the Census Bureau.
 This graph shows the U.S. trade deficit, with and without petroleum, through December. The blue line is the total deficit, and the black line is the petroleum deficit, and the red line is the trade deficit ex-petroleum products.
The consensus is for the U.S. trade deficit to be at $48.5 billion in January from $44.3 billion in December.
3:00 PM: Consumer credit from the Federal Reserve. The consensus is for a $18.3 billion increase in credit.
7:00 AM ET: The Mortgage Bankers Association (MBA) will release the results for the mortgage purchase applications index.
8:15 AM: The ADP Employment Report for February. This report is for private payrolls only (no government). The consensus is for 183,000 payroll jobs added in February, down from 246,000 added in January.
10:00 AM: Monthly Wholesale Trade: Sales and Inventories for January.
8:30 AM ET: The initial weekly unemployment claims report will be released. The consensus is for 238 thousand initial claims, up from 223 thousand the previous week.
10:00 AM: The Q4 Quarterly Services Report from the Census Bureau.
12:00 PM: Q4 Flow of Funds Accounts of the United States from the Federal Reserve.
8:30 AM: Employment Report for February. The consensus is for an increase of 195,000 non-farm payroll jobs added in February, down from the 227,000 non-farm payroll jobs added in January.
The consensus is for the unemployment rate to decline to 4.7%.
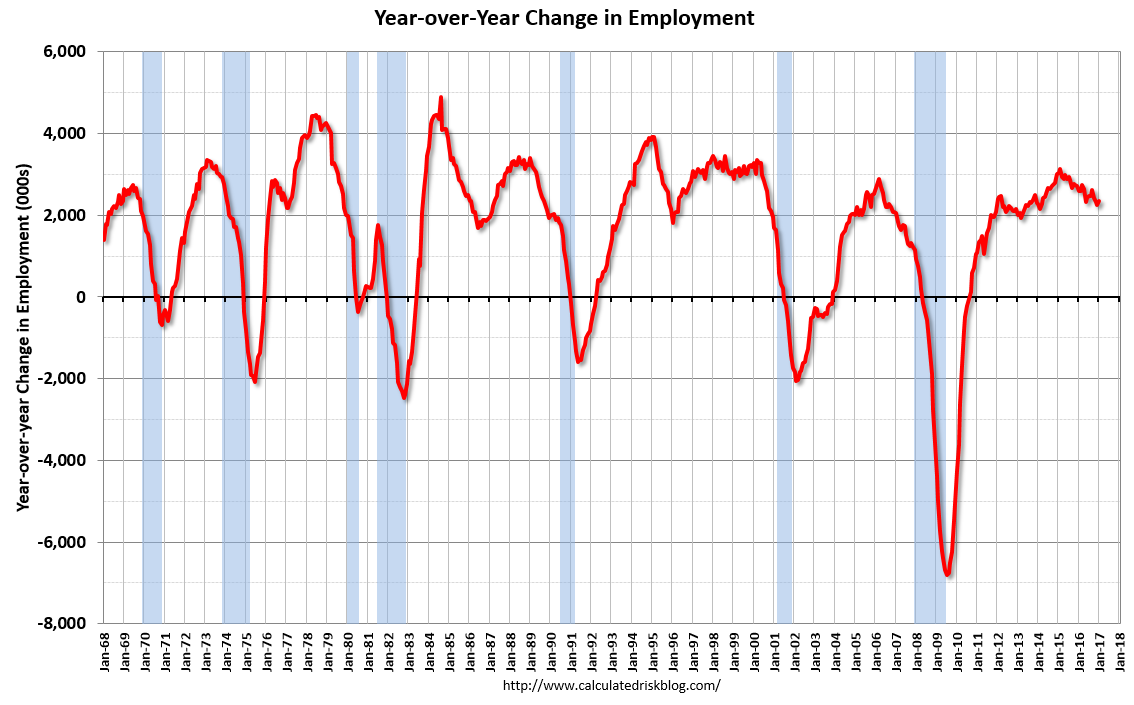 This graph shows the year-over-year change in total non-farm employment since 1968.
In January, the year-over-year change was 2.34 million jobs.
A key will be the change in wages.
Friday, March 03, 2017
AAR: Rail Traffic increased in February
by Calculated Risk on 3/03/2017 05:25:00 PM
From the Association of American Railroads (AAR) Rail Time Indicators. Graphs and excerpts reprinted with permission.
U.S. rail intermodal traffic in February 2017 was 1,068,439 containers and trailers, up 1.8% (19,350 units) over February 2016 and the best February ever for U.S. intermodal. U.S. rail carloads were 1,044,040 for the month, up 6.7% (65,141 carloads) over February 2016, thanks mainly to coal — coal carloads were up 19.2% (57,589 carloads) over last year.
 Click on graph for larger image.
This graph from the Rail Time Indicators report shows U.S. average weekly rail carloads (NSA). Dark blue is 2017.
Rail carloads have been weak over the last decade due to the decline in coal shipments.
February 2017 wasn’t a great month for rail traffic, but it was a good month, at least relatively speaking. U.S. railroads originated 1,044,040 total carloads for the month, up 6.7%, or 65,141 carloads, over February 2016. It’s the fourth straight year-over-year carload increase and the biggest percentage carload increase since December 2014. ...
 The second graph is for intermodal traffic (using intermodal or shipping containers):
U.S. rail intermodal volume in February 2017 was 1,068,439 containers and trailers, up 1.8% (19,350 units) over February 2016 and the highest-volume February ever for U.S. intermodal. In the first two months of 2017, U.S. intermodal volume was 2,089,507 units, down 0.04%, or 797 units, from 2016


