 RSS Feed
 by Calculated Risk on 3/25/2016 01:32:00 PM
Friday, March 25, 2016
DOT: Vehicle Miles Driven increased 2.0% year-over-year in January
The Department of Transportation (DOT) reported today:
Travel on all roads and streets changed by 2.0% (4.8 billion vehicle miles) for January 2016 as compared with January 2015.The following graph shows the rolling 12 month total vehicle miles driven to remove the seasonal factors.
Travel for the month is estimated to be 240.7 billion vehicle miles.
The seasonally adjusted vehicle miles traveled for January 2016 is 264.3 billion miles, a 2.7% (7.0 billion vehicle miles) increase over January 2015. It also represents a -0.8% change (-2.1 billion vehicle miles) compared with December 2015.
The rolling 12 month total is moving up - mostly due to lower gasoline prices - after moving sideways for several years.
 Click on graph for larger image.
In the early '80s, miles driven (rolling 12 months) stayed below the previous peak for 39 months.
Miles driven (rolling 12) had been below the previous peak for 85 months - an all time record - before reaching a new high for miles driven in January 2015.
The second graph shows the year-over-year change from the same month in the previous year.
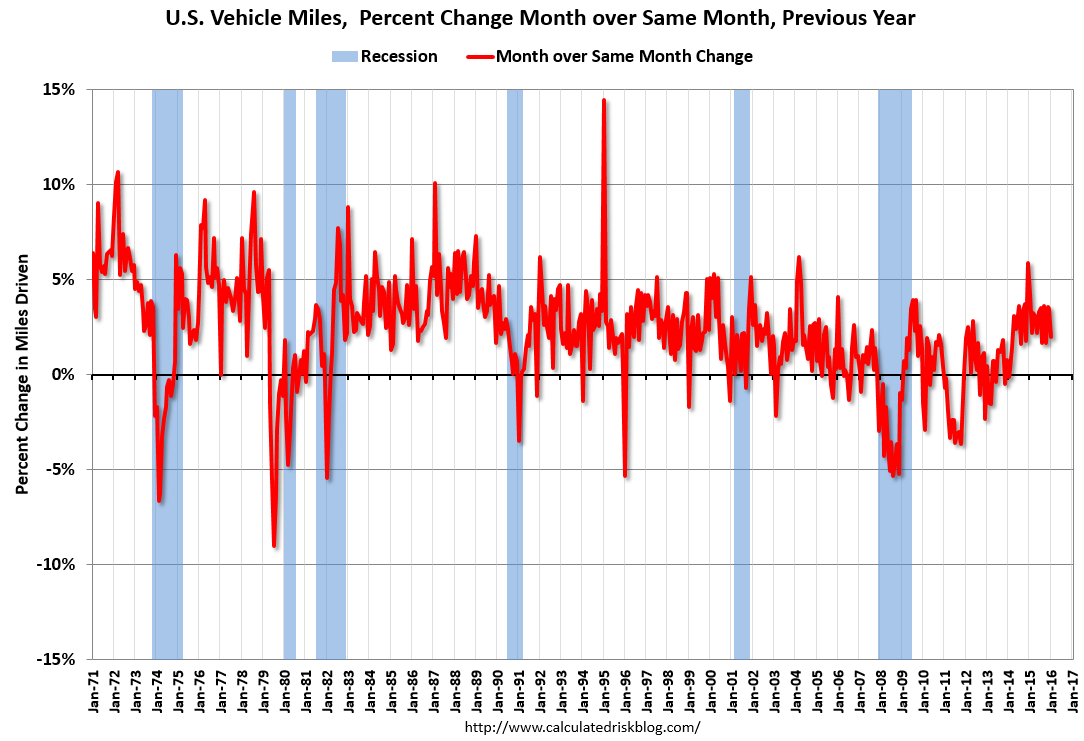 In January 2015, gasoline averaged $2.06 per gallon according to the EIA. That was down from January 2015 when prices averaged $2.21 per gallon.
Gasoline prices aren't the only factor - demographics are also important. However, with lower gasoline prices, miles driven on a rolling 12 month basis, is setting new highs each month.
BLS: Unemployment Rate decreased in 22 States in February
by Calculated Risk on 3/25/2016 10:19:00 AM
From the BLS: Regional and State Employment and Unemployment Summary
Regional and state unemployment rates were little changed in February. Twenty-two states had unemployment rate decreases from January, 8 states had increases, and 20 states and the District of Columbia had no change, the U.S. Bureau of Labor Statistics reported today.
...
New Hampshire and South Dakota had the lowest jobless rates in February, 2.7 percent each, followed by North Dakota, 2.9 percent. Alaska had the highest rate, 6.6 percent, closely followed by Mississippi and West Virginia, 6.5 percent each.
 Click on graph for larger image.
This graph shows the current unemployment rate for each state (red), and the max during the recession (blue). All states are well below the maximum unemployment rate for the recession.
The size of the blue bar indicates the amount of improvement. The yellow squares are the lowest unemployment rate per state since 1976.
The states are ranked by the highest current unemployment rate. Alaska, at 6.6%, had the highest state unemployment rate.
 The second graph shows the number of states (and D.C.) with unemployment rates at or above certain levels since January 2006. At the worst of the employment recession, there were 11 states with an unemployment rate at or above 11% (red).
Currently no state has an unemployment rate at or above 7% (light blue); Only seven states are at or above 6% (dark blue).
Q4 GDP Revised Up to 1.4% Annual Rate
by Calculated Risk on 3/25/2016 08:34:00 AM
From the BEA: Gross Domestic Product: Fourth Quarter 2015 (Third Estimate)
Real gross domestic product -- the value of the goods and services produced by the nation's economy less the value of the goods and services used up in production, adjusted for price changes -- increased at an annual rate of 1.4 percent in the fourth quarter of 2015, according to the "third" estimate released by the Bureau of Economic Analysis. In the third quarter, real GDP increased 2.0 percent.Here is a Comparison of Third and Second Estimates. PCE growth was revised up from 2.0% to 2.4%. Residential investment was revised up from 8.0% to 10.1%. This was above the consensus forecast.
The GDP estimate released today is based on more complete source data than were available for the "second" estimate issued last month. In the second estimate, the increase in real GDP was 1.0 percent. With this third estimate for the fourth quarter, the general picture of economic growth remains largely the same; personal consumption expenditures (PCE) increased more than previously estimated ...
emphasis added
Thursday, March 24, 2016
Goldman: "Inflation Finally Begins to Firm"
by Calculated Risk on 3/24/2016 07:42:00 PM
Friday:
• At 8:30 AM ET, Gross Domestic Product, 4th quarter 2015 (Third estimate). The consensus is that real GDP increased 1.0% annualized in Q4, unrevised from the second estimate.
• At 10:00 AM, Regional and State Employment and Unemployment (Monthly) for February 2016 from BLS.
A few excerpts from a research piece by Goldman Sachs economists David Mericle and Chris Mischaikow: Inflation Finally Begins to Firm
Fed officials have long argued that inflation has been soft primarily due to transitory factors and would eventually rise as these influences faded and the labor market tightened. Over the last half year, inflation has picked up substantially in a manner that closely fits the Fed’s narrative. Yet at the March FOMC meeting, both the Committee’s inflation projections and comments from Chair Yellen suggested a puzzlingly skeptical take on the encouraging recent data.
We see three broad reasons for the skepticism of some FOMC participants. First, some see ... one-off factors that are unlikely to persist. Second, others likely see downside risks from recent declines in inflation expectations. Third, some participants likely expect further drag from past or future dollar appreciation. ...
In our view, the FOMC had it right the first time. We expect disinflationary forces to fade further this year, while inflationary pressures should strengthen as the labor market continues to tighten ... As a result, we expect core PCE inflation to reach 1.8% by 2016Q4, 0.2pp above the FOMC’s projection, and headline PCE inflation to reach 1.5%, 0.3pp above the FOMC’s projection.
... As the year progresses, we expect that the FOMC will gradually revise up its inflation projections and ultimately conclude that an even stronger acceleration to 1.8% merits three hikes this year rather than two.
Vehicle Sales Forecast: Sales to Reach All Time High for the Month of March
by Calculated Risk on 3/24/2016 02:00:00 PM
The automakers will report March vehicle sales on Friday, April 1st.
Note: There were 27 selling days in March, up from 25 in March 2015.
From WardsAuto: Forecast: March Sales Set to Hit Record-High
A WardsAuto forecast calls for U.S. automakers to deliver 1.7 million light vehicles this month, a record high for March and the largest volume for any month since July 2005’s 1,804,240 units.Looks like another strong month for vehicle sales.
The forecasted daily sales rate of 61,727 over 27 days is a best-ever March result. This DSR represents a 0.2% improvement from like-2015 (25 days), while total volume for the month would be 8.2% greater than year-ago. If deliveries meet or exceed WardsAuto’s expectations, March will be the eight consecutive month to outpace prior-year on a DSR basis.
...
The report puts the seasonally adjusted annual rate of sales for the month at 17.3 million units, below the 17.4 million SAAR from the first two months of 2016 combined, but well above the 17.1 million SAAR from same-month year-ago.
emphasis added
Kansas City Fed: Regional Manufacturing Activity "remained negative" in March
by Calculated Risk on 3/24/2016 11:00:00 AM
From the Kansas City Fed: Tenth District Manufacturing Activity Remained Negative
The Federal Reserve Bank of Kansas City released the March Manufacturing Survey today. According to Chad Wilkerson, vice president and economist at the Federal Reserve Bank of Kansas City, the survey revealed that Tenth District manufacturing activity remained negative.The Kansas City region continues to be hit hard by lower oil prices and the stronger dollar.
“Factories reported another decline in activity in March, although the drop was somewhat smaller than in the previous three months” said Wilkerson.
...
Tenth District manufacturing activity remained negative, while producers’ expectations for future activity weakened. Most price indexes edged higher in March, but remained at low levels.
The month-over-month composite index was -6 in March, up from -12 in February and -9 in January ... The new orders, order backlog, and employment indexes improved slightly but remained in negative territory.
emphasis added
Weekly Initial Unemployment Claims increase to 265,000
by Calculated Risk on 3/24/2016 08:38:00 AM
The DOL reported:
Note: This week's release reflects the annual revision to the weekly unemployment claims seasonal adjustment factors. The seasonal adjustment factors used for the UI Weekly Claims data from 2011 forward, along with the resulting seasonally adjusted values for initial claims and continuing claims, have been revised.The previous week was revised down.
In the week ending March 19, the advance figure for seasonally adjusted initial claims was 265,000, an increase of 6,000 from the previous week's revised level. The previous week's level was revised down by 6,000 from 265,000 to 259,000. The 4-week moving average was 259,750, an increase of 250 from the previous week's revised average. The previous week's average was revised down by 8,500 from 268,000 to 259,500.
There were no special factors impacting this week's initial claims. This marks 55 consecutive weeks of initial claims below 300,000, the longest streak since 1973.
Note: The following graph shows the 4-week moving average of weekly claims since 1971.
 Click on graph for larger image.
The dashed line on the graph is the current 4-week average. The four-week average of weekly unemployment claims increased to 259,750.
This was below the consensus forecast of 268,000. The low level of the 4-week average suggests few layoffs.
Wednesday, March 23, 2016
Thursday: Durable Goods, Unemployment Claims
by Calculated Risk on 3/23/2016 06:58:00 PM
Here is an interesting paper from Jordan Rappaport at the Kansas City Fed: The Limited Supply of Homes
Over the longer term, the supply of homes for purchase should considerably improve as baby boomers increasingly downsize from single-family to multifamily homes. But recent experience suggests that downsizing typically begins when people are in their late seventies, a milestone the leading edge of the baby boomers will not reach for another five years (Rappaport 2015). Until then, the supply of single-family homes for purchase is likely to remain tight, putting continuing upward pressure on home prices.Thursday:
• At 8:30 AM ET, the initial weekly unemployment claims report will be released. The consensus is for 268 thousand initial claims, up from 265 thousand the previous week.
• Also at 8:30 AM, Durable Goods Orders for February from the Census Bureau. The consensus is for a 3.0% decrease in durable goods orders.
• At 11:00 AM, the Kansas City Fed Survey of Manufacturing Activity for March.
Comments on February New Home Sales
by Calculated Risk on 3/23/2016 03:20:00 PM
The new home sales report for February was slightly above expectations at 512,000 on a seasonally adjusted annual rate basis (SAAR), and combined sales for November, December and January were revised up.
Sales were down 6.1% year-over-year (YoY) compared to February 2015. However, we have to remember February 2015 was the strongest month of 2015 at 545,000 SAAR. Sales for all of 2015 were 501,000 (up 14.5% from 2014) - and since January and February were especially strong months last year, the YoY comparisons have been difficult so far.
Earlier: New Home Sales increased to 512,000 Annual Rate in February.
 Click on graph for larger image.
This graph shows new home sales for 2015 and 2016 by month (Seasonally Adjusted Annual Rate).
The comparisons for the first two months was difficult. I also expect lower growth this year overall.
Houston (and other oil producing areas) will have a problem this year. Inventory of existing homes is increasing quickly and prices will probably decline in those areas. And that means new home construction will slow in those areas too.
And here is another update to the "distressing gap" graph that I first started posting a number of years ago to show the emerging gap caused by distressed sales. Now I'm looking for the gap to close over the next several years.
 The "distressing gap" graph shows existing home sales (left axis) and new home sales (right axis) through February 2016. This graph starts in 1994, but the relationship had been fairly steady back to the '60s.
Following the housing bubble and bust, the "distressing gap" appeared mostly because of distressed sales.
I expect existing home sales to move more sideways, and I expect this gap to slowly close, mostly from an increase in new home sales.
However, this assumes that the builders will offer some smaller, less expensive homes. If not, then the gap will persist.
Note: Existing home sales are counted when transactions are closed, and new home sales are counted when contracts are signed. So the timing of sales is different.
AIA: "Modest Expansion for Architecture Billings Index"
by Calculated Risk on 3/23/2016 12:58:00 PM
Note: This index is a leading indicator primarily for new Commercial Real Estate (CRE) investment.
From the AIA: Modest Expansion for Architecture Billings Index
The Architecture Billings Index saw a dip into negative terrain for the first time in five months in January, but inched back up in February with a small increase in demand for design services. As a leading economic indicator of construction activity, the ABI reflects the approximate nine to twelve month lead time between architecture billings and construction spending. The American Institute of Architects (AIA) reported the February ABI score was 50.3, up slightly from the mark of 49.6 in the previous month. This score reflects a minor increase in design services (any score above 50 indicates an increase in billings). The new projects inquiry index was 59.5, up from a reading of 55.3 the previous month.
“March and April are traditionally the busiest months for architecture firms, so we should get a clearer reading of underlying momentum over the next couple of months,” said AIA Chief Economist, Kermit Baker, Hon. AIA, PhD. “Hopefully the relatively mild weather conditions recently in most parts of the country will help design and construction activity move ahead at a somewhat faster pace.”
...
• Regional averages: South (51.1), West (49.9), Northeast (49.5), Midwest (49.3)
• Sector index breakdown: multi-family residential (53.0), commercial / industrial (52.3), institutional (48.1), mixed practice (47.7)
emphasis added
 Click on graph for larger image.
This graph shows the Architecture Billings Index since 1996. The index was at 50.3 in February, up from 49.6 in January. Anything above 50 indicates expansion in demand for architects' services.
Note: This includes commercial and industrial facilities like hotels and office buildings, multi-family residential, as well as schools, hospitals and other institutions.
The multi-family residential market was negative for most of last year - suggesting a slowdown or less growth for apartments - but has been positive for the last five months.
According to the AIA, there is an "approximate nine to twelve month lag time between architecture billings and construction spending" on non-residential construction. This index was positive in 8 of the last 12 months, suggesting a further increase in CRE investment in 2016.


