 RSS Feed
 by Calculated Risk on 3/16/2016 02:02:00 PM
Wednesday, March 16, 2016
FOMC Statement: No Change to Policy, Concern about Global developments
Note: Fewer rate hikes expected.
FOMC Statement:
Information received since the Federal Open Market Committee met in January suggests that economic activity has been expanding at a moderate pace despite the global economic and financial developments of recent months. Household spending has been increasing at a moderate rate, and the housing sector has improved further; however, business fixed investment and net exports have been soft. A range of recent indicators, including strong job gains, points to additional strengthening of the labor market. Inflation picked up in recent months; however, it continued to run below the Committee's 2 percent longer-run objective, partly reflecting declines in energy prices and in prices of non-energy imports. Market-based measures of inflation compensation remain low; survey-based measures of longer-term inflation expectations are little changed, on balance, in recent months.
Consistent with its statutory mandate, the Committee seeks to foster maximum employment and price stability. The Committee currently expects that, with gradual adjustments in the stance of monetary policy, economic activity will expand at a moderate pace and labor market indicators will continue to strengthen. However, global economic and financial developments continue to pose risks. Inflation is expected to remain low in the near term, in part because of earlier declines in energy prices, but to rise to 2 percent over the medium term as the transitory effects of declines in energy and import prices dissipate and the labor market strengthens further. The Committee continues to monitor inflation developments closely.
Against this backdrop, the Committee decided to maintain the target range for the federal funds rate at 1/4 to 1/2 percent. The stance of monetary policy remains accommodative, thereby supporting further improvement in labor market conditions and a return to 2 percent inflation.
In determining the timing and size of future adjustments to the target range for the federal funds rate, the Committee will assess realized and expected economic conditions relative to its objectives of maximum employment and 2 percent inflation. This assessment will take into account a wide range of information, including measures of labor market conditions, indicators of inflation pressures and inflation expectations, and readings on financial and international developments. In light of the current shortfall of inflation from 2 percent, the Committee will carefully monitor actual and expected progress toward its inflation goal. The Committee expects that economic conditions will evolve in a manner that will warrant only gradual increases in the federal funds rate; the federal funds rate is likely to remain, for some time, below levels that are expected to prevail in the longer run. However, the actual path of the federal funds rate will depend on the economic outlook as informed by incoming data.
The Committee is maintaining its existing policy of reinvesting principal payments from its holdings of agency debt and agency mortgage-backed securities in agency mortgage-backed securities and of rolling over maturing Treasury securities at auction, and it anticipates doing so until normalization of the level of the federal funds rate is well under way. This policy, by keeping the Committee's holdings of longer-term securities at sizable levels, should help maintain accommodative financial conditions.
Voting for the FOMC monetary policy action were: Janet L. Yellen, Chair; William C. Dudley, Vice Chairman; Lael Brainard; James Bullard; Stanley Fischer; Loretta J. Mester; Jerome H. Powell; Eric Rosengren; and Daniel K. Tarullo. Voting against the action was Esther L. George, who preferred at this meeting to raise the target range for the federal funds rate to 1/2 to 3/4 percent.
emphasis added
Key Measures Show Inflation slightly above 2% in February
by Calculated Risk on 3/16/2016 11:16:00 AM
The Cleveland Fed released the median CPI and the trimmed-mean CPI this morning:
According to the Federal Reserve Bank of Cleveland, the median Consumer Price Index rose 0.2% (2.8% annualized rate) in February. The 16% trimmed-mean Consumer Price Index also rose 0.2% (2.6% annualized rate) during the month. The median CPI and 16% trimmed-mean CPI are measures of core inflation calculated by the Federal Reserve Bank of Cleveland based on data released in the Bureau of Labor Statistics' (BLS) monthly CPI report.Note: The Cleveland Fed has the median CPI details for February here. Motor fuel was down 81% annualized in February.
Earlier today, the BLS reported that the seasonally adjusted CPI for all urban consumers fell 0.2% (-2.0% annualized rate) in February. The CPI less food and energy rose 0.3% (3.4% annualized rate) on a seasonally adjusted basis.
 Click on graph for larger image.
This graph shows the year-over-year change for these four key measures of inflation. On a year-over-year basis, the median CPI rose 2.4%, the trimmed-mean CPI rose 2.0%, and the CPI less food and energy also rose 2.3%. Core PCE is for January and increased 1.7% year-over-year.
On a monthly basis, median CPI was at 2.8% annualized, trimmed-mean CPI was at 2.6% annualized, and core CPI was at 3.4% annualized.
On a year-over-year basis, three of these measures are at or above 2%.
Using these measures, inflation has been moving up, and three of the measures are at or above the Fed's target (Core PCE is still below).
Fed: Industrial Production decreased 0.5% in February
by Calculated Risk on 3/16/2016 09:23:00 AM
From the Fed: Industrial production and Capacity Utilization
Industrial production decreased 0.5 percent in February after increasing 0.8 percent in January. Sizable declines in the indexes for both utilities and mining in February outweighed a gain of 0.2 percent for manufacturing. The output of utilities dropped 4.0 percent, as unseasonably warm weather curbed the demand for heating. Mining production fell 1.4 percent and has decreased nearly 1.3 percent per month, on average, over the past six months. At 106.3 percent of its 2012 average, total industrial production in February was 1.0 percent below its year-earlier level. Capacity utilization for the industrial sector decreased 0.4 percentage point in February to 76.7 percent, a rate that is 3.3 percentage points below its long-run (1972–2015) average.
emphasis added
 Click on graph for larger image.
This graph shows Capacity Utilization. This series is up 10.2 percentage points from the record low set in June 2009 (the series starts in 1967).
Capacity utilization at 76.7% is 3.3% below the average from 1972 to 2015 and below the pre-recession level of 80.8% in December 2007.
Note: y-axis doesn't start at zero to better show the change.
 The second graph shows industrial production since 1967.
Industrial production decreased 0.5% in February to 106.3. This is 21.9% above the recession low, and 1.1% above the pre-recession peak.
This was below expectations of a 0.2% decrease.
Housing Starts increased to 1.178 Million Annual Rate in February
by Calculated Risk on 3/16/2016 08:39:00 AM
From the Census Bureau: Permits, Starts and Completions
Housing Starts:
Privately-owned housing starts in February were at a seasonally adjusted annual rate of 1,178,000. This is 5.2 percent above the revised January estimate of 1,120,000 and is 30.9 percent above the February 2015 rate of 900,000.
Single-family housing starts in February were at a rate of 822,000; this is 7.2 percent above the revised January figure of 767,000. The February rate for units in buildings with five units or more was 341,000.
Building Permits:
Privately-owned housing units authorized by building permits in February were at a seasonally adjusted annual rate of 1,167,000. This is 3.1 percent below the revised January rate of 1,204,000, but is 6.3 percent above the February 2015 estimate of 1,098,000.
Single-family authorizations in February were at a rate of 731,000; this is 0.4 percent above the revised January figure of 728,000. Authorizations of units in buildings with five units or more were at a rate of 401,000 in February.
emphasis added
 Click on graph for larger image.
The first graph shows single and multi-family housing starts for the last several years.
Multi-family starts (red, 2+ units) increased in February. Multi-family starts are up 19% year-over-year.
Single-family starts (blue) increased in February and are up 37% year-over-year.
 The second graph shows total and single unit starts since 1968.
 The second graph shows the huge collapse following the housing bubble, and then - after moving sideways for a couple of years - housing is now recovering (but still historically low),
Total housing starts in February were above expectations - especially strong for single family starts - and starts for December and January were revised up. A strong report. I'll have more later ...
MBA: Mortgage Applications Decreased in Latest Weekly Survey, Purchase Applications up 33% YoY
by Calculated Risk on 3/16/2016 07:00:00 AM
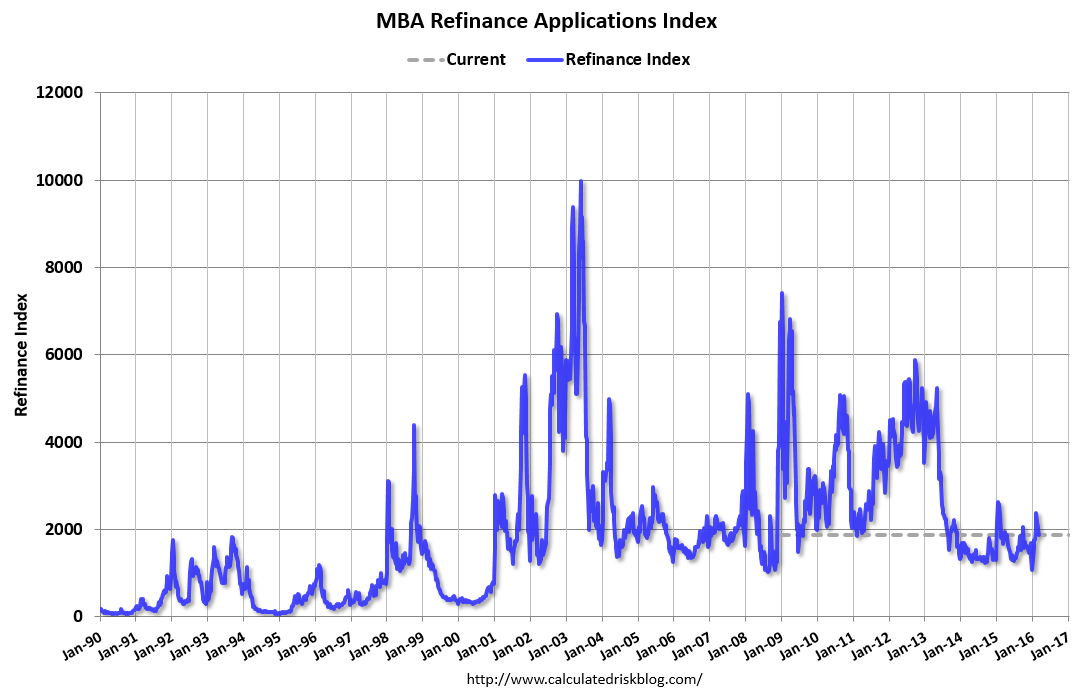
From the MBA: Refinance Applications Continue to Drop in Latest MBA Weekly Survey
Mortgage applications decreased 3.3 percent from one week earlier, according to data from the Mortgage Bankers Association’s (MBA) Weekly Mortgage Applications Survey for the week ending March 11, 2016.
...
The Refinance Index decreased 6 percent from the previous week. The seasonally adjusted Purchase Index increased 0.3 percent to its highest level since January 2016. The unadjusted Purchase Index increased 1 percent compared with the previous week and was 33 percent higher than the same week one year ago.
...
The average contract interest rate for 30-year fixed-rate mortgages with conforming loan balances ($417,000 or less) increased to 3.94 percent from 3.89 percent, with points increasing to 0.42 from 0.38 (including the origination fee) for 80 percent loan-to-value ratio (LTV) loans.
emphasis added
 Click on graph for larger image.
The first graph shows the refinance index since 1990.
Refinance activity was higher in 2015 than in 2014, but it was still the third lowest year since 2000.
Refinance activity has picked up recently as rates have declined.
 The second graph shows the MBA mortgage purchase index.
 According to the MBA, the unadjusted purchase index is 33% higher than a year ago.
Tuesday, March 15, 2016
Wednesday: FOMC, Housing Starts, CPI, Industrial Production
by Calculated Risk on 3/15/2016 06:40:00 PM
Wednesday:
• At 7:00 AM ET, The Mortgage Bankers Association (MBA) will release the results for the mortgage purchase applications index.
• At 8:30 AM, Housing Starts for February. Total housing starts decreased to 1.099 million (SAAR) in January. Single family starts decreased to 731 thousand SAAR in January. The consensus for 1.146 million, up from the January rate.
• Also at 8:30 AM, The Consumer Price Index for February from the BLS. The consensus is for a 0.3% decrease in CPI, and a 0.2% increase in core CPI.
• At 9:15 AM, The Fed will release Industrial Production and Capacity Utilization for February. The consensus is for a 0.2% decrease in Industrial Production, and for Capacity Utilization to decrease to 76.9%.
• At 2:00 PM, FOMC Meeting Announcement. No change to the Fed Funds rate is expected at this meeting.
• Also at 2:00 PM, FOMC Forecasts This will include the Federal Open Market Committee (FOMC) participants' projections of the appropriate target federal funds rate along with the quarterly economic projections.
• At 2:30 PM, Fed Chair Janet Yellen holds a press briefing following the FOMC announcement.
FNC: Residential Property Values increased 6.4% year-over-year in January
by Calculated Risk on 3/15/2016 03:28:00 PM
In addition to Case-Shiller, and CoreLogic, I'm also watching the FNC, Zillow and several other house price indexes.
FNC released their January 2016 index data. FNC reported that their Residential Price Index™ (RPI) indicates that U.S. residential property values decreased 0.3% from December to January (Composite 100 index, not seasonally adjusted).
The 10 city MSA decreased 0.4% (NSA), the 20-MSA RPI decreased 0.3%, and the 30-MSA RPI decreased 0.4% in January. These indexes are not seasonally adjusted (NSA), and are for non-distressed home sales (excluding foreclosure auction sales, REO sales, and short sales).
From FNC: FNC Index: January Home Prices Down 0.3
According to the latest FNC Residential Price Index™ (RPI), U.S. home prices in January showed a seasonal decline, down 0.3% from December, reflecting flat home sales during the same period. On a year-over-year basis, home prices rose 6.4% from December 2015.Notes: In addition to the composite indexes, FNC presents price indexes for 30 MSAs. FNC also provides seasonally adjusted data.
“January is typically a slow month for housing activity, and month-over-month fluctuations in home prices tend to reflect that,” said Yanling Mayer, FNC’s housing economist and Director of Research.
...
In Houston, home prices were down 2.0%, or an average of 1.2% per month in the last 3 months, likely impacted by job losses in the energy sector from collapsing oil prices.
The index is still down 14.3% from the peak in 2006 (not inflation adjusted).
 Click on graph for larger image.
This graph shows the year-over-year change based on the FNC index (four composites) through January 2016. The FNC indexes are hedonic price indexes using a blend of sold homes and real-time appraisals.
Most of the other indexes are also showing the year-over-year change in the mid single digit range.
Note: The January Case-Shiller index will be released on Tuesday, March 29th.
Goldman: "We see the cyclical 'participation gap' as nearly closed"
by Calculated Risk on 3/15/2016 12:31:00 PM
A few excerpts from a research piece by Goldman Sachs economist David Mericle: Breaking Down the Rebound in the Participation Rate
The labor force participation rate has risen 0.5 percentage points (pp) since its September low. ... The largest contributors to the rebound have been, in descending order, declines in the share of the population in school, retired, disabled, and not wanting to work. Participation rates for all age groups have risen, reflecting declines in the share of young people in school, in the share of prime-age workers in all non-participation categories, and in the share of older people retired.
At this point, we see the cyclical “participation gap” as nearly closed. While some types of non-participators could be drawn into a very hot labor market, our baseline expectation is that the participation rate will decline by 0.25pp per year from its current level.
...
our forecast for the breakeven rate of payroll growth at 85k.
 Click on graph for larger image.
CR Note: This graph shows the employment population ratio and the participation rate.
The Labor Force Participation Rate (blue line) increased in February to 62.9%. This is the percentage of the working age population in the labor force.
I agree with Mericle that most of the "participation gap" has closed, and I expect the participation rate to decline further over the next decade.
Note: A large portion of the recent decline in the participation rate is due to long term trends and demographics.
Also note that Mericle estimates that payroll growth of 85,000 per month will keep the unemployment rate unchanged.
NAHB: Builder Confidence unchanged at 58 in March
by Calculated Risk on 3/15/2016 10:05:00 AM
The National Association of Home Builders (NAHB) reported the housing market index (HMI) was at 58 in March, unchanged from 58 in February. Any number above 50 indicates that more builders view sales conditions as good than poor.
From the NAHB: Builder Confidence Holds Steady in March
uilder confidence in the market for newly-built single-family homes was unchanged in March at a level of 58 on the NAHB/Wells Fargo Housing Market Index (HMI).
“Confidence levels are hovering above the 50-point mid-range, indicating that the single-family market continues to make slow but steady progress,” said NAHB Chairman Ed Brady. “However, builders continue to report problems regarding a shortage of lots and labor.”
“While builder sentiment has been relatively flat for the last few months, the March HMI reading correlates with NAHB’s forecast of a steady firming of the single-family sector in 2016,” said NAHB Chief Economist David Crowe. “Solid job growth, low mortgage rates, and improving mortgage availability will help keep the housing market on a gradual upward trajectory in the coming months.”
...
The HMI component gauging current sales conditions held steady at 65 in March while the index measuring sales expectations in the next six months fell three points to 61. The component charting buyer traffic rose four points to 43.
Looking at the three-month moving averages for regional HMI scores, the Midwest posted a one-point gain to 58 while the South was unchanged at 59. The West registered a three-point decline to 69 while the Northeast fell one point to 46.
emphasis added
 Click on graph for larger image.
This graph show the NAHB index since Jan 1985.
This was below the consensus forecast of 59, but still a strong reading.
Retail Sales decreased 0.1% in February
by Calculated Risk on 3/15/2016 08:49:00 AM
On a monthly basis, retail sales were down 0.1% from January to February (seasonally adjusted), and sales were up 3.1% from February 2015.
From the Census Bureau report:
The U.S. Census Bureau announced today that advance estimates of U.S. retail and food services sales for February, adjusted for seasonal variation and holiday and trading-day differences, but not for price changes, were $447.3 billion, a decrease of 0.1 percent from the previous month, and 3.1 percent above February 2015. ... The December 2015 to January 2016 percent change was revised from up 0.2 percent to down 0.4 percent (
 Click on graph for larger image.
This graph shows retail sales since 1992. This is monthly retail sales and food service, seasonally adjusted (total and ex-gasoline).
Retail sales ex-gasoline were up 0.2%.
The second graph shows the year-over-year change in retail sales and food service (ex-gasoline) since 1993.
 Retail and Food service sales ex-gasoline increased by 4.8% on a YoY basis.
The decrease in February was at expectations, however retail sales for December were revised down. Even though disappointing (including revisions), sales ex-gasoline are up a solid 4.8% YoY.


