 RSS Feed
 by Calculated Risk on 11/13/2015 12:21:00 PM
Friday, November 13, 2015
Flashback to 2006: "Housing prices have got a long way to fall"
Sometimes I look back through some older posts. Back in 2005 and 2006, the primary subject of my posts were the housing bubble, and the potential impact of the then coming housing bust on the US economy.
There were a number of people warning about the housing bust. Here is an interview I came across this morning. In this September 2006 post, I linked to a Bloomberg video of Paul Krugman discussing housing:
"I think we are looking at a housing cycle that we've never seen.On a national basis, according to Case-Shiller, house prices declined 25% following that interview to the post-bubble lows. In Las Vegas, house prices fell 60%.
...
If history is any guide, housing prices have got a long way to fall and the housing industry is going to go through a long drought."
And on the "long drought" ... housing starts fell over 70% ... and are still 30% below the level of September 2006.
Sometimes economists and analysts get it right.
Preliminary November Consumer Sentiment increases to 93.1
by Calculated Risk on 11/13/2015 10:02:00 AM
The preliminary University of Michigan consumer sentiment index for November was at 93.1, up from 90.0 in October.
"Confidence rose in early November mainly due to a stronger outlook for the domestic economy. Overall, the most recent confidence reading was equal to the average during the first ten months of 2015, and higher than any year since 2004. Two trends dominated the early November data: consumers anticipated somewhat larger income increases during the year ahead as well as expected a somewhat lower inflation rate. This meant that consumers held the most favorable inflation-adjusted income expectations since 2007. Moreover, the somewhat larger gains were anticipated by lower income households. Buying plans for large discretionary purchases improved, especially for vehicles. Overall, the data indicate an expected rate of growth in personal consumption expenditures of 2.9% in 2016. "This was above the consensus forecast of 92.0.

Click on graph for larger image.
Retail Sales increased 0.1% in October
by Calculated Risk on 11/13/2015 08:40:00 AM
On a monthly basis, retail sales were up 0.1% from September to October (seasonally adjusted), and sales were up 1.7% from October 2014.
From the Census Bureau report:
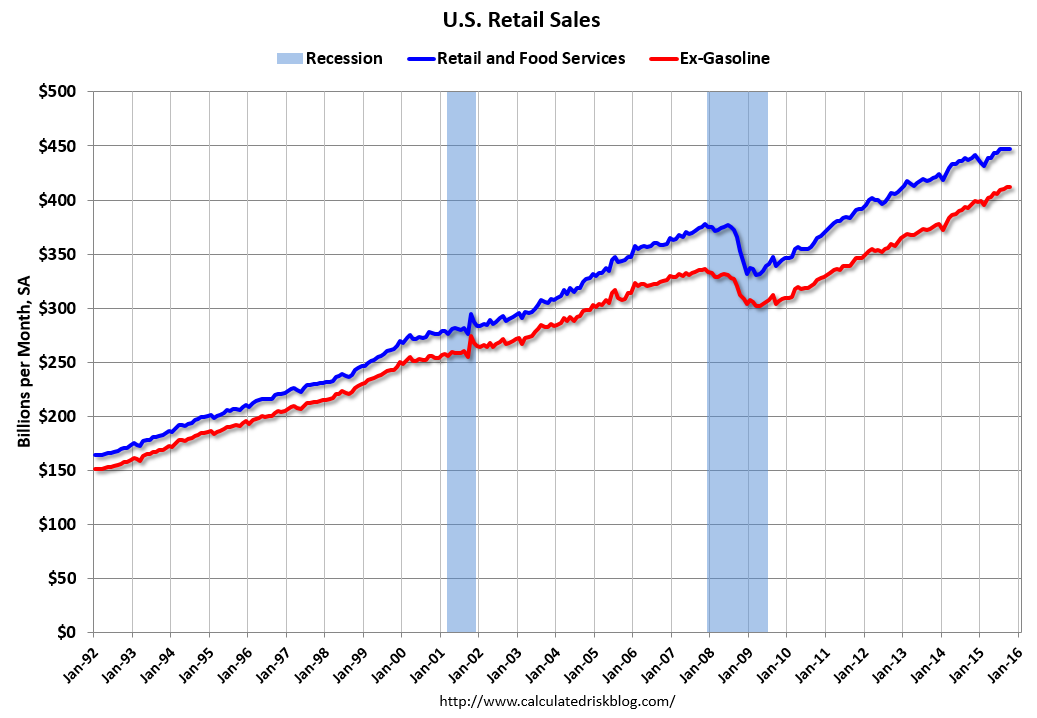
The U.S. Census Bureau announced today that advance estimates of U.S. retail and food services sales for October, adjusted for seasonal variation and holiday and trading-day differences, but not for price changes, were $447.3 billion, an increase of 0.1 percent from the previous month, and 1.7 percent above October 2014. ... The August 2015 to September 2015 percent change was revised from +0.1 percent to virtually unchanged.
 Click on graph for larger image.
This graph shows retail sales since 1992. This is monthly retail sales and food service, seasonally adjusted (total and ex-gasoline).
Retail sales ex-gasoline increased 0.1%.
The second graph shows the year-over-year change in retail sales and food service (ex-gasoline) since 1993.
 Retail and Food service sales ex-gasoline increased by 4.1% on a YoY basis (1.7% for all retail sales including gasoline).
The increase in October was below expectations of a 0.3% increase,and sales in August and September were revised down. This was a weak report, however sales ex-gasoline are still up a decent 4.1% YoY.
Thursday, November 12, 2015
Friday: Retail Sales, PPI, Consumer Sentiment
by Calculated Risk on 11/12/2015 08:24:00 PM
Friday:
• At 8:30 AM ET, the Producer Price Index for October from the BLS. The consensus is for a 0.2% increase in prices, and a 0.1% increase in core PPI.
• Also at 8:30 AM, Retail sales for October will be released. On a monthly basis, retail sales were up 0.1% from August to September (seasonally adjusted), and sales were up 2.4% from September 2014. The consensus is for retail sales to increase 0.3% in October, and to increase 0.4% ex-autos.
• At 10:00 AM, Manufacturing and Trade: Inventories and Sales (business inventories) report for September. The consensus is for no change in inventories.
• Also at 10:00 AM, University of Michigan's Consumer sentiment index (preliminary for November). The consensus is for a reading of 92.0, up from 90.0 in October.
From Reuters: Oil slumps 4 percent, nears new six-year low as glut persists
Oil prices tumbled almost 4 percent on Thursday, accelerating a slump that threatens to test new six-and-a-half year lows, with traders unnerved by a persistent rise in U.S. stockpiles and a downbeat forecast for next year.
...
The latest decline was triggered by data showing that U.S. stockpiles were still rising rapidly toward the record highs reached in April, despite slowing U.S. shale production.
 Click on graph for larger image
This graph shows WTI and Brent spot oil prices from the EIA. (Prices Friday added). According to Bloomberg, WTI was at $41.66 per barrel today, and Brent at $44.06.
This is about still above the lows back in August ($38.22 for WTI, and $41.59 for Brent), and down almost 50% year-over-year.
Fed's Fischer: "The Transmission of Exchange Rate Changes to Output and Inflation"
by Calculated Risk on 11/12/2015 06:29:00 PM
From Fed Vice Chair Stanley Fischer The Transmission of Exchange Rate Changes to Output and Inflation. An excerpt on the strong dollar and inflation:
One way in which the stronger dollar depresses inflation is by putting downward pressure on import prices. ...Fischer thinks the impact of the strong dollar on inflation will be transient, and PCE inflation will rise next year.
An important difference between the transmission of dollar appreciation to inflation compared with output is that the effects on inflation are probably more transient. In particular, given that most of the effect on inflation occurs through changes in import prices--and import prices respond quickly to the exchange rate--the peak effect on inflation probably occurs within a few quarters. From the standpoint of the outlook, this transience means that some of the forces holding down inflation in 2015--particularly those due to a stronger dollar and lower energy prices--will begin to fade next year. Consequently, overall PCE inflation is likely on this account alone to rebound next year to around 1-1/2 percent. And as long as inflation expectations remain well anchored, both core and overall inflation are likely to rise gradually toward 2 percent over the medium term as the labor market improves further and the transitory effects of declines in energy and import prices dissipate.
emphasis added
Rosenberg on Labor Force Participation Rate
by Calculated Risk on 11/12/2015 02:27:00 PM
David Rosenberg, chief economist at Gluskin Sheff wrote about the Labor Force Participation Rate (LFPR) in his daily "Breakfast with Dave" newsletter: THEY AIN’T COMING BACK.
The title says it all. Here is the introduction and his conclusion (a long piece):
There has been a surprisingly large amount of commentary writing off the improvement in the U.S. unemployment rate — which dipped below the Congressional Budget Office’s estimate of the non-accelerating inflation rate of unemployment (NAIRU) for the first time since February 2008 in October — given that we have not seen an attendant uptick in the labour force participation rate.This is similar to my post earlier this year: Why the Prime Labor Force Participation Rate has Declined. Rosenberg focused on the Boomers retiring, however I've argued there are other factors too (People staying in school longer and a slow, but steady decline in prime men participation). But our conclusions are the same: the participation rate has mostly declined due to structural factors, not cyclical. And the participation rate will continue to decline for the next decade or more.
...
So, once again, any mention of the participation rate — or alternatively, mentions of a participation rate-adjusted unemployment rate or anything else of along those lines — as an indicator of labour market slack or as an argument for why the unemployment rate is obsolete and should be ignored, especially in the context of the policy discussion.
emphasis added
Fed's Dudley and Evans
by Calculated Risk on 11/12/2015 12:29:00 PM
First, from the WSJ Economists Overwhelmingly Expect Fed to Raise Interest Rates in December
About 92% of the business and academic economists polled by The Wall Street Journal in recent days said they expected the Fed to raise its benchmark federal-funds rate at its Dec. 15-16 policy meeting. Some 5% said the Fed would stay on hold until March and 3% predicted the Fed would keep rates at near-zero even longer.From NY Fed President William Dudley sees the risks in liftoff as "balanced": The U.S. Economic Outlook and Monetary Policy
I see the risks right now of moving too quickly versus moving too slowly as nearly balanced. The weight that one puts on each undoubtedly influences one’s views on when the time will be right to begin to normalize monetary policy and the appropriate short-term rate trajectory thereafter.Chicago Fed President Charles Evans argues for a later liftoff: A Cautious Approach to Monetary Policy Normalization
There is no doubt that labor markets have improved significantly over the past seven years. Job growth has been quite solid for some time now. That includes last month’s number, which was quite good. And today, at 5 percent, the unemployment rate is one half its peak in 2009. This is just a tenth of a percentage point above the median long-run projection. However, a number of other labor market indicators lead me to believe that there still remains some additional resource slack beyond what is indicated by the unemployment rate alone: Notably, 1) a large number of people who are employed part time would prefer a full-time job; 2) the labor force participation rate is quite low, even after accounting for demographic and other long-running trends; and 3) wage growth has been quite subdued. In sum, I don’t think we’re quite there yet, but we have made good progress toward meeting our employment mandate.
...
However, I am far less confident about reaching our inflation goal within a reasonable time frame. Inflation has been too low for too long. Core PCE inflation — which strips out the volatile energy and food components and is a good indicator of underlying inflation trends — has averaged just 1.4 percent over the past seven years. Core PCE inflation over the past 12 months was just 1.3 percent. And inflation according to the total PCE Price Index — which does include food and energy prices — was just 0.2 percent over the past year.
Most FOMC participants expect inflation to rise steadily from these low levels, coming in just a shade under the Committee’s 2 percent target by the end of 2017. My own forecast is less sanguine. I expect core PCE inflation to undershoot 2 percent by a greater margin over the next two years than do my colleagues. I expect core PCE inflation to be just below 2 percent at the end of 2018.
...
How does this asymmetric assessment of risks to achieving the dual mandate goals influence my view of the most appropriate path for monetary policy over the next three years? It leads me to conclude that 1) a later liftoff and 2) a more gradual normalization of our monetary policy setting will best position the economy for the potential challenges ahead.
More specifically, before raising rates, I would like to have more confidence than I do today that inflation is indeed beginning to head higher. Given the current low level of core inflation, some evidence of true upward momentum in actual inflation is critical to this assessment. I believe that it could be well into next year before the headwinds from lower energy prices and the stronger dollar dissipate enough so that we begin to see some sustained upward movement in core inflation. After liftoff, I think it would be appropriate to raise the target interest rate very gradually. This would give us sufficient time to assess how the economy is adjusting to higher rates and the progress we are making toward our policy goals.
Overall, my view of appropriate policy is somewhat more accommodative than those held by the majority of my colleagues.
BLS: Jobs Openings increased to 5.5 million in September
by Calculated Risk on 11/12/2015 10:08:00 AM
From the BLS: Job Openings and Labor Turnover Summary
The number of job openings was little changed at 5.5 million on the last business day of September, the U.S. Bureau of Labor Statistics reported today. Hires and separations were little changed at 5.0 million and 4.8 million, respectively. Within separations, the quits rate was 1.9 percent for the sixth consecutive month, and the layoffs and discharges rate remained unchanged at 1.2 percent. ...The following graph shows job openings (yellow line), hires (dark blue), Layoff, Discharges and other (red column), and Quits (light blue column) from the JOLTS.
...
Quits are generally voluntary separations initiated by the employee. Therefore, the quits rate can serve as a measure of workers’ willingness or ability to leave jobs. ... There were 2.7 million quits in September, little changed from August. The number of quits has held between 2.7 million and 2.8 million for the past 13 months after increasing steadily since the end of the recession.
emphasis added
This series started in December 2000.
Note: The difference between JOLTS hires and separations is similar to the CES (payroll survey) net jobs headline numbers. This report is for September, the most recent employment report was for October.
 Click on graph for larger image.
Note that hires (dark blue) and total separations (red and light blue columns stacked) are pretty close each month. This is a measure of labor market turnover. When the blue line is above the two stacked columns, the economy is adding net jobs - when it is below the columns, the economy is losing jobs.
Jobs openings increased in September to 5.526 million from 5.377 million in August.
The number of job openings (yellow) are up 18% year-over-year compared to September 2014.
Quits are unchanged year-over-year. These are voluntary separations. (see light blue columns at bottom of graph for trend for "quits").
This is a solid report. Job openings are just below the record high set in July, although Quits have leveled off.
Weekly Initial Unemployment Claims unchanged at 276,000
by Calculated Risk on 11/12/2015 08:33:00 AM
The DOL reported:
In the week ending November 7, the advance figure for seasonally adjusted initial claims was 276,000, unchanged from the previous week's unrevised level. The 4-week moving average was 267,750, an increase of 5,000 from the previous week's unrevised average of 262,750.The previous week was unrevised at 276,000.
There were no special factors impacting this week's initial claims.
The following graph shows the 4-week moving average of weekly claims since 1971.
 Click on graph for larger image.
The dashed line on the graph is the current 4-week average. The four-week average of weekly unemployment claims increased to 267,750.
This was above the consensus forecast of 266,000, and the low level of the 4-week average suggests few layoffs.
Wednesday, November 11, 2015
Lawler: Post Mortem on Existing Home Sales in September
by Calculated Risk on 11/11/2015 08:32:00 PM
Thursday:
• At 8:30 AM ET, the initial weekly unemployment claims report will be released. The consensus is for 266 thousand initial claims, down from 276 thousand the previous week.
• At 10:00 AM, Job Openings and Labor Turnover Survey for September from the BLS. Jobs openings decreased in August to 5.370 million from 5.668 million in July. The number of job openings were up 9% year-over-year, and Quits were up 9% year-over-year.
• At 2:00 PM, the Monthly Treasury Budget Statement for October.
• At 6:00 PM, Speech by Fed Vice Chairman Stanley Fischer, The Transmission of Exchange Rate Changes to Output and Inflation, At the Conference on Monetary Policy Implementation and Transmission in the Post-Crisis Period, Washington, D.C.
From housing economist Tom Lawler:
In its latest Existing Home Sales Report released last month, the National Association of Realtors estimated that existing home sales ran at a seasonally adjusted annual rate of 5.55 million in September, way above consensus but very close to my estimate based on regional tracking of local realtor/MLS reports available prior to the NAR’s release. Since then several additional local realtor/MLS reports have been released, and based on all local realtor/MLS reports released for September it appears that if anything the NAR’s estimate of the YOY % increase in home sales for September was a bit low. The NAR’s estimate showed a YOY % increase in unadjusted sales of 8.0% for September, with YOY increases of 10.2% in the Northeast, 10.9% in the Midwest, 8.5% in the West, but only 5.5% in the South. Local realtor reports from the South, however, strongly suggest that home sales in that region grow by significantly more than 5.5% YOY. For the other regions, in contrast, the NAR estimates seem in line with local realtor reports.
Of course, this does not necessarily mean that the NAR will revise its September sales estimate higher in this month’s report. The NAR’s sample is based almost entirely from MLS reports from metropolitan areas, while where available I use state-wide realtor reports, and it is possible that the NAR’s sample was not representative of overall sales in the region. But there is a slightly better than even chance that the NAR will revise upward its estimate for home sales in the South for September.
In re October, I don’t yet have a large enough sample of reports to generate a national estimate, but incoming reports strongly suggest that the pace of existing home sales in October (seasonally adjusted) will be down significantly from September’s pace.
emphasis added


