 RSS Feed
 by Calculated Risk on 11/06/2015 08:30:00 AM
Friday, November 06, 2015
October Employment Report: 271,000 Jobs, 5.0% Unemployment Rate
From the BLS:
Total nonfarm payroll employment increased by 271,000 in October, and the unemployment rate was essentially unchanged at 5.0 percent, the U.S. Bureau of Labor Statistics reported today. Job gains occurred in professional and business services, health care, retail trade, food services and drinking places, and construction.
...
The change in total nonfarm payroll employment for August was revised from +136,000 to +153,000, and the change for September was revised from +142,000 to +137,000. With these revisions, employment gains in August and September combined were 12,000 more than previously reported.
...
In October, average hourly earnings for all employees on private nonfarm payrolls rose by 9 cents to $25.20, following little change in September (+1 cent). Hourly earnings have risen by 2.5 percent over the year.
emphasis added
 Click on graph for larger image.
The first graph shows the monthly change in payroll jobs, ex-Census (meaning the impact of the decennial Census temporary hires and layoffs is removed - mostly in 2010 - to show the underlying payroll changes).
Total payrolls increased by 271 thousand in October (private payrolls increased 268 thousand).
Payrolls for August and September were revised up by a combined 12 thousand.
 This graph shows the year-over-year change in total non-farm employment since 1968.
In October, the year-over-year change was 2.81 million jobs.
That is a solid year-over-year gain.
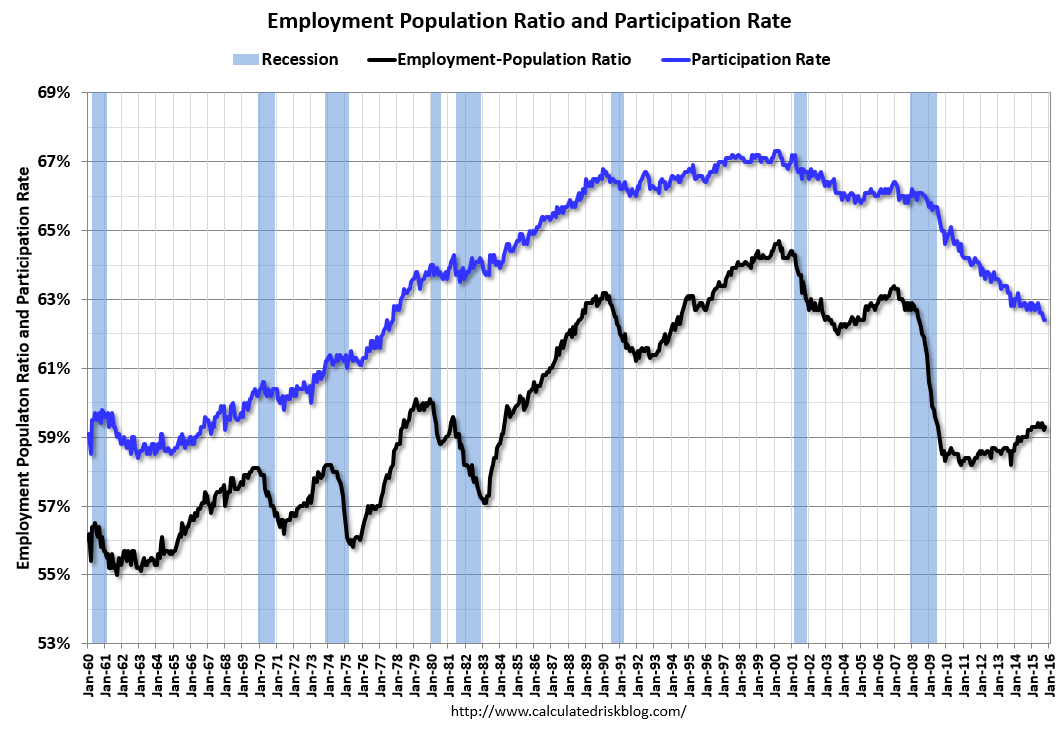 The third graph shows the employment population ratio and the participation rate.
The Labor Force Participation Rate was unchanged in October at 62.4%. This is the percentage of the working age population in the labor force. A large portion of the recent decline in the participation rate is due to demographics.
The Employment-Population ratio increased to 59.3% (black line).
I'll post the 25 to 54 age group employment-population ratio graph later.
 The fourth graph shows the unemployment rate.
 The unemployment rate declined in October to 5.0%.
This was well above expectations of 190,000 jobs, and revisions were up, and there was a pick up in wage growth ... a strong report.
I'll have much more later ...
Thursday, November 05, 2015
Friday: Jobs, Jobs, Jobs
by Calculated Risk on 11/05/2015 07:17:00 PM
Everyone will be looking at job creation, the unemployment rate and wages in the October employment report. Two other keys will be seasonal retail hiring in October, and revisions to prior months.
For several years, back revisions tended to be positive in the October report, but the upward revisions have been getting smaller. Here are the two-month revisions released in the last six October employment reports:
2009: Total +91,000 "The change in total nonfarm payroll employment for August was revised from -201,000 to -154,000, and the change for September was revised from -263,000 to -219,000."
2010: Total +110,000 "The change in total nonfarm payroll employment for August was revised from -57,000 to -1,000, and the change for September was revised from -95,000 to -41,000."
2011: Total +98,000 "The change in total nonfarm payroll employment for August was revised from +57,000 to +104,000, and the change for September was revised from +103,000 to +158,000."
2012: Total +84,000 "The change in total nonfarm payroll employment for August was revised from +142,000 to +192,000, and the change for September was revised from +114,000 to +148,000."
2013: Total +60,000 "The change in total nonfarm payroll employment for August was revised from +193,000 to +238,000, and the change for September was revised from +148,000 to +163,000."
2014: Total +31,000 "The change in total nonfarm payroll employment for August was revised from +180,000 to +203,000, and the change for September was revised from +248,000 to +256,000."
Friday:
• At 8:30 AM ET, the Employment Report for October. The consensus is for an increase of 190,000 non-farm payroll jobs added in October, up from the 142,000 non-farm payroll jobs added in September. The consensus is for the unemployment rate to decrease to 5.0%.
• At 3:00 PM, Consumer Credit for September from the Federal Reserve. The consensus is consumer credit increased by $18.0 billion in September.
Fannie: REO inventory declined in Q3, Down 34% Year-over-year
by Calculated Risk on 11/05/2015 03:59:00 PM
The continued decrease in the number of our seriously delinquent single-family loans has resulted in a reduction in the number of REO acquisitions in the first nine months of 2015 as compared with the first nine months of 2014.Fannie is unable to currently market about 40% of their inventory (see table 32 on page 62 for status).
We continue to manage our REO inventory to appropriately manage costs and maximize sales proceeds. However, we are unable to market and sell a large portion of our inventory, primarily due to occupancy and state or local redemption or confirmation periods, which extends the amount of time it takes to bring our properties to a marketable state and eventually dispose of them. This results in higher foreclosed property expenses, which include costs related to maintaining the property and ensuring that the property is vacant. Before we market our foreclosed properties, we may choose to repair them in order to maximize the sales price and increase the likelihood that an owner occupant will purchase. In some cases, we engage in third party sales at foreclosure, which allow us to avoid maintenance and other REO expenses we would have incurred had we acquired the property.
emphasis added
Fannie and Freddie are still working through the backlog of loans made during the housing bubble, mostly in judicial foreclosure states.
 Click on graph for larger image.
Here is a graph of Fannie and Freddie Real Estate Owned (REO).
REO inventory decreased in Q3 for both Fannie and Freddie, and combined inventory is down 35% year-over-year. For Freddie, this is the lowest level of REO since Q4 2007. For Fannie, this is the lowest level since Q2 2008.
Short term delinquencies are at normal levels, but there are still a number of properties in the foreclosure process with long time lines in judicial foreclosure states.
Hotels: The modest impact of Airbnb
by Calculated Risk on 11/05/2015 01:41:00 PM
Hotels are on pace for the best year ever in terms of occupancy, even with competition from online sharing sites like Airbnb. Here is an article from HotelNewsNow: NYC hoteliers report modest Airbnb impact
The report, titled “Airbnb and impacts on the New York City lodging market and economy” and conducted by HVS Consulting and Valuation for the Hotel Association of New York City, breaks down losses to the New York City hotel industry and local economy attributable to Airbnb specifically. The study results showed losses of $451 million in direct revenue; $136 million in ancillary losses, such as food and beverage; construction losses of $1 billion; indirect effects of $102 million; induced effects of $115 million and $227 million in taxes.So far the impact has been modest and most hotels in the U.S. are seeing record occupancy (see below).
The $451 million in lost hotel revenue assumes all Airbnb customers would have otherwise booked a hotel room. ...
Hoteliers interviewed by HNN for this article did not comment directly on HVS’ findings. But by and large, hoteliers agreed they aren’t necessarily feeling the same effects as outlined in the HVS analysis when it comes to loss of rate and occupancy.
The key reasons for record occupancy are travel is up significantly, and there were few new hotels built following the financial crisis (limited inventory growth). However, lodging investment is up 39% year-over-year, and there will be new hotels coming.
My guess is the CRUNCH for online sharing will come when there are more hotels, and when the economy slows down again. I suspect the online sharing sites will come under serious pressure from both hoteliers and local tax collecting agencies when the occupancy rate starts to decline (in addition to neighbor complaints). But for now it is good times for all.
And here is weekly update on hotel occupancy from HotelNewsNow.com: STR: US results for week ending 31 October
The U.S. hotel industry recorded positive results in the three key performance measurements during the week of 25-31 October 2015, according to data from STR, Inc.The following graph shows the seasonal pattern for the hotel occupancy rate using the four week average. Hotels are now in the Fall business travel season.
In year-over-year measurements, the industry’s occupancy increased 1.2% to 62.3%. Average daily rate for the week was up 5.1% to US$120.46. Revenue per available room increased 6.4% to finish the week at US$75.06.
emphasis added
 The red line is for 2015, dashed orange is 2014, blue is the median, and black is for 2009 - the worst year since the Great Depression for hotels. Purple is for 2000.
I added 2001 (yellow) to show the impact of 9/11/2001 on hotel occupancy. Occupancy was already down in 2001 due to the recession, and really collapsed following 9/11.
For 2015, the 4-week average of the occupancy rate is solidly above the median for 2000-2007, and above last year.
Right now 2015 is above 2000 (best year for hotels), and 2015 will probably be the best year ever for hotels.
Occupancy Year-to-date:
1) 2015 67.6%
2) 2000 67.0%
3) 2014 66.4%
Data Source: Smith Travel Research, Courtesy of HotelNewsNow.com
NFP: Goldman Employment Preview
by Calculated Risk on 11/05/2015 10:42:00 AM
Yesterday I discussed several employment indicators: Preview: Employment Report for October
Here are some excerpts from a research piece by Goldman Sachs economist Chris Mischaikow:
Based on better-than-expected labor market data this week, we have revised up our forecast for October nonfarm payroll growth to 190k from 175k previously.
...
Our baseline expectation is for the unemployment rate to remain at 5.1%. The labor force participation rate (LFPR) declined by two-tenths in September, and we expect a modest rebound from this larger-than-usual decline. ... However, this remains a close call given that the unemployment rate is currently at 5.051% on an unrounded basis.
We forecast average hourly earnings (AHE) for all employees to increase 0.3%. ... we think that the year-on-year change in all-employee AHE will increase to 2.3%. This would mark the fastest year-over-year pace of growth on an unrounded basis in AHE since October 2009.
Weekly Initial Unemployment Claims increased to 276,000
by Calculated Risk on 11/05/2015 08:34:00 AM
The DOL reported:
In the week ending October 31, the advance figure for seasonally adjusted initial claims was 276,000, an increase of 16,000 from the previous week's unrevised level of 260,000. The 4-week moving average was 262,750, an increase of 3,500 from the previous week's unrevised average of 259,250.The previous week was unrevised at 260,000.
There were no special factors impacting this week's initial claims.
The following graph shows the 4-week moving average of weekly claims since 1971.
 Click on graph for larger image.
The dashed line on the graph is the current 4-week average. The four-week average of weekly unemployment claims increased to 262,750.
This was above the consensus forecast of 262,000, and the low level of the 4-week average suggests few layoffs.
Wednesday, November 04, 2015
FOMC's Yellen, Dudley: December Meeting is "Live"
by Calculated Risk on 11/04/2015 08:13:00 PM
Thursday:
• At 8:30 AM ET, the initial weekly unemployment claims report will be released. The consensus is for 262 thousand initial claims, up from 260 thousand the previous week.
From Binyamin Appelbaum at the NY Times: Yellen Signals a Fed Tilt Toward December Rate Increase
“At this point, I see the U.S. economy as performing well,” [Fed Chair Janet Yellen] said, noting the strength of domestic spending. Volatility in global financial markets has also diminished, and the recent deal to raise the federal debt ceiling averted a fiscal showdown, removing two threats to continued growth. If the good news continues, she said, “December would be a live possibility.”From Reuters: Dudley,Yellen concur: December in play for rate hike
New York Fed President William Dudley, addressing reporters, said he would "completely agree" with Fed Chair Janet Yellen who had earlier said December is in play for a policy tightening if the economic data points to further improvement in the labor market and to a rebound in inflation.
Mortgage News Daily: Mortgage Rates up to 4%
by Calculated Risk on 11/04/2015 06:01:00 PM
From Matthew Graham at Mortgage News Daily: Mortgage Rates Back to 4 Percent After Yellen
Mortgage rates maintained their upward momentum today, rising to the highest levels since late September after Janet Yellen confirmed the Fed's rate hike outlook. Bond markets (which include the mortgage-backed securities that most directly affect mortgage rates) began adjusting for that outlook last week after the Fed announcement. Markets saw a roughly 1 in 3 chance of a December rate hike before that announcement, and better than 50 percent afterward.Here is a table from Mortgage News Daily:
[In testimony today] Yellen confirmed the shift in tone represented by last week's official announcement. Bottom line: the Fed looks pretty serious about hiking in December. That confirmation was worth a bit of extra pain for bond markets, hence the move higher in mortgage rates. The average lender is now back to 4.0% on conventional 30yr fixed quotes, with only the aggressive few offering anything in the high 3's.
Preview: Employment Report for October
by Calculated Risk on 11/04/2015 02:01:00 PM
On Friday at 8:30 AM ET, the BLS will release the employment report for October. The consensus, according to Bloomberg, is for an increase of 190,000 non-farm payroll jobs in October (with a range of estimates between 150,000 to 240,000), and for the unemployment rate to decline to 5.0%.
The BLS reported 142,000 jobs added in September.
Here is a summary of recent data:
• The ADP employment report showed an increase of 182,000 private sector payroll jobs in October. This was close to expectations of 185,000 private sector payroll jobs added. The ADP report hasn't been very useful in predicting the BLS report for any one month, but in general, this suggests employment growth close to expectations.
• The ISM manufacturing employment index decreased in October to 47.6%. A historical correlation between the ISM manufacturing employment index and the BLS employment report for manufacturing, suggests that private sector BLS manufacturing payroll jobs decreased about 30,000 in October. The ADP report indicated a 2,000 decrease for manufacturing jobs.
The ISM non-manufacturing employment index increased in September to 59.2%. A historical correlation between the ISM non-manufacturing employment index and the BLS employment report for non-manufacturing, suggests that private sector BLS non-manufacturing payroll jobs increased about 320,000 in September. However, the correlation is weaker when the index is this strong!
Combined, the ISM indexes suggests employment gains of 290,000. This suggests employment well above expectations.
• Initial weekly unemployment claims averaged close to 260,000 in October, down from 271,000 in September. This is the lowest since 1973. For the BLS reference week (includes the 12th of the month), initial claims were at 259,000, down from 264,000 during the reference week in September.
The decrease during the reference suggests a lower level of layoffs in October (or easier to find jobs, so some people don't file for unemployment claims).
• The final October University of Michigan consumer sentiment index increased to 90.0 from the September reading of 87.2. Sentiment is frequently coincident with changes in the labor market, but there are other factors too - like gasoline prices.
• On small business hiring: The small business index from Intuit showed a small increase in small business employment in October. From Intuit: Small Business Employment Remained Stagnant in October
In October, although the overall small business hiring rate increased to 5.3 percent – the highest level since the recession recovery began – net hiring remained stagnant.• Trim Tabs reported that the U.S. economy added 178,000 jobs in October, up from their estimate of 149,000 jobs in September. Note: "TrimTabs’ employment estimates are based on analysis of daily income tax deposits to the U.S. Treasury from the paychecks of the 142 million U.S. workers subject to withholding."
“The employment decline in the recent months adds up to a jobs loss of 4,000 since July 2015, a small number compared to the 20.6 million people employed by small businesses, “said Susan Woodward the economist who works with Intuit to produce the indexes. “With a high hiring rate but no net hires, the hiring rate of 5.3 percent is all turnover – firms replacing people who quit or were fired.”
The monthly hours worked by small business employees increased significantly – a total of 45 minutes, to 113.1 hours.
“Hours worked is at the highest level we’ve seen since we began reporting this data in 2004, far outside of normal. I expect that businesses will soon hire new people and reduce hours for existing employees, pushing ‘hours worked’ back to its normal level,” Woodward said.
• Conclusion: Unfortunately none of the indicators above is very good at predicting the initial BLS employment report. The ISM non-manufacturing index and unemployment claims suggest an above consensus report. However Trim Tabs, ADP and Intuit suggests at an or below consensus report.
My guess is the consensus will be close.
ISM Non-Manufacturing Index increased to 59.1% in October
by Calculated Risk on 11/04/2015 10:05:00 AM
The October ISM Non-manufacturing index was at 59.1%, up from 56.9% in September. The employment index increased in October to 59.2%, up from 58.3% in September. Note: Above 50 indicates expansion, below 50 contraction.
From the Institute for Supply Management: October 2015 Non-Manufacturing ISM Report On Business®
Economic activity in the non-manufacturing sector grew in October for the 69th consecutive month, say the nation’s purchasing and supply executives in the latest Non-Manufacturing ISM® Report On Business®.
The report was issued today by Anthony Nieves, CPSM, C.P.M., CFPM, chair of the Institute for Supply Management® (ISM®) Non-Manufacturing Business Survey Committee. "The NMI® registered 59.1 percent in October, 2.2 percentage points higher than the September reading of 56.9 percent. This represents continued growth in the non-manufacturing sector at a faster rate. The Non-Manufacturing Business Activity Index increased to 63 percent, which is 2.8 percentage points higher than the September reading of 60.2 percent, reflecting growth for the 75th consecutive month at a faster rate. The New Orders Index registered 62 percent, 5.3 percentage points higher than the reading of 56.7 percent in September. The Employment Index increased 0.9 percentage point to 59.2 percent from the September reading of 58.3 percent and indicates growth for the 20th consecutive month. The Prices Index increased 0.7 percentage point from the September reading of 48.4 percent to 49.1 percent, indicating prices decreased in October for the second consecutive month. According to the NMI®, 14 non-manufacturing industries reported growth in October. After the slight cooling off in September, the non-manufacturing sector reflected growth across most of the indexes. Respondents remain mostly positive about business conditions and the overall economy."
emphasis added
 Click on graph for larger image.
This graph shows the ISM non-manufacturing index (started in January 2008) and the ISM non-manufacturing employment diffusion index.
This was well above the consensus forecast of 56.7% and suggests faster expansion in October than in September. A strong report.


