 RSS Feed
 by Calculated Risk on 4/27/2015 06:21:00 PM
Monday, April 27, 2015
Freddie Mac: Mortgage Serious Delinquency rate declined in March
Freddie Mac reported that the Single-Family serious delinquency rate declined in March to 1.73%, down from 1.81% in February. Freddie's rate is down from 2.20% in March 2014, and the rate in March was the lowest level since December 2008.
Freddie's serious delinquency rate peaked in February 2010 at 4.20%.
These are mortgage loans that are "three monthly payments or more past due or in foreclosure".
Note: Fannie Mae will report their Single-Family Serious Delinquency rate for March in a few days.
 Click on graph for larger image
Although the rate is declining, the "normal" serious delinquency rate is under 1%.
The serious delinquency rate has fallen 0.47 percentage points over the last year - and the rate of improvement has slowed recently - but at that rate of improvement, the serious delinquency rate will not be below 1% until late 2016.
So even though distressed sales are declining, I expect an above normal level of Fannie and Freddie distressed sales through 2016 (mostly in judicial foreclosure states).
Merrill Lynch: FOMC Preview
by Calculated Risk on 4/27/2015 04:40:00 PM
The FOMC meeting starts tomorrow and the statement will be released Wednesday at 2:00 PM ET. No change in policy is expected.
Here is a preview from Merrill Lynch:
At the March FOMC meeting, the Fed took any policy changes in April off the table. We don’t expect similar language about June policy at the April meeting. We do expect a more somber description of recent activity. This dovish shift in the nearterm view should translate into significantly lower odds of a June rate hike in our view. But any market participants who seek an explicit signal that June also is off the table are likely to be disappointed: the FOMC will want to maintain as much policy flexibility as possible. Fed officials also should stay optimistic about reaching their dual mandate objectives over time. The minutes, released in three weeks’ time, are once again likely to be more informative about the state of the Fed debate.
Without a press conference or updated projections in April, the FOMC statement will be the focus. The main change is likely to be an acknowledgment of the broadly weaker data for consumption, manufacturing and the labor market in recent months. The Committee may suggest temporary factors (i.e., weather and the West Coast port shutdown) account for much of the 1Q slowdown and thus leave the mediumterm outlook unchanged. Meanwhile, the recent firming of core inflation measures may give the FOMC more confidence that downside inflation risks — which rose in the March SEP — have faded. As such, we look for no significant changes in the inflation outlook, although we continue to believe the Fed is under-estimating the persistence of global disinflationary forces.
The March statement dropped “patient,” which had been generally interpreted to mean no rate hikes for the current and subsequent meeting, in order to have more flexibility for setting policy at the June meeting and beyond. To make certain the markets didn’t misinterpret the change in guidance as a sign of imminent liftoff, the FOMC stated that an April rate hike remained “unlikely” and that dropping “patient” did not mean the FOMC had decided on the timing of liftoff. As these clarifications are no longer needed, we expect they will be dropped. The statement may add that the Fed anticipates a “gradual” normalization process, to complement existing language that economic conditions may warrant lower-than-normal policy rates for some time. We expect no changes to the reinvestment program.
Vehicle Sales Forecasts: Best April in "13 Years"
by Calculated Risk on 4/27/2015 01:11:00 PM
The automakers will report April vehicle sales on Friday, May 1st. Sales in March were at 17.05 million on a seasonally adjusted annual rate basis (SAAR), and it appears sales will be strong in April too. April sales (SA) will probably be the best since 2005.
Note: There were 26 selling days in April, the same as last year. Here are a couple of forecasts:
From WardsAuto: Forecast: April Daily Sales to Reach 13-Year High
A WardsAuto forecast calls for U.S. automakers to deliver 1.474 million light vehicles this month.From J.D. Power: New-Vehicle Sales in April Strongest for the Month in a Decade
The forecasted daily sales rate of 56,706 over 26 days represents a 6.7% improvement from like-2014 (also 26 days) and would mark the industry’s best April, on a daily basis, since 2002, as well as the highest April sales volume since 2000.
...
The report puts the seasonally adjusted annual rate of sales for the month at 16.8 million units, down from March’s 17.1 million SAAR, but some 800,000 units above year-ago and slightly ahead of the 16.8 million first-quarter SAAR.
Total light-vehicle sales are projected to reach 1,463,700, a 5 percent increase compared with April 2014 and the highest level for the month since April 2005 when 1,500,624 new vehicles were sold. [Total forecast 16.6 million SAAR]Another strong month for auto sales.
Dallas Fed: Texas Manufacturing Activity Weakens Again
by Calculated Risk on 4/27/2015 10:36:00 AM
From the Dallas Fed: Texas Manufacturing Activity Weakens Again
Texas factory activity declined in April, according to business executives responding to the Texas Manufacturing Outlook Survey. The production index, a key measure of state manufacturing conditions, posted a second negative reading in a row, coming in at -4.7.The last of the regional Fed surveys (Richmond Fed) will be released tomorrow. Three of the four surveys released so far have indicated contraction in April (especially Dallas due to lower oil prices).
Other measures of current manufacturing activity also reflected continued contraction in April. The new orders index edged up but remained negative at -14. The growth rate of orders index held steady at -15.5, posting its sixth consecutive negative reading.
...
Perceptions of broader business conditions remained quite pessimistic for a fourth month in a row. The general business activity index stayed negative but ticked up to -16 in April, while the company outlook index moved down to -7.8, reaching its lowest reading in nearly two and a half years.
Labor market indicators reflected slight employment gains but shorter workweeks. The April employment index rebounded to 1.8 after dipping below zero last month.
emphasis added
Black Knight: House Price Index up 0.7% in February, 4.6% year-over-year
by Calculated Risk on 4/27/2015 09:04:00 AM
Note: I follow several house price indexes (Case-Shiller, CoreLogic, Black Knight, Zillow, FHFA, FNC and more). Note: Black Knight uses the current month closings only (not a three month average like Case-Shiller or a weighted average like CoreLogic), excludes short sales and REOs, and is not seasonally adjusted.
From Black Knight: Black Knight Home Price Index Report: February Transactions – U.S. Home Prices Up 0.7 Percent for the Month; Up 4.6 Percent Year-Over-Year
Today, the Data and Analytics division of Black Knight Financial Services released its latest Home Price Index (HPI) report, based on February 2015 residential real estate transactions. The Black Knight HPI combines the company’s extensive property and loan-level databases to produce a repeat sales analysis of home prices as of their transaction dates every month for each of more than 18,500 U.S. ZIP codes. The Black Knight HPI represents the price of non-distressed sales by taking into account price discounts for REO and short sales.The Black Knight HPI increased 0.7% percent in February, and is off 9.5% from the peak in June 2006 (not adjusted for inflation).
For a more in-depth review of this month’s home price trends, including detailed looks at the 20 largest states and 40 largest metros, please download the full Black Knight HPI Report at http://www.bkfs.com/Data/DataReports/BKFS_HPI_Feb2015_Report.pdf
The year-over-year increase in the index has been about the same for the last six months.
The press release has data for the 20 largest states, and 40 MSAs.
Black Knight shows prices off 40.7% from the peak in Las Vegas, off 34.8% in Orlando, and 31.7% off from the peak in Riverside-San Bernardino, CA (Inland Empire). Prices are at new highs in Colorado, New York and Texas (Denver, Austin, Dallas, Houston) and several other cities around the country.
Note: Case-Shiller for February will be released tomorrow.
Sunday, April 26, 2015
Sunday Night Futures
by Calculated Risk on 4/26/2015 08:45:00 PM
From the Financial Times: Eurozone officials seek to bypass Varoufakis to spur Greek talks
A fraught eurozone meeting in Riga at the weekend has left Yanis Varoufakis, the Greek finance minister, increasingly isolated both in Brussels and in Athens as officials seek to bypass him in an effort to jump-start bailout talks.Time is getting short.
Excerpt with permission
Monday:
• 10:30 AM ET: Dallas Fed Manufacturing Survey for April.
Weekend:
• Schedule for Week of April 26, 2015
From CNBC: Pre-Market Data and Bloomberg futures: currently S&P futures and DOW futures are up slightly (fair value).
Oil prices were up over the last week with WTI futures at $57.36 per barrel and Brent at $65.28 per barrel. A year ago, WTI was at $102, and Brent was at $109 - so, even with the recent increases, prices are down over 40% year-over-year.
Below is a graph from Gasbuddy.com for nationwide gasoline prices. Nationally prices are up to $2.54 per gallon (down about $1.15 per gallon from a year ago).
If you click on "show crude oil prices", the graph displays oil prices for WTI, not Brent; gasoline prices in most of the U.S. are impacted more by Brent prices.
| Orange County Historical Gas Price Charts Provided by GasBuddy.com |
ATA Trucking Index increased in March
by Calculated Risk on 4/26/2015 09:20:00 AM
Here is an indicator that I follow on trucking, from the ATA: ATA Truck Tonnage Index Gained 1.1% in March
American Trucking Associations’ advanced seasonally adjusted For-Hire Truck Tonnage Index increased 1.1% in March, following a revised drop of 2.8% during the previous month. In March, the index equaled 133.5 (2000=100). The all-time high is 135.8, reached in January 2015.
Compared with March 2014, the SA index increased 5%, which was above the 3.3% gain in February but below January’s 6.7% year-over-year increase. During the first quarter, tonnage was unchanged from the previous quarter while increasing 5% from the same period in 2014. ...
“While tonnage did not fully recoup the loss from February, it increased nicely in March,” said ATA Chief Economist Bob Costello. “I’d say that tonnage was one of the better indicators for the month, which is a positive sign for the broader economy.”
Costello added that truck tonnage has increased in five of the last six months, but is off 1.7% from the high in January.
“The next couple of months will be telling for truck freight volumes as we enter the spring freight season,” he said.
Trucking serves as a barometer of the U.S. economy, representing 69.1% of tonnage carried by all modes of domestic freight transportation, including manufactured and retail goods. Trucks hauled 9.7 billion tons of freight in 2013. Motor carriers collected $681.7 billion, or 81.2% of total revenue earned by all transport modes.
emphasis added
 Click on graph for larger image.
Here is a long term graph that shows ATA's For-Hire Truck Tonnage index.
The dashed line is the current level of the index.
The index is now up 5.0% year-over-year.
Saturday, April 25, 2015
Schedule for Week of April 26, 2015
by Calculated Risk on 4/25/2015 01:15:00 PM
The key report this is week is Q1 GDP on Wednesday. Also the FOMC will meet on Tuesday and Wednesday, and release a statement on Wednesday.
Other key reports include the March Personal Income and Outlays report on Thursday, April ISM manufacturing index on Friday, April vehicle sales on Friday, and the Case-Shiller house prices on Tuesday.
10:30 AM: Dallas Fed Manufacturing Survey for April.
 9:00 AM: S&P/Case-Shiller House Price Index for February. Although this is the February report, it is really a 3 month average of December, January and February prices.
This graph shows the nominal seasonally adjusted National Index, Composite 10 and Composite 20 indexes through the January 2015 report (the Composite 20 was started in January 2000).
The consensus is for a 4.6% year-over-year increase in the National Index for February. The Zillow forecast is for the National Index to increase 4.5% year-over-year in February, and for prices to increase 0.5% month-to-month seasonally adjusted.
10:00 AM: Richmond Fed Survey of Manufacturing Activity for April.
10:00 AM: Conference Board's consumer confidence index for April. The consensus is for the index to increase to 102.5 from 101.3.
10:00 AM: Q1 Housing Vacancies and Homeownership report from the Census Bureau. This report is frequently mentioned by analysts and the media to report on the homeownership rate, and the homeowner and rental vacancy rates. However, this report doesn't track with other measures (like the decennial Census and the ACS).
7:00 AM: The Mortgage Bankers Association (MBA) will release the results for the mortgage purchase applications index.
8:30 AM: Gross Domestic Product, 1st quarter 2015 (advance estimate). The consensus is that real GDP increased 1.0% annualized in Q1.
10:00 AM: Pending Home Sales Index for March. The consensus is for a 1.0% increase in the index.
2:00 PM: FOMC Meeting Statement.
8:30 AM: The initial weekly unemployment claims report will be released. The consensus is for claims to decrease to 290 thousand from 295 thousand.
8:30 AM ET: Personal Income and Outlays for March. The consensus is for a 0.2% increase in personal income, and for a 0.5% increase in personal spending. And for the Core PCE price index to increase 0.2%.
9:45 AM: Chicago Purchasing Managers Index for April. The consensus is for a reading of 50.0, up from 46.3 in March.
 10:00 AM: ISM Manufacturing Index for April. The consensus is for an increase to 52.0 from 51.5 in March.
Here is a long term graph of the ISM manufacturing index.
The ISM manufacturing index indicated expansion at 51.5% in March. The employment index was at 50.0%, and the new orders index was at 51.8%.
10:00 AM: Construction Spending for March. The consensus is for a 0.5% increase in construction spending.
 All day: Light vehicle sales for April. The consensus is for light vehicle sales to decrease to 16.9 million SAAR in April from 17.05 million in March (Seasonally Adjusted Annual Rate).
This graph shows light vehicle sales since the BEA started keeping data in 1967. The dashed line is the March sales rate.
10:00 AM: University of Michigan's Consumer sentiment index (final for April). The consensus is for a reading of 96.0, up from the preliminary reading of 95.9, and up from the March reading of 93.0.
April 2015: Unofficial Problem Bank list declines to 342 Institutions
by Calculated Risk on 4/25/2015 08:15:00 AM
This is an unofficial list of Problem Banks compiled only from public sources.
Here is the unofficial problem bank list for April 2015.
Changes and comments from surferdude808:
Update on the Unofficial Problem Bank List for April 2015. During the month, the list fell from 349 institutions to 342 after nine removals and two additions. Assets dropped by $1.2 billion to an aggregate $105.1 billion. A year ago, the list held 513 institutions with assets of $167.3 billion.
Actions were terminated against Orrstown Bank, Shippensburg, PA ($1.2 billion Ticker: ORRF); Atlantic Coast Bank, Jacksonville, FL ($709 million Ticker: ACFC); The Leaders Bank, Oak Brook, IL ($353 million); PrimeSouth Bank, Blackshear, GA ($326 million); The Exchange Bank, Skiatook, OK ($87 million); and Community Savings, Caldwell, OH ($68 billion). Finding their way off the list through merger were Colonial Bank, FSB, Vineland, NJ ($542 million Ticker: COBK); Baytree National Bank & Trust Company, Lake Forest, IL ($77 million); and Bank Reale, Pasco, WA ($38 million Ticker: BKRL).
The two additions this month were Lone Star National Bank, Pharr, TX ($2.2 billion) and Covenant Bank, Leeds, AL ($76 million).
Friday, April 24, 2015
DOT: Vehicle Miles Driven increased 2.8% year-over-year in February, Rolling 12 Months at All Time High
by Calculated Risk on 4/24/2015 06:34:00 PM
Note: With lower gasoline prices, vehicle miles driven have reached a new high on a rolling 12 month basis.
The Department of Transportation (DOT) reported:
Travel on all roads and streets changed by 2.8% (6.1 billion vehicle miles) for February 2015 as compared with February 2014.The following graph shows the rolling 12 month total vehicle miles driven to remove the seasonal factors.
Travel for the month is estimated to be 221.1 billion vehicle miles
The seasonally adjusted vehicle miles traveled for February 2015 is 254.1 billion miles, a 2.6% (6.4 billion vehicle miles) increase over February 2014. It also represents a -1.2% change (-3.2 billion vehicle miles) compared with January 2015.
The rolling 12 month total is moving up, after moving sideways for several years.
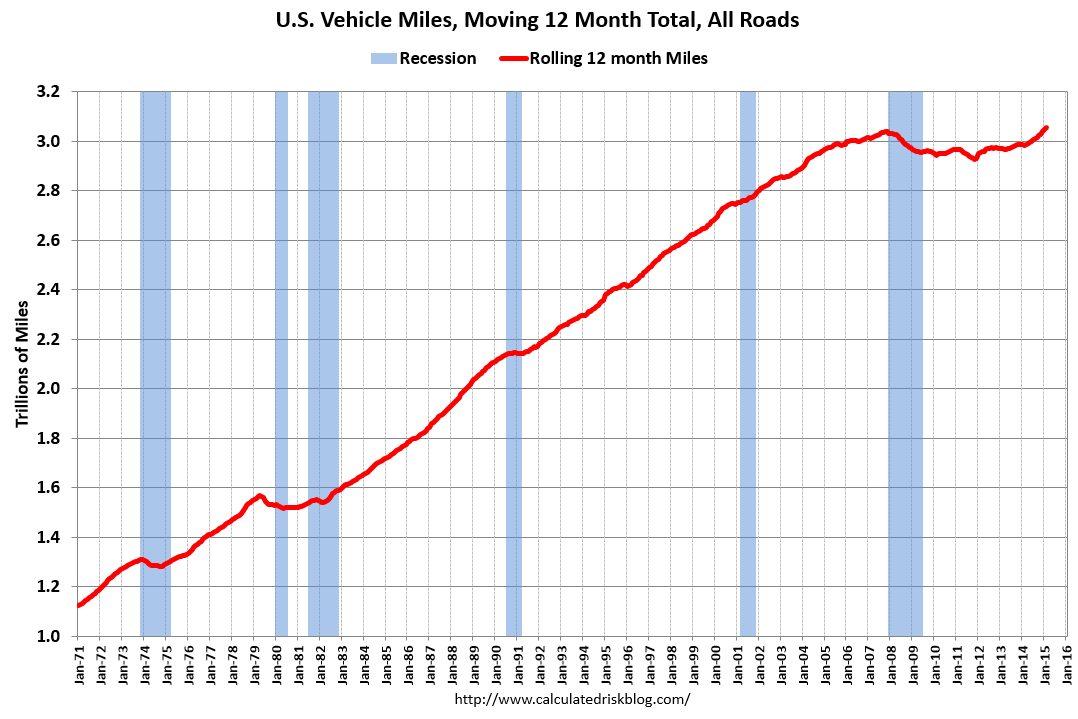 Click on graph for larger image.
In the early '80s, miles driven (rolling 12 months) stayed below the previous peak for 39 months.
Miles driven (rolling 12) had been below the previous peak for 85 months - an all time record - before reaching a new high for miles driven in January (and again in February).
The second graph shows the year-over-year change from the same month in the previous year.
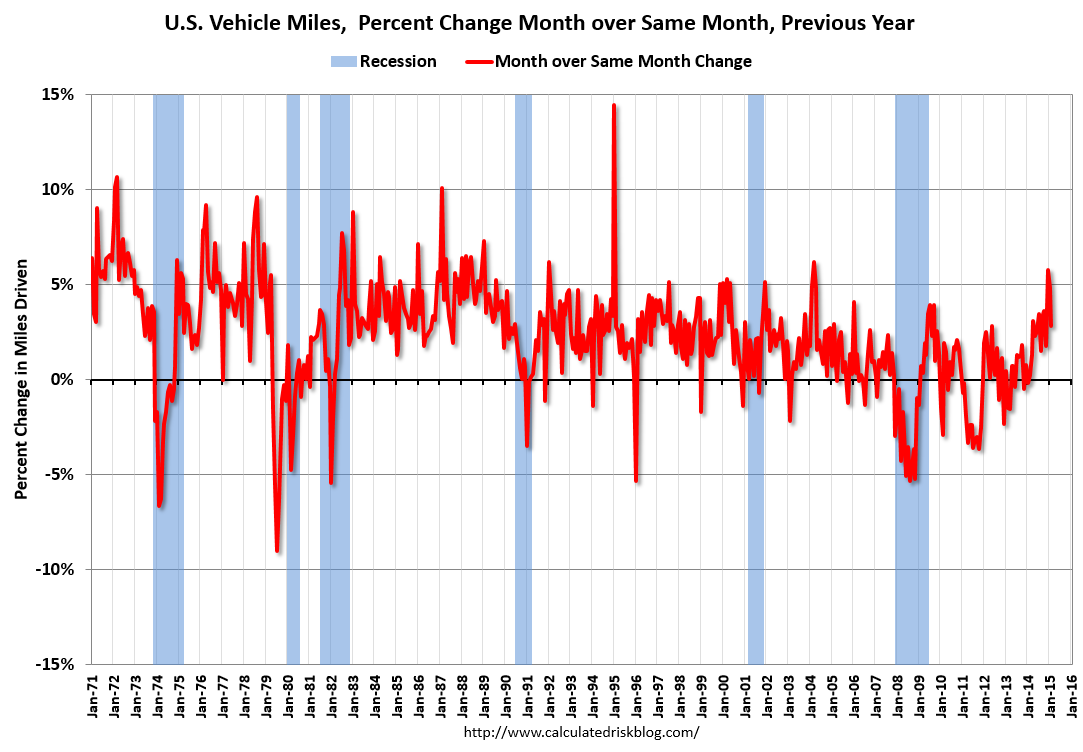 In February 2015, gasoline averaged of $2.30 per gallon according to the EIA. That was down significantly from January 2014 when prices averaged $3.43 per gallon.
 However gasoline prices are just part of the story. The lack of growth in miles driven over the last 7 years was probably also due to the lingering effects of the great recession (lack of wage growth), the aging of the overall population (over 55 drivers drive fewer miles) and changing driving habits of young drivers.
Now, miles driven - on a rolling 12 month basis - is at a new high.


