 RSS Feed
 by Calculated Risk on 11/15/2014 08:11:00 AM
Saturday, November 15, 2014
Lawler: Preliminary Table of Distressed Sales and Cash buyers for Selected Cities in October
Economist Tom Lawler sent me the table below of short sales, foreclosures and cash buyers for a few selected cities in October.
On distressed: Total "distressed" share is down in these markets mostly due to a decline in short sales.
Short sales are down significantly in these areas.
Foreclosures are up slightly in several of these areas.
The All Cash Share (last two columns) is mostly declining year-over-year. As investors pull back, the share of all cash buyers will probably continue to decline.
| Short Sales Share | Foreclosure Sales Share | Total "Distressed" Share | All Cash Share | |||||
|---|---|---|---|---|---|---|---|---|
| Oct-14 | Oct-13 | Oct-14 | Oct-13 | Oct-14 | Oct-13 | Oct-14 | Oct-13 | |
| Las Vegas | 10.6% | 21.0% | 8.9% | 6.0% | 19.5% | 27.0% | 35.1% | 44.9% |
| Reno** | 6.0% | 16.0% | 4.0% | 4.0% | 10.0% | 20.0% | ||
| Phoenix | 3.7% | 8.4% | 6.2% | 6.9% | 9.9% | 15.3% | 27.7% | 31.6% |
| Sacramento | 6.1% | 13.7% | 6.3% | 5.9% | 12.4% | 19.6% | 20.6% | 23.9% |
| Minneapolis | 2.7% | 5.1% | 9.8% | 16.4% | 12.5% | 21.5% | ||
| Mid-Atlantic | 4.8% | 8.2% | 10.0% | 7.9% | 14.9% | 16.1% | 19.2% | 19.9% |
| California * | 6.1% | 10.3% | 5.3% | 6.7% | 11.4% | 17.0% | ||
| Bay Area CA* | 3.5% | 7.3% | 2.7% | 3.7% | 6.2% | 11.0% | ||
| So. California* | 5.9% | 10.8% | 4.8% | 6.3% | 10.7% | 17.1% | ||
| Hampton Roads | 19.7% | 25.5% | ||||||
| Northeast Florida | 30.0% | 38.2% | ||||||
| Toledo | 38.2% | 37.1% | ||||||
| Tucson | 26.8% | 32.1% | ||||||
| Des Moines | 18.8% | 20.2% | ||||||
| Peoria | 22.8% | 21.1% | ||||||
| Georgia*** | 27.8% | N/A | ||||||
| Pensacola | 33.5% | 33.7% | ||||||
| Memphis* | 13.3% | 19.8% | ||||||
| Birmingham AL | 15.2% | 21.0% | ||||||
| *share of existing home sales, based on property records **Single Family Only ***GAMLS | ||||||||
Friday, November 14, 2014
Lawler: Early Read on Existing Home Sales in October
by Calculated Risk on 11/14/2014 04:22:00 PM
From housing economist Tom Lawler:
Based on local realtor/MLS reports from across the country released so far this month, I estimate that US existing home sales as measured by the National Association of Realtors ran at a seasonally adjusted annual rate of 5.28 million, up 2.1% from September’s pace and up 2.9% from last October’s pace. My “best guess” is that the NAR’s estimate for the number of existing homes for sale at the end October will be down about 3% from September and up about 5.7% from last October. Finally, I “guesstimate” that the NAR’s estimate for the median existing SF home sales price in October will be up by about 4.4% from last October.
A few notes: first, not all realtor/MLS reports define “inventory” in the same way, and some of the publicly-released reports differ from reports sent to the NAR. These differences have made my NAR inventory estimates less reliable than my sales estimates. Second, lately the NAR median existing SF home sales prices have shown faster YOY growth than local realtor/MLS reports would have suggested, and in September the YOY increase in the median sales price in the Northeast was WAY higher than state realtor report would have indicated. I don’t know why.
I’ll update my estimate next week if newly-released realtor/MLS reports warrant an update.
CR Note: the NAR is scheduled to release October existing home sales next Thursday, The consensus is the NAR will report sales at a 5.10 million SAAR (the consensus will move up once this is posted!)
MBA National Delinquency Survey: Judicial vs. Non-Judicial Foreclosure States in Q3 2014
by Calculated Risk on 11/14/2014 02:13:00 PM
Earlier I posted the MBA National Delinquency Survey press release and a graph that showed mortgage delinquencies and foreclosures by period past due. There is a clear downward trend for mortgage delinquencies, however some states are further along than others. From the press release:
“On an aggregated basis, both judicial and non-judicial states saw decreases in loans in foreclosure, although the judicial states continue to have a combined foreclosure inventory rate that is around three times that of non-judicial states. New Jersey continues to lead the nation in loans in foreclosure, although it saw another decrease from the previous quarter. Florida, once with the highest percentage of loans in foreclosure, experienced a significant decrease in the third quarter. The foreclosure inventory in Florida has declined steadily for over two years now, and the percentage of loans in foreclosure is currently less than half of its peak in 2011. State level trends continue to be driven by local economic factors and state law. For example, a change in DC foreclosure mediation requirements was the likely cause of a shift of loans from the 90 days or more past due status to having the foreclosure process initiated,” [Mike Fratantoni, MBA’s chief economist] said.
 Click on graph for larger image.
This graph is from the MBA and shows the percent of loans in the foreclosure process by state. Posted with permission. Blue is for judicial foreclosure states, and red for non-judicial foreclosure states.
The top states are New Jersey (7.96% in foreclosure, down from 8.10% in Q2), Florida (6.12%, down from 6.81%), New York (5.72%, down from 5.89%), and Maine (4.29% down from 4.51%). Nevada is the only non-judicial state in the top 10, and this is partially due to state laws that slow foreclosures (D.C added some new foreclosure mediation requirements).
Former bubble states California (1.05% down from 1.10%) and Arizona (0.85%, unchanged from Q2) are now far below the national average by every measure.
 For judicial foreclosure states, it appears foreclosure inventory peaked in Q2 2012 (foreclosure inventory is the number of mortgages in the foreclosure process). Foreclosure inventory in the judicial states has declined for nine consecutive quarters. This was three years after the peak in foreclosure inventories for non-judicial states.
It looks like the judicial states will have a significant number of distressed sales for a couple more years - however the non-judicial states are closer to normal levels.
MBA: Mortgage Delinquency and Foreclosure Rates Decrease in Q3, Lowest since 2007
by Calculated Risk on 11/14/2014 10:05:00 AM
From the MBA: Mortgage Delinquencies Continue to Decrease in Third Quarter
The delinquency rate for mortgage loans on one-to-four-unit residential properties decreased to a seasonally adjusted rate of 5.85 percent of all loans outstanding at the end of the third quarter of 2014. The delinquency rate decreased for the sixth consecutive quarter and reached the lowest level since the fourth quarter of 2007. The delinquency rate decreased 19 basis points from the previous quarter, and 56 basis points from one year ago, according to the Mortgage Bankers Association’s (MBA) National Delinquency Survey.
The delinquency rate includes loans that are at least one payment past due but does not include loans in the process of foreclosure. The percentage of loans in the foreclosure process at the end of the third quarter was 2.39 percent, down 10 basis points from the second quarter and 69 basis points lower than one year ago. This was the lowest foreclosure inventory rate seen since the fourth quarter of 2007.
...
“Delinquency rates and the percentage of loans in foreclosure fell to their lowest levels since 2007,” said Mike Fratantoni, MBA’s chief economist. “We are now back to pre-crisis levels for most measures. Foreclosure starts were unchanged on a seasonally adjusted basis, but increased slightly in the raw data. Given that this measure reached the lowest level in eight years last quarter, and given the continued decline in delinquency and foreclosure inventory rates, we expect that the increase in the unadjusted starts rate is just regular seasonal fluctuation.”
...
“On an aggregated basis, both judicial and non-judicial states saw decreases in loans in foreclosure, although the judicial states continue to have a combined foreclosure inventory rate that is around three times that of non-judicial states. New Jersey continues to lead the nation in loans in foreclosure, although it saw another decrease from the previous quarter. Florida, once with the highest percentage of loans in foreclosure, experienced a significant decrease in the third quarter."
emphasis added
 Click on graph for larger image.
This graph shows the percent of loans delinquent by days past due.
The percent of loans 30 days and 60 days delinquent are back to normal levels.
The 90 day bucket peaked in Q1 2010, and is more than two-thirds of the way back to normal.
The percent of loans in the foreclosure process also peaked in 2010 and is two-thirds of the way back to normal.
So it has taken about 4 years to reduce the backlog of seriously delinquent and in-foreclosure loans by two-thirds, so a rough guess is that serious delinquencies and foreclosure inventory will be back to normal in a couple more years. Most other measures are already back to normal (still working through the backlog).
Preliminary November Consumer Sentiment increases to 89.4
by Calculated Risk on 11/14/2014 09:55:00 AM
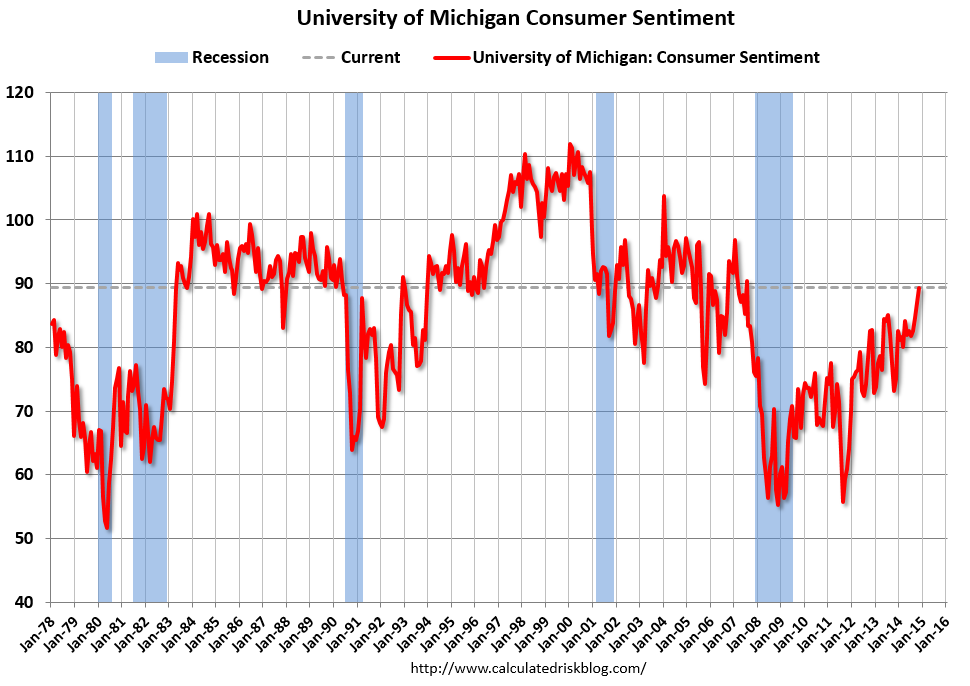
Click on graph for larger image.
The preliminary Reuters / University of Michigan consumer sentiment index for November was at 89.4, up from 86.9 in October.
This was above the consensus forecast of 87.5 and is at the highest level since 2007.
Retail Sales increased 0.3% in October
by Calculated Risk on 11/14/2014 08:43:00 AM
On a monthly basis, retail sales decreased 0.3% from September to October (seasonally adjusted), and sales were up 4.1% from October 2013. Sales in September were unrevised at a 0.3% decrease.
From the Census Bureau report:
The U.S. Census Bureau announced today that advance estimates of U.S. retail and food services sales for October, adjusted for seasonal variation and holiday and trading-day differences, but not for price changes, were $444.5 billion, an increase of 0.3 percent from the previous month, and 4.1 percent above October 2013. ... The August to September 2014 percent change was unrevised from -0.3%.
 Click on graph for larger image.
This graph shows retail sales since 1992. This is monthly retail sales and food service, seasonally adjusted (total and ex-gasoline).
Retail sales ex-gasoline increase 0.5%.
Retail sales ex-autos increased 0.3%.
The second graph shows the year-over-year change in retail sales and food service (ex-gasoline) since 1993.
 Retail sales ex-gasoline increased by 5.1% on a YoY basis (4.1% for all retail sales).
The increase in October was above consensus expectations of a 0.2% increase.
Overall this was a solid report.
Thursday, November 13, 2014
Friday: Retail Sales, Consumer Sentiment, Q3 National Mortgage Delinquency Survey
by Calculated Risk on 11/13/2014 07:01:00 PM
One of the keys in the retail sales report will be sales ex-gasoline. From the WSJ: On Your Shopping List: Three Things to Watch in the Retail Sales Report
[C]onsider retail performance excluding gasoline stations. Retail sales are reported nominally and gas prices have plummeted since June. That means a clearer picture of the consumer sector will come from looking at retail sales excluding gas stations.Friday:
There are two reasons for that. The first is obvious: If gas sales are falling, sales excluding gas are doing better than total sales.
The second reason is that cheaper gas frees up money that can be spent elsewhere. If nongas sales don’t post a solid gain in October, consumers may be saving that extra money.
• At 8:30 AM ET, Retail sales for October will be released. The consensus is for retail sales to increase 0.2% in October, and to increase 0.2% ex-autos.
• At 9:55 AM, the Reuter's/University of Michigan's Consumer sentiment index (preliminary for November). The consensus is for a reading of 87.5, up from 86.9 in October.
• At 10:00 AM, the Mortgage Bankers Association (MBA) Q3 2014 National Delinquency Survey (NDS).
• Also at 10:00 AM, the Manufacturing and Trade: Inventories and Sales (business inventories) report for September. The consensus is for a 0.3% increase in inventories.
Freddie Mac: "Fixed Mortgage Rates Hovering Near 2014 Lows"
by Calculated Risk on 11/13/2014 05:03:00 PM
From Freddie Mac: Fixed Mortgage Rates Hovering Near 2014 Lows
Freddie Mac today released the results of its Primary Mortgage Market Survey® (PMMS®), showing average fixed mortgage rates little changed from the previous week with the 30-year mortgage still hovering around 4 percent.
30-year fixed-rate mortgage (FRM) averaged 4.01 percent with an average 0.5 point for the week ending November 13, 2014, down from last week when it averaged 4.02 percent. A year ago at this time, the 30-year FRM averaged 4.35 percent.
 Click on graph for larger image.
Here is a graph of 30 year fixed mortgage rates - according to the PMMS® - for 2010 through 2014 (red).
Mortgage rates are lower this year than last year (blue), and at about the same level as in 2011.
Note: Looking at daily rates from Mortgage News Daily, 30 year rates are at 4.05% today, down from 4.46% one year ago. The MND data is based on actual lender rate sheets, and is mostly "the average no-point, no-origination rate for top-tier borrowers with flawless scenarios". (this tracks the Freddie Mac series very well).
DataQuick on California Bay Area: Home Sales increased slightly in October, Few Distressed Sales
by Calculated Risk on 11/13/2014 02:14:00 PM
From DataQuick: San Francisco Bay Area Home Sales Edge Higher; Price Growth Ratchets Down Again
The Bay Area housing market posted another modest uptick in sales during October but activity remained below average as cash purchases continued to taper off and buyers faced a limited inventory as well as affordability and mortgage availability challenges. Home prices appear to have plateaued in recent months, although the October median sale price was still about 11 percent higher than a year earlier.A few key year-over-year trends: 1) declining distressed sales (can't decline much further!), 2) generally declining investor buying, 3) mostly flat total sales (up 1.3% year-over-year in October), 4) an increase in non-distressed sales.
A total of 7,693 new and resale houses and condos sold in the nine-county San Francisco Bay Area in October 2014. That was up 3.4 percent from 7,443 in September and up 1.3 percent from 7,595 in October 2013, according to CoreLogic DataQuick data..
A small gain in sales from September to October is normal for the season. The October sales count was the highest for that month since 7,902 homes sold in October 2012. October sales have ranged from a low of 5,486 in 2007 to a high of 13,392 in 2003. October 2014 sales were 9.7 percent below the October average of 8,521 sales since 1988, when CoreLogic DataQuick’s data began.
...
“After hitting what many view as a stratospheric level, Bay Area home prices have shown signs of leveling off,” said Andrew LePage, data analyst for CoreLogic DataQuick. “To some extent it’s the result of sticker shock and a modest pickup in inventory."
...
Foreclosure resales accounted for 2.7 percent of resales in October, down from a revised 2.8 percent the month before, and down from 3.7 percent a year ago. Foreclosure resales in the Bay Area peaked at 52.0 percent in February 2009, while the monthly average since 1995 is 9.7 percent. Foreclosure resales are homes that had been foreclosed on in the prior 12 months.
Short sales – transactions where the sale price fell short of what was owed on the property – made up an estimated 3.5 percent of Bay Area resales in October. That was down from an estimated 3.8 percent in September and down from 7.3 percent in October 2013.
emphasis added
Hotels: Occupancy Rate Finishing 2014 Strong
by Calculated Risk on 11/13/2014 12:27:00 PM
From HotelNewsNow.com: STR: US results for week ending 8 November
The U.S. hotel industry recorded positive results in the three key performance measurements during the week of 2-8 November 2014, according to data from STR, Inc.Note: ADR: Average Daily Rate, RevPAR: Revenue per Available Room.
In year-over-year measurements, the industry’s occupancy rose 3.5 percent to 66.2 percent. Average daily rate increased 5.4 percent to finish the week at US$117.48. Revenue per available room for the week was up 9.1 percent to finish at US$77.74.
emphasis added
The following graph shows the seasonal pattern for the hotel occupancy rate using the four week average.
Business travel has peaked for the Fall season, and now hotels are heading into the slow period.
 Click on graph for larger image.
The red line is for 2014, blue is the median, and black is for 2009 - the worst year since the Great Depression for hotels. Purple is for 2000.
The 4-week average of the occupancy rate is solidly above the median for 2000-2007, and since mid-June, the 4-week average of the occupancy rate has been a little higher than for the same week in 2000.
Right now it looks like 2014 will be the best year since 2000 for hotels. And since it takes some time to plan and build hotels, I expect 2015 will be even better for hotel occupancy.
Data Source: Smith Travel Research, Courtesy of HotelNewsNow.com


