 RSS Feed
 by Calculated Risk on 9/30/2014 01:44:00 PM
Tuesday, September 30, 2014
House Prices: Real Prices and Price-to-Rent Ratio decline in July
I started 2014 expecting a slowdown in year-over-year (YoY) prices as "For Sale" inventory increases, and the price slowdown is very obvious! The Case-Shiller Composite 20 index was up 6.7% YoY in July; the smallest YoY increase since November 2012 (the National index was up 5.6%, also the slowest YoY increase since November 2012.
I expect YoY prices to slow further over the next several months.
It is also important to look at prices in real terms (inflation adjusted). Case-Shiller, CoreLogic and others report nominal house prices. As an example, if a house price was $200,000 in January 2000, the price would be close to $280,000 today adjusted for inflation (40%). That is why the second graph below is important - this shows "real" prices (adjusted for inflation).
Nominal House Prices
 The first graph shows the monthly Case-Shiller National Index SA, the monthly Case-Shiller Composite 20 SA, and the CoreLogic House Price Indexes (through July) in nominal terms as reported.
In nominal terms, the Case-Shiller National index (SA) is back to February 2005 levels, and the Case-Shiller Composite 20 Index (SA) is back to September 2004 levels, and the CoreLogic index (NSA) is back to February 2005.
Real House Prices
 The second graph shows the same three indexes in real terms (adjusted for inflation using CPI less Shelter). Note: some people use other inflation measures to adjust for real prices.
In real terms, the National index is back to July 2002 levels, the Composite 20 index is back to June 2002, and the CoreLogic index back to March 2003.
In real terms, house prices are back to early '00s levels.
Price-to-Rent
In October 2004, Fed economist John Krainer and researcher Chishen Wei wrote a Fed letter on price to rent ratios: House Prices and Fundamental Value. Kainer and Wei presented a price-to-rent ratio using the OFHEO house price index and the Owners' Equivalent Rent (OER) from the BLS.
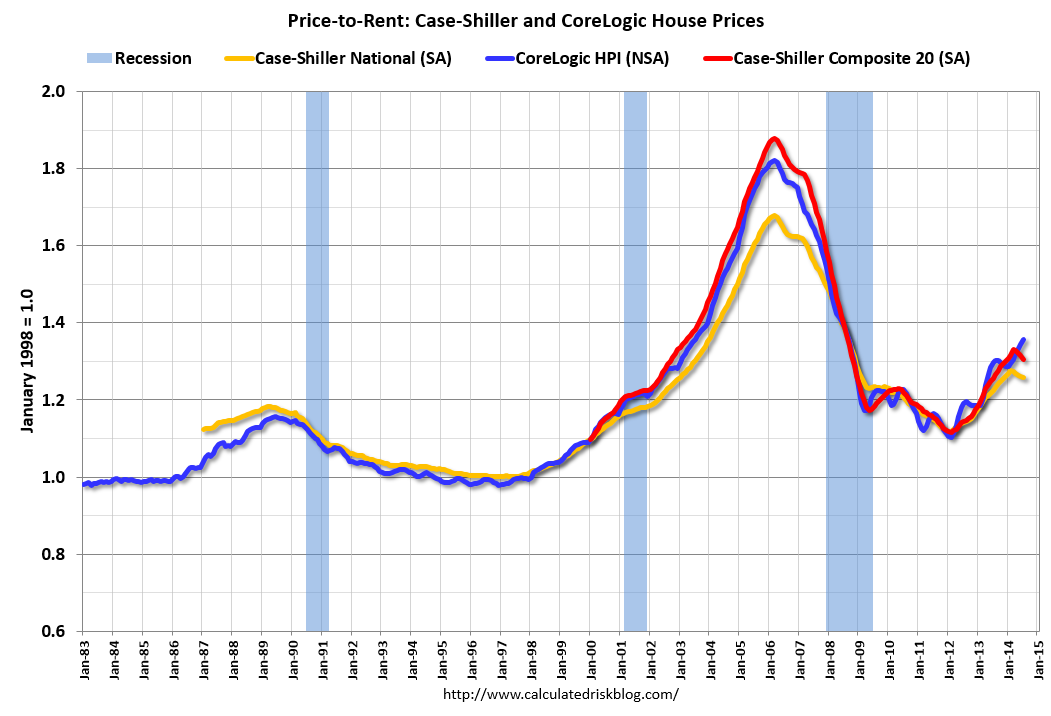 Here is a similar graph using the Case-Shiller National, Composite 20 and CoreLogic House Price Indexes.
This graph shows the price to rent ratio (January 1998 = 1.0).
On a price-to-rent basis, the Case-Shiller National index is back to December 2002 levels, the Composite 20 index is back to September 2002 levels, and the CoreLogic index is back to July 2003.
In real terms, and as a price-to-rent ratio, prices are mostly back to early 2000 levels.
A few comments on the Seasonal Pattern for House Prices
by Calculated Risk on 9/30/2014 11:20:00 AM
A few key points:
1) There is a clear seasonal pattern for house prices.
2) The surge in distressed sales during the housing bust distorted the seasonal pattern.
3) Even though distressed sales are down significantly, the seasonal factor is based on several years of data - and the factor is now overstating the seasonal change.
4) Still the seasonal index is probably a better indicator of actual price movements than the Not Seasonally Adjusted (NSA) index.
For in depth description of these issues, see Trulia chief economist Jed Kolko's article "Let’s Improve, Not Ignore, Seasonal Adjustment of Housing Data"
The housing crisis substantially changed the seasonal pattern of housing activity: relative to conventional home sales, which peak in summer, distressed home sales are more evenly spread throughout the year and sell at a discount. As a result, in years when distressed sales constitute a larger share of overall sales, the seasonal swings in home prices get bigger while the seasonal swings in sales volumes get smaller.Kolko proposed an improved seasonal adjustment. For July, the reported seasonally adjusted month-to-month change for the Composite 20 was -0.5%, but using Kolko's method prices were flat. For the National index, the reported change was +0.2%, and Kolko's method would yield 0.3%.
Sharply changing seasonal patterns create problems for seasonal adjustment methods, which typically estimate seasonal adjustment factors by averaging several years’ worth of observed seasonal patterns. A sharp but ultimately temporary change in the seasonal pattern for housing activity affects seasonal adjustment factors more gradually and for more years than it should. Despite the recent normalizing of the housing market, seasonal adjustment factors are still based, in part, on patterns observed at the height of the foreclosure crisis, causing home price indices to be over-adjusted in some months and under-adjusted in others.
Unfortunately, many have concluded that the solution to the problem of changing seasonal patterns is to downplay or ignore seasonally adjusted housing data until the foreclosure crisis is far enough in the past that it is no longer averaged into seasonal adjustment factors. Standard and Poor’s, publishers of the Case-Shiller home-price index, themselves warned in 2010 that “the unadjusted series is a more reliable indicator and, thus, reports should focus on the year-over-year changes where seasonal shifts are not a factor. Additionally, if monthly changes are considered, the unadjusted series should be used.” Even today, Case-Shiller home-price index press releases continue to emphasize non-seasonally-adjusted (NSA) changes over seasonally adjusted (SA) changes.
But ignoring seasonality during and after the foreclosure crisis is the opposite of what we should be doing. Changing seasonal patterns make seasonal adjustment more important.
Note: I was one of several people to question the change in the seasonal factor (here is a post in 2009) - and this led to S&P Case-Shiller questioning the seasonal factor too (from April 2010).
 Click on graph for larger image.
This graph shows the month-to-month change in the CoreLogic and NSA Case-Shiller National index since 1987 (both through July). The seasonal pattern was smaller back in the '90s and early '00s, and increased since the bubble burst.
It appears we've already seen the strongest month this year (NSA) for both Case-Shiller NSA and CoreLogic. This suggests both indexes will turn negative seasonally (NSA) earlier this year than the previous two years - perhaps in the August reports.
 The second graph shows the seasonal factors for the Case-Shiller National index since 1987. The factors started to change near the peak of the bubble, and really increased during the bust.
 It appears the seasonal factor has started to decrease, and I expect that over the next several years - as the percent of distressed sales declines further and recent history is included in the factors - the seasonal factors will move back towards more normal levels.
However, as Kolko noted, there will be a lag with the seasonal factor since it is based on several years of recent data.
Case-Shiller: National House Price Index increased 5.6% year-over-year in July
by Calculated Risk on 9/30/2014 09:00:00 AM
S&P/Case-Shiller released the monthly Home Price Indices for July ("July" is a 3 month average of May, June and July prices).
This release includes prices for 20 individual cities, and two composite indices (for 10 cities and 20 cities) and the new monthly National index.
Note: Case-Shiller reports Not Seasonally Adjusted (NSA), I use the SA data for the graphs.
From S&P: Broad-Based Easing of Home Price Gains in July According to the S&P/Case-Shiller Home Price Indices
Data through July 2014, released today by S&P Dow Jones Indices for its S&P/Case-Shiller Home Price Indices ... show a significant slowdown in price increases. Nineteen of the 20 cities saw lower annual returns in July. Las Vegas, Miami and San Francisco were the only cities to report double-digit annual gains. Cleveland’s rate remained unchanged at +0.9% for the 12 months ending July 2014.
In July, the 10-City and 20-City Composites increased 0.6% and the National Index 0.5%. Although all cities but one gained on a monthly basis, 17 saw smaller increases in July as compared to last month. Although New York saw a lower gain this month, it was the only city where prices rose over one percent. San Francisco posted its largest decline of 0.4% since February 2012. ...
The S&P/Case-Shiller U.S. National Home Price Index, which covers all nine U.S. census divisions, recorded a 5.6% annual gain in July 2014. The 10- and 20-City Composites posted year-over-year increases of 6.7%.
 Click on graph for larger image.
 The first graph shows the nominal seasonally adjusted Composite 10, Composite 20 and National indices (the Composite 20 was started in January 2000).
The Composite 10 index is off 18.7% from the peak, and down 0.5% in July (SA). The Composite 10 is up 23.1% from the post bubble low set in Jan 2012 (SA).
The Composite 20 index is off 17.9% from the peak, and down 0.5% (SA) in July. The Composite 20 is up 23.7% from the post-bubble low set in Jan 2012 (SA).
The National index is off 11.4% from the peak, and up 0.2% (SA) in July. The National index is up 19.7% from the post-bubble low set in Dec 2012 (SA).
 The second graph shows the Year over year change in all three indices.
The Composite 10 SA is up 6.7% compared to July 2013.
The Composite 20 SA is up 6.7% compared to July 2013.
The National index SA is up 5.6% compared to July 2013.
Prices increased (SA) in 5 of the 20 Case-Shiller cities in July seasonally adjusted. (Prices increased in 19 of the 20 cities NSA) Prices in Las Vegas are off 42.6% from the peak, and prices in Denver and Dallas are at new highs (SA).
This was lower than the consensus forecast for a 7.5% YoY increase for the Composite 20 index, and suggests a further slowdown in price increases. I'll have more on house prices later.
Monday, September 29, 2014
Tuesday: Case-Shiller House Prices, Chicago PMI
by Calculated Risk on 9/29/2014 08:19:00 PM
Tuesday:
• At 9:00 AM ET, S&P/Case-Shiller House Price Index for July. Although this is the June report, it is really a 3 month average of May, June and July. The consensus is for a 7.5% year-over-year increase in the Composite 20 index (NSA) for July. The Zillow forecast is for the Composite 20 to increase 7.0% year-over-year, and for prices to increase 0.1% month-to-month seasonally adjusted.
• At 9:45 AM, the Chicago Purchasing Managers Index for September. The consensus is for a reading of 61.5, down from 64.3 in August.
Note:S&P is now releasing the National house price index monthly, and I expect reporting to shift from the Composite 20 to the National index. The National index was up 6.2% year-over-year in June. Below is a graph with the National and both composite indexes.

Earlier today I posted a table of the year-over-year changes for the Black Knight index (showing year-over-year prices have been slowing for 10 months). Here is a table for Case-Shiller showing year-over-year price changes peaked at the end of 2013, and have been slowing for months:
| Year-over-year Price Changes | |||
|---|---|---|---|
| Month | Composite 10 | Composite 20 | National Index |
| Jan-13 | 7.3% | 8.2% | 7.7% |
| Feb-13 | 8.6% | 9.4% | 8.4% |
| Mar-13 | 10.0% | 10.7% | 8.9% |
| Apr-13 | 11.3% | 11.9% | 9.0% |
| May-13 | 11.6% | 12.0% | 9.0% |
| Jun-13 | 11.7% | 11.9% | 9.2% |
| Jul-13 | 12.1% | 12.3% | 9.7% |
| Aug-13 | 12.7% | 12.8% | 10.2% |
| Sep-13 | 13.2% | 13.2% | 10.7% |
| Oct-13 | 13.6% | 13.6% | 10.9% |
| Nov-13 | 13.9% | 13.7% | 10.8% |
| Dec-13 | 13.6% | 13.4% | 10.8% |
| Jan-14 | 13.5% | 13.2% | 10.5% |
| Feb-14 | 13.2% | 12.9% | 10.2% |
| Mar-14 | 12.6% | 12.4% | 8.9% |
| Apr-14 | 10.8% | 10.8% | 7.9% |
| May-14 | 9.3% | 9.3% | 7.0% |
| Jun-14 | 8.1% | 8.1% | 6.2% |
Black Knight (formerly LPS): House Price Index up 0.2% in July, Up 5.1% year-over-year
by Calculated Risk on 9/29/2014 02:25:00 PM
Note: I follow several house price indexes (Case-Shiller, CoreLogic, Black Knight, Zillow, FHFA, FNC and more). The timing of different house prices indexes can be a little confusing. Black Knight uses the current month closings only (not a three month average like Case-Shiller or a weighted average like CoreLogic), excludes short sales and REOs, and is not seasonally adjusted.
From Black Knight: U.S. Home Prices Up 0.2 Percent for the Month; Up 5.1 Percent Year-Over-Year
Today, the Data and Analytics division of Black Knight Financial Services released its latest Home Price Index (HPI) report, based on July 2014 residential real estate transactions. The Black Knight HPI combines the company’s extensive property and loan-level databases to produce a repeat sales analysis of home prices as of their transaction dates every month for each of more than 18,500 U.S. ZIP codes. The Black Knight HPI represents the price of non-distressed sales by taking into account price discounts for REO and short sales.The year-over-year increases have been getting steadily smaller for the last 10 months - as shown in the table below:
...
- U.S. home prices now just 10.2 percent off 2006 peak
- Year-over-year increases in home appreciation continue to slow
- Seven of 20 largest states register monthly declines in home prices
| Month | YoY House Price Increase |
|---|---|
| Jan-13 | 6.7% |
| Feb-13 | 7.3% |
| Mar-13 | 7.6% |
| Apr-13 | 8.1% |
| May-13 | 7.9% |
| Jun-13 | 8.4% |
| Jul-13 | 8.7% |
| Aug-13 | 9.0% |
| Sep-13 | 9.0% |
| Oct-13 | 8.8% |
| Nov-13 | 8.5% |
| Dec-13 | 8.4% |
| Jan-14 | 8.0% |
| Feb-14 | 7.6% |
| Mar-14 | 7.0% |
| Apr-14 | 6.4% |
| May-14 | 5.9% |
| June-14 | 5.5% |
| July-14 | 5.1% |
The Black Knight HPI is off 10.2% from the peak in June 2006 (not adjusted for inflation).
The press release has data for the 20 largest states, and 40 MSAs.
Black Knight shows prices off 41.7% from the peak in Las Vegas, off 34.6% in Orlando, and 31.8% off from the peak in Riverside-San Bernardino, CA (Inland Empire). Prices are at new highs in Colorado and Texas (Denver, Austin, Dallas, Houston and San Antonio metros). Prices are also at new highs in San Jose, CA and in Nashville, TN.
Note: Case-Shiller for July will be released tomorrow.
Personal Income increased 0.3% in August, Spending increased 0.5%
by Calculated Risk on 9/29/2014 12:31:00 PM
The BEA released the Personal Income and Outlays report for August this morning:
Personal income increased $47.3 billion, or 0.3 percent ... in August, according to the Bureau of Economic Analysis. Personal consumption expenditures (PCE) increased $57.5 billion, or 0.5 percent.The following graph shows real Personal Consumption Expenditures (PCE) through August 2014 (2009 dollars). Note that the y-axis doesn't start at zero to better show the change.
...
Real PCE -- PCE adjusted to remove price changes -- increased 0.5 percent in August, in contrast to a decrease of 0.1 percent in July. ... The price index for PCE decreased less than 0.1 percent in August, in contrast to an increase of 0.1 percent in July. The PCE price index, excluding food and energy, increased 0.1 percent, the same increase as in July. ... The August price index for PCE increased 1.5 percent from August a year ago. The August PCE price index, excluding food and energy, increased 1.5 percent from August a year ago.
 Click on graph for larger image.
The dashed red lines are the quarterly levels for real PCE.
Using the two-month method to estimate Q3 PCE growth, PCE was increasing at a 2.0% annual rate in Q3 2014 (using the mid-month method, PCE was increasing 2.9%). It looks like another quarter of modest PCE growth.
On inflation: The PCE price index increased 1.5 percent year-over-year, and core PCE price index (excluding food and energy) increased 1.5 percent year-over-year in August.
Dallas Fed: "Texas Manufacturing Strengthens" in September
by Calculated Risk on 9/29/2014 11:41:00 AM
From the Dallas Fed: Texas Manufacturing Strengthens
Texas factory activity increased again in September, according to business executives responding to the Texas Manufacturing Outlook Survey. The production index, a key measure of state manufacturing conditions, rose markedly from 6.8 to 17.6, indicating output grew at a faster pace than in August.Here is a graph comparing the regional Fed surveys and the ISM manufacturing index:
Other measures of current manufacturing activity also reflected significantly stronger growth in September. The new orders index climbed 5 points to 7.5. The capacity utilization index surged to 20.2 after dipping to 3.6 in August, with nearly a third of manufacturers noting an increase. The shipments index rebounded to 15.9 after falling to 6.4 last month.
Perceptions of broader business conditions were more optimistic this month. The general business activity index moved up to a reading of 10.8, nearly four points above its nonrecession average of 7. The company outlook index rose from 1.5 to 5.8, due to a larger share of firms noting an improved outlook in September than in August.
Labor market indicators reflected continued employment growth and longer workweeks. The September employment index posted a fourth robust reading, holding fairly steady at 10.6.
emphasis added
 Click on graph for larger image.
The New York and Philly Fed surveys are averaged together (dashed green, through September), and five Fed surveys are averaged (blue, through September) including New York, Philly, Richmond, Dallas and Kansas City. The Institute for Supply Management (ISM) PMI (red) is through August (right axis).
Four of the five regional surveys showed stronger expansion in September than August (the Philly Fed was very strong, but not as strong as August). and it seems likely the ISM index will be solid again this month. The ISM index for September will be released Wednesday, October 1st and the consensus is for a decrease to 58.0 from 59.0 in August.
NAR: Pending Home Sales Index decreased 1.0% in August, down 2.2% year-over-year
by Calculated Risk on 9/29/2014 11:31:00 AM
NOTE: We've had a power outage in my neighborhood. I'll be catching up on some earlier releases.
From the NAR: Pending Home Sales Fall Slightly in August
The Pending Home Sales Index, a forward-looking indicator based on contract signings, fell 1.0 percent to 104.7 in August from 105.8 in July, and is now 2.2 percent below August 2013 (107.1). Despite the slight decline, the index is above 100 – considered an average level of contract activity – for the fourth consecutive month and is at the second-highest level since last August.Note: Contract signings usually lead sales by about 45 to 60 days, so this would usually be for closed sales in September and October.
...
The PHSI in the Northeast slipped 3.0 percent to 86.5 in August, but is still 1.6 percent above a year ago. In the Midwest the index fell 2.1 percent to 102.4 in August, and is 7.6 percent below August 2013.
Pending home sales in the South decreased 1.4 percent to an index of 117.0 in August, unchanged from a year ago. The index in the West rose for the fourth consecutive month (2.6 percent) in August to 102.1, but still remains 2.6 percent below August 2013.
Sunday, September 28, 2014
Monday: Personal Income and Outlays, Pending Home Sales
by Calculated Risk on 9/28/2014 08:21:00 PM
From CNBC: Bill Clinton: I know why US incomes are stagnant
"Median income hasn't gone up for three reasons," Clinton said. "One is the labor markets aren't tight enough, and we haven't raised the minimum wage as we should. And the second reason is we haven't changed the job mix enough, to raise the median income and have more poor people working into it. The combination of jobs has to pay, on average, higher wages."
"Gross domestic product growth doesn't lead to growth in median incomes because company after company takes more of its profits and spends it on dividends, stock buybacks, management increases … and less on sharing it with the employees broadly," said Clinton ...

Here is a graph from the Census report: Income and Poverty in the United States:
"In 2013, real median household income was 8.0 percent lower than in 2007, the year before the most recent recession."My view is slack in the labor market is probably the main cause - and I expect real wages to increase as the unemployment rate falls further.
Monday:
• At 8:30 AM ET, Personal Income and Outlays for August. The consensus is for a 0.3% increase in personal income, and for a 0.4% increase in personal spending. And for the Core PCE price index to be unchanged.
• At 10:00 AM, Pending Home Sales Index for August. The consensus is for a 0.3% decrease in the index.
• At 10:30 AM, Dallas Fed Manufacturing Survey for September. This is the last of the regional manufacturing surveys for September, and so far the results have been solid.
Weekend:
• Schedule for Week of September 28th
• Q3 Review: Ten Economic Questions for 2014
From CNBC: Pre-Market Data and Bloomberg futures: the S&P futures are down 3 and DOW futures are also down 15 (fair value).
Oil prices were mixed over the last week with WTI futures at $93.11 per barrel and Brent at $97.00 per barrel. A year ago, WTI was at $103, and Brent was at $109 - so prices are down 10%+ year-over-year.
Below is a graph from Gasbuddy.com for nationwide gasoline prices. Nationally prices are around $3.34 per gallon (down about 10 cents from a year ago). If you click on "show crude oil prices", the graph displays oil prices for WTI, not Brent; gasoline prices in most of the U.S. are impacted more by Brent prices.
| Orange County Historical Gas Price Charts Provided by GasBuddy.com |
Q3 Review: Ten Economic Questions for 2014
by Calculated Risk on 9/28/2014 11:35:00 AM
At the end of last year, I posted Ten Economic Questions for 2014. I followed up with a brief post on each question. The goal was to provide an overview of what I expected in 2014 (I don't have a crystal ball, but I think it helps to outline what I think will happen - and then try to understand why I was wrong).
By request, here is a Q3 review. I've linked to my posts from the beginning of the year, with a brief excerpt and a few comments:
10) Question #10 for 2014: Downside Risks
Happily, looking forward, it seems the downside risks have diminished significantly. China remains a key risk ... There are always potential geopolitical risks (war with Iran, North Korea, or turmoil in some oil producing country). Right now those risks appear small, although it is always hard to tell. ...There are international risks - China remains a downside risk, Europe (and the Euro) are still a mess, and the situations in the Ukraine and Iraq are serious, but overall it appears that downside risks to the U.S. economy have diminished this year.
When I look around, I see few obvious downside risks for the U.S. economy in 2014. No need to borrow trouble - diminished downside risks are a reason for cheer.
9) Question #9 for 2014: How much will housing inventory increase in 2014?
Right now my guess is active inventory will increase 10% to 15% in 2014 (inventory will decline seasonally in December and January, but I expect to see inventory up 10% to 15% year-over-year toward the end of 2014). This will put active inventory close to 6 months supply this summer. If correct, this will slow house price increases in 2014.The NAR reported inventory was up 4.5% year-over-year in August. Note: I used to follow "Housing Tracker" weekly, but the site had some data problems and they discontinued the series. It looks like a 10% to 15% increase this year might be close - but a little high - based on the NAR reports.
8) Question #8 for 2014: Housing Credit: Will we see easier mortgage lending in 2014?
Bottom line: I expect lending standards to loosen a bit in 2014 from the tight level of the last few years. It will be difficult to measure, but I'll be watching what Mel Watt says, what private lenders say, comments from mortgage brokers, and MEW.We may be seeing a little loosening according to the most recent Fed Senior Loan Officer survey showed some loosening of standards:
A moderate net fraction of domestic banks reported having eased their standards on prime residential mortgages, on net, while most indicated that standards on nontraditional mortgages and home equity lines of credit (HELOCs) were relatively little changed. Banks reported having experienced stronger demand, on balance, for prime residential mortgages for the first time since a year ago...But this is just for prime mortgages.
emphasis added
7) Question #7 for 2014: What will happen with house prices in 2014?
In 2014, inventories will probably remain low, but I expect inventories to continue to increase on a year-over-year basis. This suggests more house price increases in 2014, but probably at a slow pace.We only have Case-Shiller data through June (8.1% year-over-year gain for Composite 20), and it appears price increases are slowing. My prediction still seems OK, but if anything, house prices might slow more than I expected.
As Khater noted, some of the "bounce back" in certain areas is probably over, also suggesting slower price increases going forward. And investor buying appears to have slowed. A positive for the market will probably be a little looser mortgage credit.
All of these factors suggest further prices increases in 2014, but at a slower rate than in 2013. There tends to be some momentum for house prices, and I expect we will see prices up mid-to-high single digits (percentage) in 2014 as measured by Case-Shiller.
6) Question #6 for 2014: How much will Residential Investment increase?
New home sales will still be competing with distressed sales (short sales and foreclosures) in some judicial foreclosure states in 2014. However, unlike last year when I reported that some builders were land constrained (not enough finished lots in the pipeline), land should be less of an issue this year. Even with the foreclosures, I expect another solid year of growth for new home sales.Through August, new home sales were up 2.7% over 2013, and housing starts were only up 8.6% year-over-year. There was a slow start to 2014 mostly due to higher mortgage rates, higher prices and supply constraints in some areas - and a little bit due to the weather. I still think fundamentals support a higher level of starts, and I still expect starts and new home sales to be up this year (but not as much as I initially expected). An optimistic view is that this means more growth next year!
... I expect growth for new home sales and housing starts in the 20% range in 2014 compared to 2013. That would still make 2014 the tenth weakest year on record for housing starts (behind 2008 through 2012 and few other recession lows).
5) Question #5 for 2014: Monetary Policy: Will the Fed end QE3 in 2014?
[E]ven though the Fed is data-dependent, I currently expect the Fed to reduce their asset purchases by $10 billion per month (or so) at each meeting this year and conclude QE3 at the end of the 2014.QE3 will end in October.
4) Question #4 for 2014: Will too much inflation be a concern in 2014?
[C]urrently I think inflation (year-over-year) will increase a little in 2014 as growth picks up, but too much inflation will not be a concern in 2014.Inflation is not a concern this year.
3) Question #3 for 2014: What will the unemployment rate be in December 2014?
My guess is the participation rate will stabilize or only decline slightly in 2014 (less than in 2012 and 2013) ... it appears the unemployment rate will decline to the low-to-mid 6% range by December 2014.The unemployment rate was 6.1% in August and it looks like I was too pessimistic.
2) Question #2 for 2014: How many payroll jobs will be added in 2014?
Both state and local government and construction hiring should improve further in 2014. Federal layoffs will be a negative, but most sectors should be solid. So my forecast is somewhat above the previous three years, and I expect gains of about 200,000 to 225,000 payroll jobs per month in 2014.Through August 2014, the economy has added 1,723,000 jobs, or 215,000 per month. So far this is at the expected pace.
1) Question #1 for 2014: How much will the economy grow in 2014?
I expect PCE to pick up again into the 3% to 4% range, and this will give a boost to GDP. This increase in consumer spending should provide an incentive for business investment. Add in the ongoing housing recovery, some increase in state and local government spending, and 2014 should be the best year of the recovery with GDP growth at or above 3%The first quarter was very disappointing, but economic activity picked up in Q2. However PCE hasn't picked up as much as I expected (only 2.5% in Q2). GDP should be solid in Q3 (and probably in Q4 too), but growth will probably be closer to 2% again this year.


