 RSS Feed
 by Calculated Risk on 4/01/2014 03:17:00 PM
Tuesday, April 01, 2014
U.S. Light Vehicle Sales increase to 16.4 million annual rate in March, Highest since 2007
Based on an WardsAuto estimate, light vehicle sales were at a 16.38 million SAAR in March. That is up 7.3% from March 2013, and up 7.2% from the sales rate last month.
This was above the consensus forecast of 15.8 million SAAR (seasonally adjusted annual rate).
 Click on graph for larger image.
This graph shows the historical light vehicle sales from the BEA (blue) and an estimate for March (red, light vehicle sales of 16.38 million SAAR from WardsAuto).
Severe weather clearly impacted sales in January and February, and some of the increase in March was probably a bounce back due to better weather.
The second graph shows light vehicle sales since the BEA started keeping data in 1967.
 Note: dashed line is current estimated sales rate.
Unlike residential investment, auto sales bounced back fairly quickly following the recession and were a key driver of the recovery.
Looking forward, the growth rate will slow for auto sales, and most forecasts are for around a small gain in 2014 to around 16.1 million light vehicles.
Construction Spending increased slightly in February
by Calculated Risk on 4/01/2014 11:09:00 AM
The Census Bureau reported that overall construction spending increased in February:
The U.S. Census Bureau of the Department of Commerce announced today that construction spending during February 2014 was estimated at a seasonally adjusted annual rate of $945.7 billion, 0.1 percent above the revised January estimate of $944.6 billion. The February figure is 8.7 percent above the February 2013 estimate of $869.9 billion.Both private and public spending increased slightly in February:
Spending on private construction was at a seasonally adjusted annual rate of $680.0 billion, 0.1 percent above the revised January estimate of $679.1 billion. ...
In February, the estimated seasonally adjusted annual rate of public construction spending was $265.7 billion, 0.1 percent above the revised January estimate of $265.5 billion.
emphasis added
 Click on graph for larger image.
This graph shows private residential and nonresidential construction spending, and public spending, since 1993. Note: nominal dollars, not inflation adjusted.
Private residential spending is 47% below the peak in early 2006, and up 58% from the post-bubble low.
Non-residential spending is 23% below the peak in January 2008, and up about 42% from the recent low.
Public construction spending is now 18% below the peak in March 2009 and up less than 1% from the recent low.
 The second graph shows the year-over-year change in construction spending.
On a year-over-year basis, private residential construction spending is now up 14%. Non-residential spending is up 12% year-over-year. Public spending is down slightly year-over-year.
To repeat a few key themes:
1) Private residential construction is usually the largest category for construction spending, and is now the largest category once again. Usually private residential construction leads the economy, so this is a good sign going forward.
2) Private non-residential construction spending usually lags the economy. There was some increase this time for a couple of years - mostly related to energy and power. Now the key sectors of office, retail and hotels are starting to increase, but from very low levels. As an example, lodging construction spending was up 40% year-over-year, office spending up 19%, and retail spending up 18% year-over-year.
Based on the architecture billings index, I expect private non-residential to increase further this year.
3) Public construction spending was up slightly in February, but is only up 1% from the low in April 2013. It appears that the drag from public construction spending is over. Public spending has declined to 2006 levels (not adjusted for inflation) and was a drag on the economy for 4+ years. In real terms, public construction spending has declined to 2001 levels.
Looking forward, all categories of construction spending should increase in 2014. Residential spending is still very low, non-residential is starting to pickup, and public spending appears to have bottomed.
ISM Manufacturing index increased in March to 53.7
by Calculated Risk on 4/01/2014 10:08:00 AM
The ISM manufacturing index indicated faster expansion in March than in February. The PMI was at 53.7% in March, up from 53.2% in February. The employment index was at 51.1%, down from 52.3% in February, and the new orders index was at 55.1%, up from 54.5% in February.
From the Institute for Supply Management: March 2014 Manufacturing ISM Report On Business®
Economic activity in the manufacturing sector expanded in March for the 10th consecutive month, and the overall economy grew for the 58th consecutive month, say the nation's supply executives in the latest Manufacturing ISM® Report On Business®.
The report was issued today by Bradley J. Holcomb, CPSM, CPSD, chair of the Institute for Supply Management® (ISM®) Manufacturing Business Survey Committee. "The March PMI® registered 53.7 percent, an increase of 0.5 percentage point from February's reading of 53.2 percent, indicating expansion in manufacturing for the 10th consecutive month. The New Orders Index registered 55.1 percent, an increase of 0.6 percentage point from February's reading of 54.5 percent. The Production Index registered 55.9 percent, a substantial increase of 7.7 percentage points compared to February's reading of 48.2 percent. Employment grew for the ninth consecutive month, but at a lower rate by 1.2 percentage points, registering 51.1 percent compared to February's reading of 52.3 percent. Several comments from the panel reflect favorable demand and good business conditions, with some lingering concerns about the particularly adverse weather conditions across the country."
emphasis added
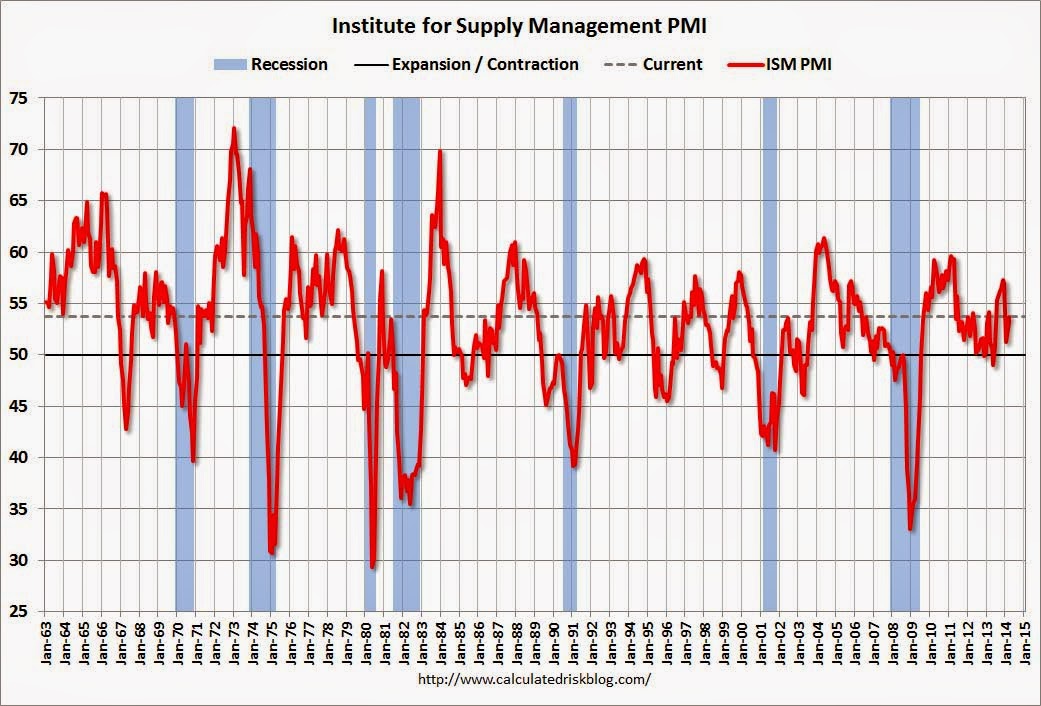 Click on graph for larger image.
Here is a long term graph of the ISM manufacturing index.
This was just below expectations of 54.0%.
Reis: Office Vacancy Rate declined slightly in Q1 to 16.8%
by Calculated Risk on 4/01/2014 09:09:00 AM
Reis released their Q1 2014 Office Vacancy survey this morning. Reis reported that the office vacancy rate declined to 16.8% in Q1. This is down from 16.9% in Q4 2013, and down from the cycle peak of 17.6%.
From Reis Senior Economist Ryan Severino:
The national vacancy rate was down 10 basis points during the fourth quarter to 16.8%. This is a very marginal improvement from last quarter, but completely in line with the tepid recovery in the office sector since it commenced in early 2011. Since that, time declines in vacancy have been no greater than 10 basis points per quarter; the vacancy rate has been unchanged in numerous quarters during the recovery. Over the last twelve months, the vacancy rate is down just 20 basis points, on par with last quarter. National vacancies remain elevated at 430 basis points above the sector's cyclical low of 12.5% recorded during the third quarter of 2007.On absorption and new construction:
emphasis added
Net absorption increased by 9.8 million square feet during the quarter. This is the highest quarterly figure since before the recession. Net absorption averaged roughly 7.1 million square feet per quarter during 2013 so this represents an optimistic start to the year. Construction increased by 6.3 million square feet during the first quarter. This is roughly on par with the quarterly average of 6.5 million square feet during 2013. Therefore, net absorption outpaced completions by approximately 3.5 million square feet during the first quarter. This is heartening because in recent quarters increases in net absorption have been largely tied to increases in construction activity. This is a more organic increase, tied to increasing demand for existing inventory as well as newly completed space.On rents:
Asking and effective rents grew by 0.7% and 0.8%, respectively, during the first quarter. These figures are all little changed from last quarter, owing to the similar tepid pace of improvement in vacancy. Nevertheless, asking and effective rents have now risen for fourteen consecutive quarters, albeit modestly. Asking rent growth was 1.6% during 2011, 1.8% during 2012, and 2.1% in 2013. Given the still‐elevated national vacancy rate, rent growth is struggling to grow faster than inflation because landlords have little leverage over tenants.
 Click on graph for larger image.
This graph shows the office vacancy rate starting in 1980 (prior to 1999 the data is annual).
Reis reported the vacancy rate was unchanged at 16.8% in Q1, and was down from 17.0% in Q1 2013. The vacancy rate peaked in this cycle at 17.6% in Q3 and Q4 2010, and Q1 2011.
Office vacancy data courtesy of Reis.
Monday, March 31, 2014
Tuesday: Auto Sales, ISM Mfg Index, Construction Spending, Q1 Office Vacancy Survey
by Calculated Risk on 3/31/2014 09:16:00 PM
Oh no, not April 1st! From the NY Times: Beware the April Fools’ Jokes Coming From Madison Avenue
In the last three or four years, the ranks of pranksters seem to have grown, partly because of the ability of social media to rapidly communicate and amplify messages. For instance, a trick pulled off for April Fools’ Day last year by FreshDirect — the introduction of a blueberry and banana hybrid called a “bluenana” — was “a hit with our customers, garnering lots of buzz across social media,” said Jodi Kahn, chief consumer officer at FreshDirect.Tuesday:
...
Time will tell whether any of the jokes for 2014 will rank among the funniest — and most successful in fooling consumers — of previous April Fools’ Days. Among those was a “left-handed” Whopper from Burger King in 1998 and an announcement in 1996 that Taco Bell had bought the Liberty Bell and renamed it the Taco Liberty Bell.
• Early: Reis Q1 2014 Office Survey of rents and vacancy rates.
• All day: Light vehicle sales for March. The consensus is for light vehicle sales to increase to 15.8 million SAAR in March (Seasonally Adjusted Annual Rate) from 15.3 million SAAR in February.
• At 9:00 AM ET, the Markit US PMI Manufacturing Index for March.
• At 10:00 AM, the ISM Manufacturing Index for March. The consensus is for an increase to 54.0 from 53.2 in February.
• Also at 10:00 AM, Construction Spending for February. The consensus is for a 0.1% increase in construction spending.
Fannie Mae: Mortgage Serious Delinquency rate declined in February, Lowest since November 2008
by Calculated Risk on 3/31/2014 05:40:00 PM
Fannie Mae reported today that the Single-Family Serious Delinquency rate declined in February to 2.27% from 2.33% in January. The serious delinquency rate is down from 3.13% in February 2013, and this is the lowest level since November 2008.
The Fannie Mae serious delinquency rate peaked in February 2010 at 5.59%.
Last week, Freddie Mac reported that the Single-Family serious delinquency rate declined in February to 2.29% from 2.34% in January. Freddie's rate is down from 3.15% in February 2013, and is at the lowest level since February 2009. Freddie's serious delinquency rate peaked in February 2010 at 4.20%.
Note: These are mortgage loans that are "three monthly payments or more past due or in foreclosure".
 Click on graph for larger image
The Fannie Mae serious delinquency rate has fallen 0.86 percentage points over the last year, and at that pace the serious delinquency rate will be under 1% in late 2015.
Note: The "normal" serious delinquency rate is under 1%.
Maybe serious delinquencies will be back to normal in late 2015 or 2016.
Weekly Update: Housing Tracker Existing Home Inventory up 6.7% year-over-year on March 31st
by Calculated Risk on 3/31/2014 03:51:00 PM
Here is another weekly update on housing inventory ...
There is a clear seasonal pattern for inventory, with the low point for inventory in late December or early January, and then usually peaking in mid-to-late summer.
The Realtor (NAR) data is monthly and released with a lag (the most recent data was for February). However Ben at Housing Tracker (Department of Numbers) has provided me some weekly inventory data for the last several years.
 Click on graph for larger image.
This graph shows the Housing Tracker reported weekly inventory for the 54 metro areas for 2010, 2011, 2012, 2013 and 2014.
In 2011 and 2012, inventory only increased slightly early in the year and then declined significantly through the end of each year.
In 2013 (Blue), inventory increased for most of the year, and finished up about 2.7% YoY.
Inventory in 2014 (Red) is now 6.7% above the same week in 2013.
Inventory is still very low, but this increase in inventory should slow house price increases.
Note: One of the key questions for 2014 will be: How much will inventory increase? My guess is inventory will be up 10% to 15% year-over-year by the end of 2014 (inventory would still be below normal).
Restaurant Performance Index indicates expansion in February
by Calculated Risk on 3/31/2014 01:51:00 PM
From the National Restaurant Association: Restaurant Performance Index Remained Above 100 in February Despite Continued Dampened Customer Traffic Levels
Although challenging weather conditions in many parts of the country continued to impact customer traffic in February, the National Restaurant Association’s Restaurant Performance Index (RPI) remained above 100 for the 12th consecutive month. The RPI – a monthly composite index that tracks the health of and outlook for the U.S. restaurant industry – stood at 100.5 in February, down 0.2 percent from January’s level of 100.7. Despite the modest decline, the fact that the overall RPI remains above 100 continues to signify expansion in the index of key industry indicators.
“Restaurant operators continued to report net positive same-store sales results in February, despite customer traffic levels that were challenged by the weather,” said Hudson Riehle, senior vice president of the Research and Knowledge Group for the Association. “Looking forward, operators are generally optimistic about sales gains in the months ahead, although they aren’t as bullish about the overall economy.””
...
Although results were mixed in February, restaurant operators reported net positive same-store sales for the 12th consecutive month. ... In contrast, restaurant operators reported a net decline in customer traffic for the third consecutive month.
emphasis added
 Click on graph for larger image.
The index decreased to 100.5 in February, down from 100.7 in January. (above 100 indicates expansion).
Restaurant spending is discretionary, so even though this is "D-list" data, I like to check it every month - and this is fairly positive considering the terrible weather in February.
Dallas Fed: Texas Manufacturing Strengthens Further
by Calculated Risk on 3/31/2014 10:30:00 AM
From the Dallas Fed: Texas Manufacturing Strengthens Further
Texas factory activity increased for the eleventh month in a row in March, according to business executives responding to the Texas Manufacturing Outlook Survey. The production index, a key measure of state manufacturing conditions, rose from 10.8 to 17.1, indicating output grew at a stronger pace than in February.A solid report.
Other measures of current manufacturing activity also reflected more robust growth. The new orders index rose to a nine-month high of 14.7 ... Labor market indicators reflected stronger employment growth and longer workweeks. The March employment index rose markedly to a 21-month high of 15.
...
The general business activity index moved up to a six-month high of 4.9 after slipping to zero last month.
Expectations regarding future business conditions remained optimistic in March. The index of future general business activity edged up to 17.6, and the index of future company outlook rose 7 points to 27.4.
This is the last of the regional surveys. Here is a graph comparing the regional Fed surveys and the ISM manufacturing index:
 Click on graph for larger image.
The New York and Philly Fed surveys are averaged together (dashed green, through March), and five Fed surveys are averaged (blue, through March) including New York, Philly, Richmond, Dallas and Kansas City. The Institute for Supply Management (ISM) PMI (red) is through February (right axis).
This suggests some increase in the March ISM survey to be released tomorrow, Tuesday, April 1st.
Chicago PMI declines to 55.9
by Calculated Risk on 3/31/2014 09:45:00 AM
From the Chicago ISM:
March 2014:
The Chicago Business Barometer decreased 3.9 points in March to 55.9, the lowest level since August, led by a decline in New Orders and a sharp fall in Employment. ...This was below the consensus estimate of 58.5.
Although New Orders remained firm above the 50 breakeven level, they eased for the second consecutive month pointing to a slight softening in demand. Like the Barometer, New Orders posted the lowest reading since August. Order Backlogs also decreased, to their lowest level since September.
Employment, the second biggest contributor to the Barometer’s decline, decreased sharply in March, erasing nearly all of February’s double digit rise.
Commenting on the MNI Chicago Report, Philip Uglow, Chief Economist of MNI Indicators said, “March saw a significant weakening in activity following a five month spell of firm growth. It’s too early to tell, though, if this is the start of a sustained slowdown or just a blip.”
“Panellists, though, were optimistic about the future. Asked about the outlook for demand over the next three months, the majority of businesses said they expected tosee a pick-up.” he added.
emphasis added


