 RSS Feed
 by Calculated Risk on 12/06/2013 08:30:00 AM
Friday, December 06, 2013
November Employment Report: 203,000 Jobs, 7.0% Unemployment Rate
From the BLS:
The unemployment rate declined from 7.3 percent to 7.0 percent in November, and total nonfarm payroll employment rose by 203,000, the U.S. Bureau of Labor Statistics reported today. ...The headline number was above expectations of 180,000 payroll jobs added.
...
Both the number of unemployed persons, at 10.9 million, and the unemployment rate, at 7.0 percent, declined in November. Among the unemployed, the number who reported being on temporary layoff decreased by 377,000. This largely reflects the return to work of federal employees who were furloughed in October due to the partial government shutdown.
...
The civilian labor force rose by 455,000 in November, after declining by 720,000 in October. The labor force participation rate changed little (63.0 percent) in November. Total employment as measured by the household survey increased by 818,000 over the month, following a decline of 735,000 in the prior month. This over-the-month increase in employment partly reflected the return to work of furloughed federal government employees. The employment-population ratio increased by 0.3 percentage point to 58.6 percent in November, reversing a decline of the same size in the prior month.
...
The change in total nonfarm payroll employment for September was revised from +163,000 to +175,000, and the change for October was revised from +204,000 to +200,000. With these revisions, employment gains in September and October combined were 8,000 higher than previously reported.
 Click on graph for larger image.
This graph shows the job losses from the start of the employment recession, in percentage terms, compared to previous post WWII recessions. The dotted line is ex-Census hiring.
This shows the depth of the recent employment recession - worse than any other post-war recession - and the relatively slow recovery due to the lingering effects of the housing bust and financial crisis.
Employment is less than 1% below the pre-recession peak.

NOTE: The second graph is ex-Census meaning the impact of the decennial Census temporary hires and layoffs is removed to show the underlying payroll changes.
The third shows the unemployment rate.
The unemployment rate decreased in November to 7.0% from 7.3% in October.
 This increase in the unemployment rate in October was related to the government shutdown - and was reversed in the November employment report.
The fourth graph shows the employment population ratio and the participation rate.
The Labor Force Participation Rate increased in November to 63.0% from 62.8% in October (October decline was partially related to shutdown). This is the percentage of the working age population in the labor force.
 The participation rate is well below the 66% to 67% rate that was normal over the last 20 years, although a significant portion of the recent decline is due to demographics.
The Employment-Population ratio increased in November to 58.6% from 58.3% in October (black line).
I'll post the 25 to 54 age group employment-population ratio graph later.
This was another solid employment report. Many of the negatives in the October report were related to the government shutdown and were mostly reversed in the November report. I'll have much more later ...
Thursday, December 05, 2013
Friday: Employment Report, Personal Income and Outlays
by Calculated Risk on 12/05/2013 06:57:00 PM
A couple more employment previews, first from David Mericle at Goldman Sachs:
We expect a 175k gain in both nonfarm payrolls and private payrolls in November, a bit below consensus expectations of 185k and a modest slowdown from the 204k gain seen in October. ... We expect that the unemployment rate will decline to 7.1% in November, reflecting both employment gains and the possibility that some of the decline in participation seen in October's distorted household survey will persist this month.And from Merrill Lynch:
We are looking for job growth of 175,000 in November, a slight slowdown from the 204,000 pace in October. The unemployment rate should fall to 7.2% from 7.3% while the workweek holds steady at 34.4 hours. ... Looking back at the recent history, when Thanksgiving is late in the month, there seems to be a downward bias in retail jobs in November and a reversal in December. The reverse is the case when the Thanksgiving holiday is early in the month, as it was last year. This could account for a swing of as many as 40,000 jobs. ... The household survey was distorted in the October report, leading to a sharp decline in the labor force and in the number of employed workers. This bias will be reversed in November as people returned to work after the shutdown. We therefore expect the participation rate to jump back to 63.1%, nearly returning to the September pace.Friday:
• At 8:30 AM ET, the Employment Report for November. The consensus is for an increase of 180,000 non-farm payroll jobs in November, down from the 204,000 non-farm payroll jobs added in October. The consensus is for the unemployment rate to decrease to 7.2% in November from 7.3% in October. A key will be if the participation rate increases too, reversing the sharp decline last month.
• Also at 8:30 AM, Personal Income and Outlays for October. The consensus is for a 0.3% increase in personal income, and for a 0.3% increase in personal spending. And for the Core PCE price index to increase 0.1%.
• At 9:55 AM, the Reuter's/University of Michigan's Consumer sentiment index (preliminary for December). The consensus is for a reading of 75.5, up from 75.1 in November.
• At 3:00 PM, Consumer Credit for October from the Federal Reserve. The consensus is for credit to increase $15.0 billion in October.
Comments on Q3 GDP and Investment
by Calculated Risk on 12/05/2013 02:05:00 PM
The BEA revised up Q3 GDP to 3.6% (from 2.8% in the advance release). The main reason for the upward revision was more investment in inventory (the contribution from "Change in private inventories" was revised up from 0.83 percentage points in the advance release to 1.68 percentage in the second release).
The change in private inventories tends to bounce around, and this will probably be a drag on Q4 GDP.
Note: The BEA provides a summary of revisions Real Gross Domestic Product and Related Measures: Percent Change From Preceding Period and Contributions to Percent Change in Real Gross Domestic Product.
Personal consumption expenditures (PCE) was revised down from a 1.5% annual rate to 1.4%, and residential investment (RI) was revised down from 14.6% to 13.0%. This is weak final demand (PCE and RI contributed 1.34 percentage point to GDP growth in Q3). This is the weakest final demand since Q2 2011.
The good news is PCE will probably increase in 2014 with most of the impact of tax increases and budget cuts ending. But Q4 2013 will probably be another weak quarter impacted by the government shutdown, a negative contribution from private inventories, and still weak final demand.
The following graph shows the contribution to GDP from residential investment, equipment and software, intellectual properties, and nonresidential structures (3 quarter centered average). This is important to follow because residential investment tends to lead the economy, equipment and software is generally coincident, and nonresidential structure investment trails the economy.
For the following graph, red is residential, green is equipment and software, and blue is investment in non-residential structures. So the usual pattern - both into and out of recessions is - red, green, blue.
The dashed gray line is the contribution from the change in private inventories.
 Click on graph for larger image.
Residential Investment (RI) made a positive contribution to GDP in Q3 for the twelfth consecutive quarter. Usually residential investment leads the economy, but that didn't happen this time because of the huge overhang of existing inventory.
Now RI is contributing - a good sign going forward since RI is historically still very low.
Overall this was another weak GDP report, but it does look like GDP will pickup in 2014.
Employment Preview for November
by Calculated Risk on 12/05/2013 10:58:00 AM
In October I was looking for an Upside Payroll Surprise. For November, my guess is closer to the consensus forecast of 180,000 payroll jobs added. The consensus is for the unemployment rate to decrease to 7.2% in November from 7.3% in October.
The October employment report was impacted by the government shutdown, and the unemployment rate increased in October to 7.3% from 7.2% in September. Even worse, the participation rate declined sharply in October to 62.8% from 63.2% in September. One of the keys for the November report will be if those ugly October numbers are reversed.
Here is a summary of recent data:
• The ADP employment report showed an increase of 215,000 private sector payroll jobs in November. This was above expectations of 185,000 private sector payroll jobs added. The ADP report hasn't been very useful in predicting the BLS report for any one month. But in general, this suggests employment growth above expectations.
• The ISM manufacturing employment index increased in November to 56.5%, from 53.2% in October. A historical correlation between the ISM manufacturing employment index and the BLS employment report for manufacturing, suggests that private sector BLS manufacturing payroll jobs increased about 15,000 in November. The ADP report indicated a 18,000 increase for manufacturing jobs in November.
The ISM non-manufacturing employment index decreased in November to 52.5% from 56.2% in October. A historical correlation between the ISM non-manufacturing index and the BLS employment report for non-manufacturing, suggests that private sector BLS reported payroll jobs for non-manufacturing increased by about 140,000 in November.
Taken together, these surveys suggest around 155,000 jobs added in November - below the consensus forecast.
• Initial weekly unemployment claims averaged close to 322,000 in November. This was down sharply from an average of 358,000 in October, but up from the 305,000 average in September. However there were some computer problems in California, and claims in October were probably too high, and claims in September were probably too low.
This was below the level in August (when the BLS reported 238,000 payroll jobs added), and far below the level of November 2012 when the BLS reported 247,000 jobs added (after revisions). This suggests fewer layoffs, and possibly more net payroll jobs added than the consensus forecast.
• The final November Reuters / University of Michigan consumer sentiment index increased to 75.1 from the October reading of 73.2. This is frequently coincident with changes in the labor market, but in this case sentiment is recovering from the government shutdown.
• The small business index from Intuit showed a 10,000 increase in small business employment in November. This is the largest increase in this index since May and June, and suggests a pickup in small business hiring.
• Conclusion: As usual the data was mixed. The ADP report was higher in November than in October, however the ISM surveys suggest a slower increase in payrolls. Weekly claims for the reference week were at the lowest level this year excluding September when there were computer issues (the reference week includes the 12th of the month), and consumer sentiment increased (recovering from government shutdown). Also the Intuit small business index showed a pickup in hiring.
There is always some randomness to the employment report. My guess is the report will be close to the consensus forecast of 180,000 nonfarm payrolls jobs added in November.
Weekly Initial Unemployment Claims decline to 298,000, Q3 GDP Revised up to 3.6%
by Calculated Risk on 12/05/2013 08:39:00 AM
The BEA reports:
Real gross domestic product -- the output of goods and services produced by labor and property located in the United States -- increased at an annual rate of 3.6 percent in the third quarter of 2013 (that is, from the second quarter to the third quarter), according to the "second" estimate released by the Bureau of Economic Analysis. ... The GDP estimate released today is based on more complete source data than were available for the "advance" estimate issued last month. In the advance estimate, the increase in real GDP was 2.8 percentThe DOL reports:
The upward revision to the percent change in real GDP primarily reflected upward revisions to private inventory investment and to nonresidential fixed investment that were partly offset by an upward revision to imports and a downward revision to exports
In the week ending November 30, the advance figure for seasonally adjusted initial claims was 298,000, a decrease of 23,000 from the previous week's revised figure of 321,000. The 4-week moving average was 322,250, a decrease of 10,750 from the previous week's revised average of 333,000.The previous week was up from 316,000.
The following graph shows the 4-week moving average of weekly claims since January 2000.
 Click on graph for larger image.
The dashed line on the graph is the current 4-week average. The four-week average of weekly unemployment claims decreased to 322,250.
The level of weekly claims suggests an improving labor market.
Wednesday, December 04, 2013
Thursday: Unemployment Claims, Q3 GDP
by Calculated Risk on 12/04/2013 09:05:00 PM
On the MBA Purchase Index: This morning I mentioned a WSJ article Smaller Mortgage Lenders Lead Field. This suggests that the MBA Purchase Index might be understating purchase activity if smaller lenders (not in the survey) are gaining share. MBA's Mike Fratantoni told me today:
[I]n the last couple of years ... independent mortgage bankers have accounted for a fast growing share of the purchase market ... We have actively recruited independents and smaller banks to get better coverage of the purchase market. ... It is likely that many of the lenders not in the survey have a higher purchase share and lower refi share.It appears these small independent lenders are focusing on the purchase market (probably marketing through real estate agents - and selling the loans to Fannie and Freddie). A result of this change in market share is the Purchase Index is probably understating the increase in purchase activity.
Thursday:
• At 8:30 AM ET, the initial weekly unemployment claims report will be released. The consensus is for claims to increase to 322 thousand from 316 thousand last week.
• Also at 8:30 AM, the is the second estimate of Q3 GDP from the BEA. The consensus is that real GDP increased 3.1% annualized in Q3, revised up from the advance estimate of 2.8%.
• At 10:00 AM, the Manufacturers' Shipments, Inventories and Orders (Factory Orders) for October. The consensus is for a 1.2% decrease in October orders.
Trulia: Asking House Price increases Slow in Hot Markets
by Calculated Risk on 12/04/2013 06:04:00 PM
From Trulia this morning: Trulia Price Monitor: Hottest Housing Markets Cool, While Warm Markets Heat Up
In November, asking home prices rose 12.1 percent year-over-year (Y-o-Y), increasing in 98 of the 100 largest U.S. metro areas. Regaining a bit of steam since the slowdown began in July, asking prices rose 1.0 percent month-over-month (M-o-M) and 3.0 percent quarter-over-quarter (Q-o-Q). In fact, the quarterly increase is the fastest in five months, though still lower than in the spring.Note: These asking prices are SA (Seasonally Adjusted) - and adjusted for the mix of homes - and this suggests further house price increases over the next few months on a seasonally adjusted basis.
...
The slowing of asking home price gains is most apparent in the housing markets with the biggest price rebounds. The slowdown – measured as the difference in the Q-o-Q price changes between November and August – was more than two percentage points in Las Vegas, Oakland, Atlanta, Phoenix, Detroit, and Los Angeles.
The price slowdown happening nationally is really a sharp deceleration in price gains in the hottest markets. Among the 100 U.S. largest metros, the quarterly price increase in the 10 metros where prices rose more than 20 percent Y-o-Y fell from 6.1 percent in August to 3.7 percent in November. But in the 56 markets where prices rose by less than 10 percent Y-o-Y, price gains actually accelerated in the most recent quarter, rising 1.6 percent in November compared with 1.3 percent in August. Prices accelerated in Philadelphia, Pittsburgh, and Miami, for instance.
“The price slowdown – like everything about housing – is all local,” said Jed Kolko, Trulia’s Chief Economist. “Price gains are cooling in 2013’s hottest markets, like Las Vegas and Oakland, but heating up in markets that haven’t been in the limelight.” emphasis added
More from Kolko: Hottest Housing Markets Cool, But Warm Markets Heat Up
Fed's Beige Book: Economic activity increased "at a modest to moderate pace"
by Calculated Risk on 12/04/2013 02:00:00 PM
Fed's Beige Book "Prepared at the Federal Reserve Bank of Cleveland and based on information collected on or before November 22, 2013. This document summarizes comments received from business and other contacts outside the Federal Reserve and is not a commentary on the views of Federal Reserve officials."
Reports from the twelve Federal Reserve Districts indicated that the economy continued to expand at a modest to moderate pace from early October through mid-November. Activity in the New York, Cleveland, Richmond, Atlanta, St. Louis, Minneapolis, and Dallas Districts grew at a moderate pace, while Philadelphia, Chicago, Kansas City, and San Francisco cited modest growth. Boston reported that economic activity continued to expand.And on real estate:
Residential real estate activity improved in Boston, Philadelphia, Chicago, St. Louis, Minneapolis, and San Francisco, while remaining steady or softening in other Districts. Some slowing in single-family home sales was attributed to seasonal factors. Nonetheless, sales remain largely above year-ago levels. Increasing demand, low to declining levels of inventory, and slowly rising new-home construction were cited by almost all Districts as reasons for a continued rise in home prices, but at a slower pace than was observed earlier in 2013. Historically low inventories of unsold homes were reported in Philadelphia, Richmond, Chicago, Kansas City, and Dallas. Chicago noted that the inventory of homes for sale is at a record low. In the Philadelphia, Cleveland, Kansas City, and San Francisco Districts, builders continued to face a scarcity of high-skilled trade workers. Boston, New York, Philadelphia, Cleveland, Richmond, and Chicago indicated that multifamily construction continued to experience moderate to strong growth, with strength concentrated in the apartment segment. Vacancy rates declined across most Districts.Overall this was similar to the previous beige book with economic activity increasing at a "modest to moderate" pace.
Commercial real estate activity remained stable or improved slightly across many Districts. Philadelphia, Cleveland, Richmond, Chicago, St. Louis, and Minneapolis all saw gains in industrial construction, while Boston, Chicago, and St. Louis cited a rise in hotel construction. The technology sector drove demand for commercial real estate in the San Francisco District, and Cleveland saw gains in affordable housing and shale-gas-related activity. The outlook of market participants is for continued improvement in the Philadelphia, Atlanta, Kansas City, and Dallas Districts, while contacts were cautiously optimistic in Boston and Cleveland.
emphasis added
ISM Non-Manufacturing Index at 53.9 indicates slower expansion in November
by Calculated Risk on 12/04/2013 11:35:00 AM
Catching up ... the November ISM Non-manufacturing index was at 53.9%, down from 55.4% in October. The employment index decreased in October to 52.5%, down from 56.2% in October. Note: Above 50 indicates expansion, below 50 contraction.
From the Institute for Supply Management: November 2013 Non-Manufacturing ISM Report On Business®
Economic activity in the non-manufacturing sector grew in November for the 47th consecutive month, say the nation's purchasing and supply executives in the latest Non-Manufacturing ISM Report On Business®.
The report was issued today by Anthony Nieves, CPSM, C.P.M., CFPM, chair of the Institute for Supply Management™ Non-Manufacturing Business Survey Committee. "The NMI® registered 53.9 percent in November, 1.5 percentage points lower than October's reading of 55.4 percent. This indicates continued growth at a slower rate in the non-manufacturing sector. The Non-Manufacturing Business Activity Index decreased to 55.5 percent, which is 4.2 percentage points lower than the 59.7 percent reported in October, reflecting growth for the 52nd consecutive month, but at a slower rate. The New Orders Index decreased slightly by 0.4 percentage point to 56.4 percent, and the Employment Index decreased 3.7 percentage points to 52.5 percent, indicating growth in employment for the 16th consecutive month, but at a slower rate. The Prices Index decreased 3.9 percentage points to 52.2 percent, indicating prices increased at a slower rate in November when compared to October. According to the NMI®, 11 non-manufacturing industries reported growth in November. Respondents' comments for the most part indicate the non-manufacturing sector is maintaining a steady course of incremental growth and a positive outlook for the upcoming months."
emphasis added
 Click on graph for larger image.
This graph shows the ISM non-manufacturing index (started in January 2008) and the ISM non-manufacturing employment diffusion index.
This was below the consensus forecast of 55.5% and indicates slower expansion in November than in October.
New Home Sales increased to 444,000 Annual Rate in October
by Calculated Risk on 12/04/2013 10:00:00 AM
Note: The New Home sales reports for September and October were both released today (delayed due to government shutdown).
The Census Bureau reports New Home Sales in October were at a seasonally adjusted annual rate (SAAR) of 444 thousand, and sales in September were at a 354 thousand SAAR.
August sales were revised down from 421 thousand to 379 thousand, and July sales were revised down from 390 thousand to 373 thousand.
The first graph shows New Home Sales vs. recessions since 1963. The dashed line is the current sales rate.
"Sales of new single-family houses in October 2013 were at a seasonally adjusted annual rate of 444,000, according to estimates released jointly today by the U.S. Census Bureau and the Department of Housing and Urban Development. This is 25.4 percent above the revised September rate of 354,000 and is 21.6 percent above the October 2012 estimate of 365,000."
 Click on graph for larger image in graph gallery.
The second graph shows New Home Months of Supply.
The months of supply decreased in October to 4.9 months from 6.4 months in September.
The all time record was 12.1 months of supply in January 2009.
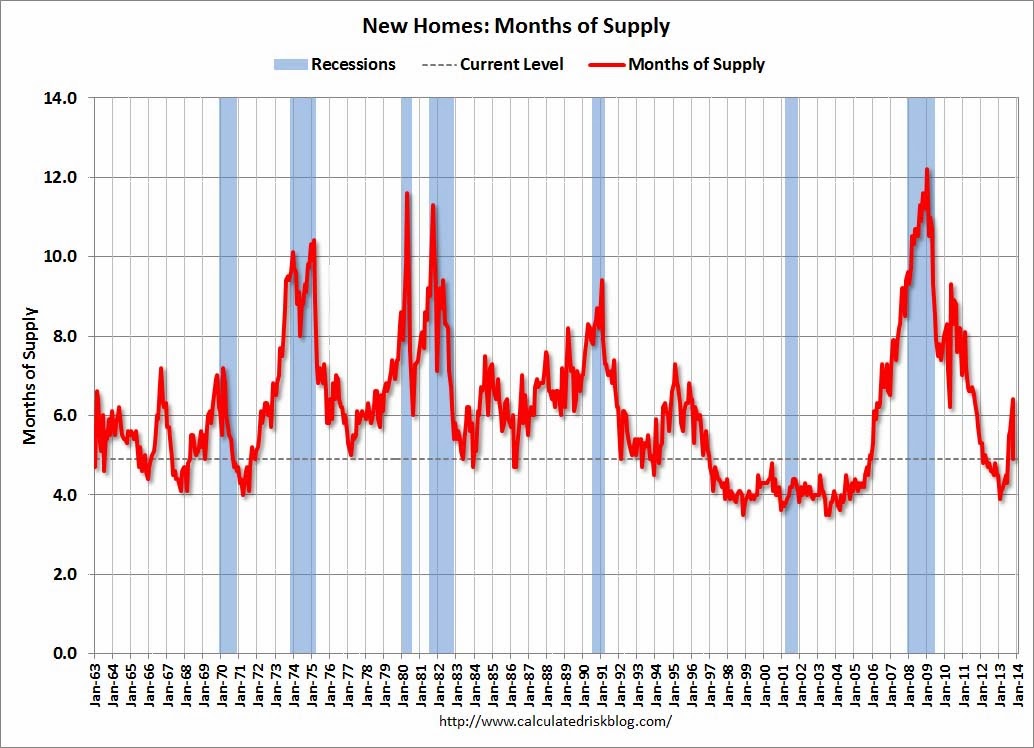 This is now in the normal range (less than 6 months supply is normal).
"The seasonally adjusted estimate of new houses for sale at the end of October was 183,000. This represents a supply of 4.9 months at the current sales rate."On inventory, according to the Census Bureau:
"A house is considered for sale when a permit to build has been issued in permit-issuing places or work has begun on the footings or foundation in nonpermit areas and a sales contract has not been signed nor a deposit accepted."Starting in 1973 the Census Bureau broke this down into three categories: Not Started, Under Construction, and Completed.
 This graph shows the three categories of inventory starting in 1973.
The inventory of completed homes for sale is near the record low. The combined total of completed and under construction is increasing, but still very low.
The last graph shows sales NSA (monthly sales, not seasonally adjusted annual rate).
In October 2013 (red column), 35 thousand new homes were sold (NSA). Last year 29 thousand homes were sold in October. The high for October was 105 thousand in 2005, and the low for October was 23 thousand in 2010.

This was above expectations of 425,000 sales in October, but there were significant downward revisions to prior months (as expected based on builder reports).
I'll have more later today - but no worries - the housing recovery will continue!


