by Calculated Risk on 12/04/2013 11:35:00 AM
Wednesday, December 04, 2013
ISM Non-Manufacturing Index at 53.9 indicates slower expansion in November
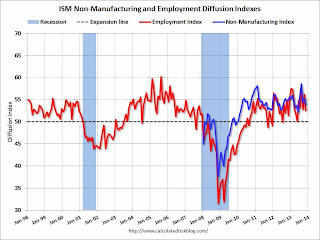
Catching up ... the November ISM Non-manufacturing index was at 53.9%, down from 55.4% in October. The employment index decreased in October to 52.5%, down from 56.2% in October. Note: Above 50 indicates expansion, below 50 contraction.
From the Institute for Supply Management: November 2013 Non-Manufacturing ISM Report On Business®
Economic activity in the non-manufacturing sector grew in November for the 47th consecutive month, say the nation's purchasing and supply executives in the latest Non-Manufacturing ISM Report On Business®.
The report was issued today by Anthony Nieves, CPSM, C.P.M., CFPM, chair of the Institute for Supply Management™ Non-Manufacturing Business Survey Committee. "The NMI® registered 53.9 percent in November, 1.5 percentage points lower than October's reading of 55.4 percent. This indicates continued growth at a slower rate in the non-manufacturing sector. The Non-Manufacturing Business Activity Index decreased to 55.5 percent, which is 4.2 percentage points lower than the 59.7 percent reported in October, reflecting growth for the 52nd consecutive month, but at a slower rate. The New Orders Index decreased slightly by 0.4 percentage point to 56.4 percent, and the Employment Index decreased 3.7 percentage points to 52.5 percent, indicating growth in employment for the 16th consecutive month, but at a slower rate. The Prices Index decreased 3.9 percentage points to 52.2 percent, indicating prices increased at a slower rate in November when compared to October. According to the NMI®, 11 non-manufacturing industries reported growth in November. Respondents' comments for the most part indicate the non-manufacturing sector is maintaining a steady course of incremental growth and a positive outlook for the upcoming months."
emphasis added
 Click on graph for larger image.
This graph shows the ISM non-manufacturing index (started in January 2008) and the ISM non-manufacturing employment diffusion index.
This was below the consensus forecast of 55.5% and indicates slower expansion in November than in October.


