 RSS Feed
 by Calculated Risk on 12/07/2012 08:30:00 AM
Friday, December 07, 2012
November Employment Report: 146,000 Jobs, 7.7% Unemployment Rate
From the BLS:
Total nonfarm payroll employment rose by 146,000 in November, and the unemployment rate edged down to 7.7 percent, the U.S. Bureau of Labor Statistics reported today.
...
Hurricane Sandy made landfall on the Northeast coast on October 29th, causing severe damage in some states. Nevertheless, our survey response rates in the affected states were within normal ranges. Our analysis suggests that Hurricane Sandy did not substantively impact the national employment and unemployment estimates for November.
...
The change in total nonfarm payroll employment for September was revised from +148,000 to +132,000, and the change for October was revised from +171,000 to +138,000.
 Click on graph for larger image.
There was uncertainty about this report because of Hurricane Sandy.
The headline number was above expectations of 80,000, but both September and October payroll growth was revised down.
The second graph shows the unemployment rate. The unemployment rate declined to 7.7%.
 The unemployment rate is from the household report.
The unemployment rate declined because of lower participation (a decline in the civilian labor force).
The third graph shows the employment population ratio and the participation rate.
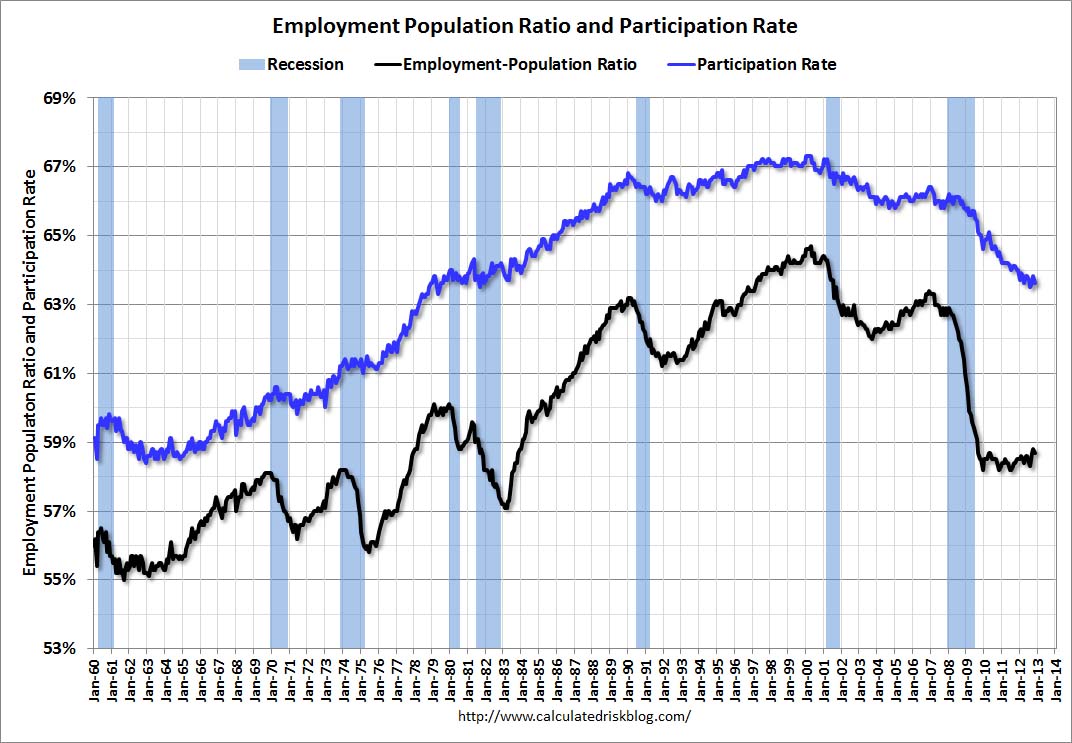 The Labor Force Participation Rate decreased to 63.6% in November (blue line. This is the percentage of the working age population in the labor force.
The participation rate is well below the 66% to 67% rate that was normal over the last 20 years, although most of the recent decline is due to demographics.
The Employment-Population ratio decreased to 58.7% in November (black line). I'll post the 25 to 54 age group employment-population ratio graph later.
 The fourth graph shows the job losses from the start of the employment recession, in percentage terms, compared to previous post WWII recessions. The dotted line is ex-Census hiring.
This shows the depth of the recent employment recession - worse than any other post-war recession - and the relatively slow recovery due to the lingering effects of the housing bust and financial crisis.
With all the uncertainty about the impact of Hurricane Sandy, this was a decent report, especially with the decline in the unemployment rate. However, negatives include the downward revisions to prior months, and the decline in the participation rate. I'll have much more later ...
Thursday, December 06, 2012
Friday: Employment Report, Consumer Sentiment
by Calculated Risk on 12/06/2012 08:26:00 PM
A couple of employment report preview articles, first from Patti Domm at CNBC: Short-Term Jobs Hit Expected From Sandy
The markets are ... likely to take the number in stride because the impact from the hurricane should be temporary and ultimately turn into a positive by adding jobs in construction and other areas. "If there was ever a number that people could look past, it would be this one," said Deutsche Bank chief U.S. economist Joseph LaVorgna.And from Neil Irwin at the WaPo: The jobs report Friday is going to be a giant mess
LaVorgna's forecast is at the low end. He expects just 25,000 jobs in total were created in November ...
[W]ith all [the] layers of uncertainty, it’s hard to imagine any number that would count as a total surprise. BNP Paribas, for example, expects payroll gains of only 25,000 positions, which would be the weakest in more than two years. Economist Julia Coronado notes that her week forecast is “entirely attributable to disruptions associated with Hurricane Sandy,” which could bode well for the longer-term, as the impacts of the storm on the job market seem to be reversing quickly.Irwin makes a good point; the state level data will be especially useful this month.
It will be possible to filter out the effects of the storm and glean what happened in the economy more broadly last month, but not until December 21. That is when the Labor Department releases state jobs numbers; a data set that is often overlooked, it will be parsed to filter out the effect of job losses in New Jersey, New York, and other affected places.
Friday economic releases:
• At 8:30 AM ET, the BLS will release the Employment Report for November. The consensus is for an increase of 80,000 non-farm payroll jobs in November; there were 171,000 jobs added in October. The impact from Hurricane Sandy will show up in the November report. The consensus is for the unemployment rate to increase to 8.0% in November, up from 7.9% in October.
• At 9:55 AM, the Reuter's/University of Michigan's Consumer sentiment index (preliminary for December) will be released. The consensus is for sentiment to increase slightly to 83.0.
• At 3:00 PM, the Consumer Credit for October will be released. The consensus is for credit to increase $10.0 billion.
Employment Situation Preview
by Calculated Risk on 12/06/2012 03:09:00 PM
On Friday, at 8:30 AM ET, the BLS will release the employment report for November. The consensus is for an increase of 80,000 non-farm payroll jobs in November, down sharply from the 171,000 jobs added in October. The decline is probably due to Hurricane Sandy. The consensus is for the unemployment rate to increase to 8.0%.
There are some interesting timing issues, from Phil Izzo at the WSJ: Jobs Report Likely to Tell Two Different Tales
In most months, the survey of households, which is used to calculate the unemployment rate, and the survey of businesses, which determines the number of jobs added or lost for the month, are both based on data from the week of the 12th of the month. But because the survey of households requires phone calls to thousands of homes, the government moved it up a week in November to avoid conflicting with Thanksgiving. The business survey stayed in its usual week. So in tomorrow’s report, the payroll survey will show how many people were working the week of Nov. 12, while the unemployment rate will be based on who was working the week of Nov. 5.Since Hurricane Sandy made landfall on October 29th, the household survey (conducted earlier) might be impacted more by the storm than the establishment survey.
Here is a summary of recent data:
• The ADP employment report showed an increase of 118,000 private sector payroll jobs in November. This was slightly below expectations. The ADP report hasn't been very useful in predicting the BLS report for any one month, although the methodology changed last month. In general this suggests employment growth in line with expectations.
• The ISM manufacturing employment index declined in November to 48.4%, down from 52.1%. A historical correlation between the ISM manufacturing employment index and the BLS employment report for manufacturing, suggests that private sector BLS reported payroll jobs for manufacturing decreased about 26,000 in November.
The ISM non-manufacturing (service) employment index decreased in November to 50.3%, down from 54.9% in October. A historical correlation between the ISM non-manufacturing employment index and the BLS employment report for services, suggests that private sector BLS reported payroll jobs for services increased about 69,000 in November.
Added together, the ISM reports suggests about 40,000 jobs added in November. Ouch.
• Initial weekly unemployment claims averaged about 400,000 in November. This was up sharply due to Hurricane Sandy.
For the BLS reference week (includes the 12th of the month), initial claims were at 416,000; the highest for a reference week this year.
• The final November Reuters / University of Michigan consumer sentiment index increased to 82.7, up slightly from the October reading of 82.6. This is frequently coincident with changes in the labor market and stock market, but also strongly related to gasoline prices and other factors. This might suggest some increase in employment, but the level still suggests a weak labor market.
• The small business index from Intuit showed 30,000 payroll jobs added, up from 5,000 in October. That is some improvement.
• And on the unemployment rate from Gallup: U.S. Unadjusted Unemployment Shoots Back Up
U.S. unemployment, as measured by Gallup without seasonal adjustment, was 7.8% for the month of November, up significantly from 7.0% for October. Gallup's seasonally adjusted unemployment rate is 8.3%, nearly a one-point increase over October's rate.Note: Gallup only recently has been providing a seasonally adjusted estimate for the unemployment rate, so use with caution (Gallup provides some caveats). So far the Gallup numbers haven't been very useful in predicting the BLS unemployment rate, but this does suggest an increase in November.
• Conclusion: The employment related data was pretty weak in November, and I expect the unemployment rate to increase and hiring to be weak; I think less than 80,000 jobs were added in November.
Fed's Q3 Flow of Funds: Household Mortgage Debt down $1.15 Trillion from Peak
by Calculated Risk on 12/06/2012 12:32:00 PM
The Federal Reserve released the Q3 2012 Flow of Funds report today: Flow of Funds.
According to the Fed, household net worth increased in Q3 compared to Q2 2011. Net worth peaked at $67.3 trillion in Q3 2007, and then net worth fell to $51.2 trillion in Q1 2009 (a loss of $16.1 trillion). Household net worth was at $64.8 trillion in Q3 2012 (up $13.6 trillion from the trough, but still down $2.5 trillion from the peak).
The Fed estimated that the value of household real estate increased $301 billion to $17.2 trillion in Q3 2012. The value of household real estate is still $5.5 trillion below the peak.
 Click on graph for larger image.
This is the Households and Nonprofit net worth as a percent of GDP.
This includes real estate and financial assets (stocks, bonds, pension reserves, deposits, etc) net of liabilities (mostly mortgages). Note that this does NOT include public debt obligations.
This ratio was relatively stable for almost 50 years, and then we saw the stock market and housing bubbles. The ratio has been trending up and increased in Q3.
 This graph shows homeowner percent equity since 1952.
Household percent equity (as measured by the Fed) collapsed when house prices fell sharply in 2007 and 2008.
In Q3 2012, household percent equity (of household real estate) was at 44.8% - up from Q2, and the highest since Q1 2008. This was because of both an increase in house prices in Q3 (the Fed uses CoreLogic) and a reduction in mortgage debt.
Note: about 30.3% of owner occupied households had no mortgage debt as of April 2010. So the approximately 52+ million households with mortgages have far less than 44.8% equity - and over 10 million have negative equity.
 The third graph shows household real estate assets and mortgage debt as a percent of GDP.
Mortgage debt declined by $86 billion in Q3. Mortgage debt has now declined by $1.15 trillion from the peak. Studies suggest most of the decline in debt has been because of foreclosures (or short sales), but some of the decline is from homeowners paying down debt (sometimes so they can refinance at better rates).
The value of real estate, as a percent of GDP, was up slightly in Q3 (as house prices increased), but is still near the lows of the last 30 years. However household mortgage debt, as a percent of GDP, is still historically very high, suggesting still more deleveraging ahead for households.
Update: Mortgage Debt Relief Act
by Calculated Risk on 12/06/2012 10:15:00 AM
The Mortgage Debt Relief Act of 2007 is set to expire at the end of 2012 and this could have a significant impact on short sales. Usually cancelled debt is considered income, but a provision of the Debt Relief Act allowed borrowers "to exclude certain cancelled debt on [a] principal residence from income. Debt reduced through mortgage restructuring, as well as mortgage debt forgiven in connection with a foreclosure, qualifies for the relief." (excerpt from IRS).
If this act isn't extended, short sales could decline sharply. From Paul Reid, a Redfin real estate agent, writes:
"In an area like Orange County, where I work, the REO inventory is [minuscule]. As of this morning, there are 104 ‘Active’ REOs on the MLS in the entire county. In comparison, there is a total ‘Active’ inventory of 3,504 homes and condos. The short sale ‘Active’ inventory is 335. Where the numbers really stick out is in the ‘Pending’ sales category. As of right now, there are 6,059 homes in Orange County in escrow. Of those, only 267 homes are REOs. More than half, 3,216 homes, are short sales. The remainder are standard sales. If you remove the relief act from the equation you would likely see a significant drop in the number of short sales, but because of how slow the REO process is, you wouldn’t likely see a proportionate increase in the number of REO listings."Right now there are a large number of pending short sales in many distressed areas. They all will not close before the end of the year.
There is a bipartisan push to have Congress extend the mortgage debt relief act. Here is a recent letter from several state attorneys general urging Congress to act.
As signatories to the National Mortgage Settlement, we the undersigned state attorneys general write to urge you to pass legislation extending tax relief for citizens who have mortgage debt canceled or forgiven because of financial hardship or a decline in housing values. Such legislation is currently included in Section 112 of the Family and Business Tax Cut Certainty Act of 2012 (S. 3521), which was recently passed out of the Senate Finance Committee with bipartisan support. We strongly urge Congress to extend this critical tax exclusion, which expires on December 31, 2012, so that distressed homeowners are not stuck with an unexpected tax bill or deterred from participating in this historic settlement.I expect this act to be extended, but you never know.
...
Under the federal Mortgage Debt Relief Act, in effect since 2007, mortgage debt that is forgiven after a foreclosure or short sale or through a loan modification provided to a homeowner in financial hardship may be excluded from a taxpayer’s calculation of taxable income. This exclusion only applies to mortgage debt forgiven on primary residences, not second homes. Unfortunately, this tax exclusion expires on December 31, 2012. Therefore, unless Congress acts, all of the remaining debt relief to be provided in 2013 under the National Mortgage Settlement, as well as other mortgage debt relief programs, will likely be considered taxable income. According to the Congressional Budget Office, failure to extend this tax exclusion will result in $1.3 billion in tax increases on the very families who can least afford it.
Weekly Initial Unemployment Claims decline to 370,000
by Calculated Risk on 12/06/2012 08:30:00 AM
The DOL reports:
In the week ending December 1, the advance figure for seasonally adjusted initial claims was 370,000, a decrease of 25,000 from the previous week's revised figure of 395,000. The 4-week moving average was 408,000, an increase of 2,250 from the previous week's revised average of 405,750.The previous week was revised up from 393,000.
The following graph shows the 4-week moving average of weekly claims since January 2000.

Click on graph for larger image.
The dashed line on the graph is the current 4-week average. The four-week average of weekly unemployment claims increased to 408,000.
This sharp increase in the 4 week average is due to Hurricane Sandy as claims increased significantly in NY, NJ and other impacted areas over the 4-week period (some of those areas saw another decline this week). Note the spike in 2005 was related to hurricane Katrina - we are seeing a similar impact, although on a smaller scale.
Weekly claims were lower than the consensus forecast.

And here is a long term graph of weekly claims:
We use the 4-week average to smooth out noise, but following an event like Hurricane Sandy, the 4-week average lags the event. It looks like the average should decline next week to around 390,000 and should continue to decline over the next few weeks.
Wednesday, December 05, 2012
Thursday: Weekly Unemployment Claims, Flow of Funds Report
by Calculated Risk on 12/05/2012 08:57:00 PM
"Laws, like sausages, cease to inspire respect in proportion as we know how they are made."John Godfrey Saxe, 1869.
Watching politician's public statements is definitely not inspiring. But here are a couple of articles, first from CNBC: Geithner: Ready to Go Over 'Cliff' If Taxes Don't Rise
Treasury Secretary Timothy Geither told CNBC Wednesday that Republicans are "making a little bit of progress" in "fiscal cliff" talks but said the Obama administration was "absolutely" ready to go over the cliff if the GOP doesn't agree to raise tax rates on the wealthy.I'm pretty sure that tax rates will increase on high earners, and this is why I think the agreement will not be reached until early January (so policitians can say they didn't increases taxes).
And from the WSJ: White House Unyielding on Debt Limit
The White House hardened its position that Congress should raise the U.S.'s borrowing limit without preconditions, adding an unpredictable new element into the high-stakes budget talks.I argued a year and a half ago, eliminating the debt ceiling would be the correct approach.
In a Wednesday speech to top corporate chiefs, President Barack Obama said he wouldn't negotiate with Republicans on this issue as he did in 2011.
"I want to send a very clear message to people here: We are not going to play that game next year," Mr. Obama said in remarks to the Business Roundtable, a trade group. He said Washington needs to "break that habit before it starts," referring to the way Republicans would like to use the debt limit to negotiate further spending cuts.
On the debt ceilng, it seems like Obama is taking a page from Ronald Reagan:
"Congress consistently brings the Government to the edge of default before facing its responsibility. This brinkmanship threatens the holders of government bonds and those who rely on Social Security and veterans benefits. Interest rates would skyrocket, instability would occur in financial markets, and the Federal deficit would soar. The United States has a special responsibility to itself and the world to meet its obligations. It means we have a well-earned reputation for reliability and credibility – two things that set us apart from much of the world."We don't know what else we be in the compromise, but it will obviously not be eliminating "unspecified deductions" - if deductions are eliminated, then they have to be specified (by definition). I still think a compromise will be reached, but probably not until early January. Right now the public statements are pretty fair apart.
Thursday economic releases:
• At 8:30 AM ET, The initial weekly unemployment claims report will be released. This is expected to show a further decline following the spike related to Hurricane Sandy. The consensus is for claims to decrease to 380 thousand from 393 thousand.
• At 12:00 PM, Q3 Flow of Funds Accounts of the United States from the Federal Reserve. Household mortgage debt probably declined further in Q3.
Lawler: On the upward trend in Real House Prices
by Calculated Risk on 12/05/2012 01:52:00 PM
CR NOTE: This is a very long piece from economist Tom Lawler on long term house prices. I've written about this before, The upward slope of Real House Prices, and Tom digs much deeper into the data!
From Tom Lawler:
One of the most widely abused home price series used by folks is the long-term “real” home price chart constructed by Robert Shiller in his “Irrational Exuberance” book. While he and others have sometimes characterized his “time series” of “real” home prices back to 1890 as being a good representation of “constant quality” home prices, in fact that is not even remotely the case. There are especially serious issues with the “older” home price series used by Dr. Shiller, with the “most troubling” being that used for the 1890-1934 period. Indeed, the authors of the book from which the home price index used by Dr. Shiller came from actually argued that this index did NOT reflect the behavior of “constant-quality” home price (with evidence to support that argument), and suggested using a materially different home price index. More on this point later.
When Dr. Shiller decided to explore home prices, and especially what appeared to be a housing “bubble,” he was “most surprised” that there were no “good” data going back prior to 1987 – with “good” defined as the Case-Shiller HPI.. But he wanted to “show” last decade’s house price runup in a long-term historical context. So he decided to take various home price sources, and attempt to construct a “long run” home price index by “concatenating” time series based on these sources.
Not surprisingly, from 1987 to the present Shiller used the “national” S&P/Case-Shiller home price index, which is a market-value weighted (using values from the various decennial Censuses, which unfortunately are not available for 2010. This “national” index is estimated to cover just over 70% of the US housing market.
From 1975 to 1987 Shiller used the “national” FHFA (formerly OFHEO) home price index, which is a unit-weighted index (using annually-updated estimates of states’ share of the housing stock) based on repeat sales transactions AND appraisal information on refinances of homes backing mortgages owned or guaranteed by Fannie Mae or Freddie Mac. Aside from the obvious “dataset” limitations (GSE only) and use of appraisals, the “unit-weighting” can result in materially different behavior than “value-weighting” over time.
From 1953 to 1975 Shiller used the home price index from the BLS’ Consumer Price Index, which was based on a sample of new home purchases financed with FHA-insured loans. It probably is not the case, however, that new home prices financed with FHA-insured loans, which often represent a very small sample of total home purchases, reflected trends in “overall” home prices. Indeed, the BLS characterized the data base used as representing “a small and specialized segment of the housing market and presents BLS with increasingly serious estimation problems . Here is an excerpt from a BLS paper discussing the 1983 change in the treatment of shelter costs for homeowners in the CPI.
LPS: Mortgage Delinquency Rates decreased in October
by Calculated Risk on 12/05/2012 12:20:00 PM
LPS released their Mortgage Monitor report for October today. According to LPS, 7.03% of mortgages were delinquent in October, down from 7.40% in September, and down from 7.58% in October 2011.
LPS reports that 3.61% of mortgages were in the foreclosure process, down from 3.87% in September, and down from 4.30% in October 2011.
This gives a total of 10.64% delinquent or in foreclosure. It breaks down as:
• 1,957,000 properties that are 30 or more days, and less than 90 days past due, but not in foreclosure.
• 1,543,000 properties that are 90 or more days delinquent, but not in foreclosure.
• 1,800,000 loans in foreclosure process.
For a total of 5,300,000 loans delinquent or in foreclosure in October. This is down from 5,640,000 last month, and down from 6,111,000 in October 2011.
This following graph shows the total delinquent and in-foreclosure rates since 1995.
 Click on graph for larger image.
From LPS:
The October Mortgage Monitor report released by Lender Processing Services (NYSE: LPS) showed a significant decline in foreclosure starts for the last two months – down 21.9 percent in October and almost 48 percent on a year-over-year basis – leading to a nearly 7 percent drop in overall foreclosure inventory. However, as LPS Applied Analytics Senior Vice President Herb Blecher explained, this fall-off in foreclosure starts is likely a temporary phenomenon, driven by new borrower notification requirements called for in the National Mortgage Settlement.
“LPS observed a drop-off in foreclosure starts in September that accelerated in October,” Blecher said. “This decline coincided with the implementation of new procedural changes outlined in the National Mortgage Settlement, which requires, among other things, that mortgage servicers provide written notice to borrowers 14 days prior to referring a delinquent loan to a foreclosure attorney. This has resulted in what is likely a temporary slowdown in foreclosure starts that we do not believe is indicative of a longer-term trend. However, we will continue to monitor this activity closely in the coming months.”
 The second graph shows a break down of home sales by conventional, foreclosure and short sale.
As the housing market slowly recovers, we'd expect distressed sales to decline and conventional sales to increase. This appears to be starting.
There is much more in the mortgage monitor.
ISM Non-Manufacturing Index increases in November
by Calculated Risk on 12/05/2012 10:00:00 AM
The November ISM Non-manufacturing index was at 54.7%, up from 54.2% in October. The employment index decreased in November to 50.3%, down from 54.9% in October. Note: Above 50 indicates expansion, below 50 contraction.
From the Institute for Supply Management: November 2012 Non-Manufacturing ISM Report On Business®
Economic activity in the non-manufacturing sector grew in November for the 35th consecutive month, say the nation's purchasing and supply executives in the latest Non-Manufacturing ISM Report On Business®.
The report was issued today by Anthony Nieves, C.P.M., CFPM, chair of the Institute for Supply Management™ Non-Manufacturing Business Survey Committee. "The NMI™ registered 54.7 percent in November, 0.5 percentage point higher than the 54.2 percent registered in October. This indicates continued growth at a slightly faster rate in the non-manufacturing sector. The Non-Manufacturing Business Activity Index registered 61.2 percent, which is 5.8 percentage points higher than the 55.4 percent reported in October, reflecting growth for the 40th consecutive month. The New Orders Index increased by 3.3 percentage points to 58.1 percent. The Employment Index decreased by 4.6 percentage points to 50.3 percent, indicating growth in employment for the fourth consecutive month but at a slower rate. The Prices Index decreased 8.6 percentage points to 57 percent, indicating prices increased at a slower rate in November when compared to October. According to the NMI™, 11 non-manufacturing industries reported growth in November. Respondents' comments are mixed; however, the majority of survey respondents reflect a cautious optimism about current economic conditions."
 Click on graph for larger image.
This graph shows the ISM non-manufacturing index (started in January 2008) and the ISM non-manufacturing employment diffusion index.
This was above the consensus forecast of 53.6% and indicates faster expansion in November than in October. The internals were mixed with the employment index down, but new orders up.


