 RSS Feed
 by Calculated Risk on 12/25/2010 08:50:00 AM
Saturday, December 25, 2010
Happy Holidays!
Happy Holidays and Merry Christmas to all!
• First some news: From the WSJ: China Raises Rates Amid Inflation Fight
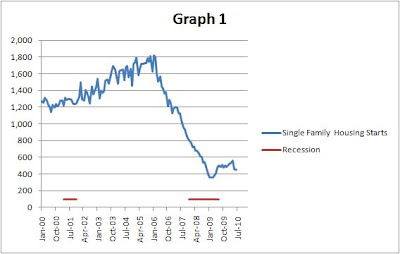
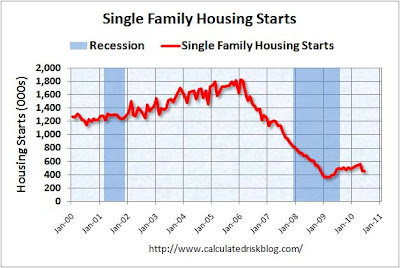
The People's Bank of China said Saturday that effective Sunday, it will raise the one-year yuan lending rate by a quarter of a percentage point to 5.81% from 5.56% ...• For your enjoyment, here are the galleries of most of the graphs I post. The Galleries are grouped by Employment, New Home Sales, Existing Home Sales, Housing (like starts), Manufacturing, GDP, and much more. There are tabs for each gallery at the top.
Clicking on a tab will load a gallery. Then thumbnails will appear below the main graph for all of the graphs in the selected gallery. Clicking on the thumbnails will display each graph. Enjoy!
• And a little gift ... a common question, using excel, is how do you get from this:
Thanks to all. Happy Holidays!
Friday, December 24, 2010
Question #8 for 2011: Europe and the Euro
by Calculated Risk on 12/24/2010 06:15:00 PM
Last weekend I posted some questions for next year: Ten Economic Questions for 2011. I'll try to add some predictions, or at least some thoughts for each question - working backwards - before the end of year.
8) Europe and the Euro: What will happen in Europe? When will the next blowup happen? How much of a drag will the problems in Europe have on U.S. growth?
The situation in Europe is fluid. Just look at the bond yields - Greece, Ireland, Portugal, Spain - all near record highs. It seems the question is when, not if, another "blowup" will happen. By blowup, I mean another set of emergency weekend meetings, and another Sunday "bailout" announced.
The European Financial Stability Facility (EFSF) is large enough to handle Portugal, but that is about it. So I guess that means Portugal is next.
Michael Pettis offered some thoughts on 2011, and he focused on Europe: In 2011, the euro zone will hang together or hang separately
DURING 2011 Europe should confront and decide the issue of fiscal union. If it chooses union, the euro will survive. If not, the euro will almost certainly break up. 2011 is important because in most European countries the leaders of all the major political parties tend to be emotionally and ideologically committed to the euro project.So Pettis thinks 2011 is the make or break year for the euro. Either way some countries will probably eventually default (haircuts for the bond holders).
However over the next two to three years as the debate over how to apportion the costs of the necessary adjustments intensifies—should workers pay in the form of wage deflation and rising unemployment? should countries abandon the euro and default, and so force the adjustment costs onto creditors? should taxes be raised or expenditures slashed, and which ones?—the political consensus will break apart and domestic politics will become increasingly unstable. In that case there will be almost no way to avert defaults and currency break up.
Note: Some Investor Guy wrote a great Sovereign Debt Series earlier this year covering a history of defaults and reviewing some possible scenarios.
Although my crystal ball is real cloudy on Europe, I think:
• The euro will somehow survive another year without losing any countries.
• The next blowup will be in the first couple of months. There is another round of stress tests scheduled for February, although there is still no agreement on criteria.
• There are two main channels that could impact the U.S. economy: trade, and financial spillover / credit tightening. The impact on trade will probably be minimal, even if the euro falls sharply against the dollar (a small percentage of U.S. GDP is from exports to Europe (edit)). The financial channel is much more of an unknown, and there is significant downside risk.
Ten Questions:
• Question #1 for 2011: House Prices
• Question #2 for 2011: Residential Investment
• Question #3 for 2011: Delinquencies and Distressed house sales
• Question #4 for 2011: U.S. Economic Growth
• Question #5 for 2011: Employment
• Question #6 for 2011: Unemployment Rate
• Question #7 for 2011: State and Local Governments
• Question #8 for 2011: Europe and the Euro
• Question #9 for 2011: Inflation
• Question #10 for 2011: Monetary Policy
Hotels: RevPAR up 14% compared to same week in 2009
by Calculated Risk on 12/24/2010 02:51:00 PM
A weekly update on hotels from HotelNewsNow.com: STR: US performance for week ending 18 Dec.
In year-over-year measurements, the industry’s occupancy rose 9.4 percent to 46.5 percent, average daily rate increased 4.1 percent to US$91.66, and revenue per available room went up 14.0 percent to US$42.61.The following graph shows the four week moving average for the occupancy rate by week for 2008, 2009 and 2010 (and a median for 2000 through 2007).
 Click on graph for larger image in new window.
Notes: the scale doesn't start at zero to better show the change. The graph shows the 4-week average, not the weekly occupancy rate.
On a 4-week basis, occupancy is up 7.3% compared to last year and 3.3% below the median for 2000 through 2007. RevPAR (revenue per available room) was up 7.7% compared to the same week two years ago (in 2008).
This is the slow season for hotels, and the key will be if business travel picks up early next year.
Data Source: Smith Travel Research, Courtesy of HotelNewsNow.com
Update on Personal Saving Rate
by Calculated Risk on 12/24/2010 11:38:00 AM
According to the BEA, the personal saving rate declined in November to 5.3%:
Personal saving -- DPI less personal outlays -- was $614.8 billion in November, compared with $622.8 billion in October. Personal saving as a percentage of disposable personal income was 5.3 percent in November, compared with 5.4 percent in October.
 Click on graph for larger image in graph gallery.
This graph shows the saving rate starting in 1959 (using a three month trailing average for smoothing) through the November Personal Income report.
When the recession began, I expected the saving rate to rise to 8% or more. With a rising saving rate, consumption growth would be below income growth. But that 8% rate was just a guess.
It is possible the saving rate has peaked, or it might rise a little further, but either way most of the adjustment has already happened and consumption will probably mostly keep pace with income growth next year.
Home Sales: Distressing Gap
by Calculated Risk on 12/24/2010 08:45:00 AM
Thanks to everyone for reading and providing me feedback!
Here is an update to a graph I've been posting for several years. This graph shows existing home sales (left axis) and new home sales (right axis) through November. This graph starts in 1994, but the relationship has been fairly steady back to the '60s. Then along came the housing bubble and bust, and the "distressing gap" appeared (due mostly to distressed sales).
 Click on graph for larger image in new window.
Initially the gap was caused by the flood of distressed sales. This kept existing home sales elevated, and depressed new home sales since builders couldn't compete with the low prices of all the foreclosed properties.
The two spikes in existing home sales were due primarily to the homebuyer tax credits (the initial credit in 2009, followed by the 2nd credit in 2010). There were also two smaller bumps for new home sales related to the tax credits.
Note: it is important to note that existing home sales are counted when transactions are closed, and new home sales are counted when contracts are signed. So the timing of sales is different.
In a few years - when the excess housing inventory is absorbed and the number of distressed sales has declined significantly - I expect existing home-to-new home sales to return to this historical relationship.
I've guessed before at the eventual levels: The median turnover for existing homes is just over 6% of all owner occupied homes per year, and with about 75 million owner occupied homes that would suggest close to 5 million sales per year (no one should expect existing home sales to be over 7 million units per year any time soon!). And that would suggest new home sales at just over 800 thousand per year when the market eventually recovers (not 1.2 or 1.3 million per year).
Best to all!
Thursday, December 23, 2010
Repeat: Merle Hazard "Inflation or Deflation"
by Calculated Risk on 12/23/2010 11:13:00 PM
A little music. This is a repeat from last year, but the debate goes on ...
Earlier:
• Comments on November Personal Income and Outlays Report
• New Home Sales weak in November
Misc: Europe, Consumer Sentiment, and more
by Calculated Risk on 12/23/2010 06:09:00 PM
Note: I'll be posting some tomorrow, and will be on a normal schedule next week.
• A couple of European stories ...
From Reuters: Fitch cuts Portugal rating one notch on debt levels
From Bloomberg: Hungary's Credit Rating Cut by Fitch on Budget; Debt Grade Nears `Abyss'
• From John Carney at CNBC: Bank of America Loses Key Battle In Mortgage Fraud Fight(ht Erik)
A New York court ruled yesterday that a bond insurer claiming Bank of America’s Countrywide unit fraudulently induced it to insure $21 billion of mortgage-backed securities can use statistical sampling to prove its case.• Earlier, the final Reuters / University of Michigan consumer sentiment index was released. The index increased to 74.5 in December from 71.6 in November (preliminary was 74.2).
 Click on graph for larger image in graphics gallery.
This is the highest level since June 2010, but sentiment is still at levels usually associated with a recession - and sentiment is well below the pre-recession levels.
In general consumer sentiment is a coincident indicator.
Earlier:
• Comments on November Personal Income and Outlays Report
• New Home Sales weak in November
Lawler: Overall Housing Stock Growth Likely to Slow Even Further in 2011
by Calculated Risk on 12/23/2010 02:54:00 PM
From economist Tom Lawler: Overall Housing Stock Growth Likely to Slow Even Further in 2011
Given recent and likely first half housing starts numbers, it seems highly likely that the growth in the US housing stock – which this year was the slowest in US history – will slow even further in 2011, even if housing starts begin to increase next year. Generally there is an average 7-8 month lag between SF housing starts are SF housing completions, and for MF housing starts the average lag is a little over a year. Given what housing starts have done, and given near-term indicators point to low levels of new housing production in the early part of next year, it seems highly likely that overall housing completions will be down in 2011.
 This graph shows the total overall housing production by year including single family, multi-family and manufactured housing - and Lawler's projection for 2011. Graph Credit: Tom Lawler
While final numbers are not yet in, overall [2010] housing completions plus manufactured housing placements probably will total around 696,000 or so. While there ARE no good timely data on how many homes were on net lost due to demolition, obsolescence, net conversions, etc., past data suggest that somewhere in the range of 300,000 to 325,000 homes were lost this way – implying growth in the housing stock in 2010 (EOY to EOY) of around 371,000 to 396,000. Next year I estimate that housing completions plus MH placements will total around 630,000, implying growth in the housing stock of around 300,000 to 330,000. If the labor market improves and household growth can just move back to 1.1 million a year or so, the combination of faster household growth and de minimus housing-stock growth would put a major dent in the excess supply of housing.CR comments:
For some unknown reason, many housing “analysts” who talk about housing “supply” (shadow inventory, listings, etc.) do not even MENTION the outlook for the supply of the aggregate housing stock!!!!!!!
• Lawler makes an important point: the number of units added to the housing stock next year will be very low, and this means the excess supply will probably be significantly reduced. Of course this also depends on household formation - and that means jobs. (note: I usually estimate demolitions around 200,000 per year - Lawler is using 300,000+ per year.)
• When we discuss residential investment and real GDP growth in 2011, we are talking about growth from the levels at the end of 2010. Even though the overall housing production might be lower in 2011 (per Lawler's forecast), residential investment will probably make a positive contribution to GDP growth for the first time since 2005.
Earlier:
• Comments on November Personal Income and Outlays Report
• New Home Sales weak in November
Comments on November Personal Income and Outlays Report
by Calculated Risk on 12/23/2010 11:58:00 AM
The BEA released the Personal Income and Outlays report for November this morning.
Personal income increased $42.3 billion, or 0.3 percent ... Personal consumption expenditures (PCE) increased $43.3 billion, or 0.4 percent.The following graph shows real Personal Consumption Expenditures (PCE) through November (2005 dollars). Note that the y-axis doesn't start at zero to better show the change.
...
Real PCE -- PCE adjusted to remove price changes -- increased 0.3 percent in November, compared with an increase of 0.5 percent in October.
 Click on graph for large image.
The quarterly change in PCE is based on the change from the average in one quarter, compared to the average of the preceding quarter.
The two-month method of estimating real PCE growth for Q4 (a fairly accurate method), suggests real PCE growth of 4.3% in Q4! So this looks like a pretty strong quarter for growth in personal consumption. The last time real PCE grew at more than 4% was in 2006.
Also personal income less transfer payments increased again in November. This increased to $9,305 billion (SAAR, 2005 dollars) from $9,282 billion in October. This measure had stalled out over the summer.
 This graph shows real personal income less transfer payments as a percent of the previous peak. This has been slow to recover - and is still 4.5% below the previous peak - but personal income less transfer payments is growing again.
Some of the increase in spending came from a decline in the personal saving rate, but overall this was a positive report and suggests solid GDP growth in Q4 (3% or higher).
New Home Sales weak in November
by Calculated Risk on 12/23/2010 10:00:00 AM
The Census Bureau reports New Home Sales in November were at a seasonally adjusted annual rate (SAAR) of 290 thousand. This is up from a revised 275 thousand in October.
 Click on graph for larger image in new window.
The first graph shows monthly new home sales (NSA - Not Seasonally Adjusted or annualized).
Note the Red columns for 2010. In November 2010, 21 thousand new homes were sold (NSA). This is a new record low for November.
The previous record low for the month of November was 26 thousand in 1966 and 2009; the record high was 86 thousand in November 2005.
 The second graph shows New Home Sales vs. recessions since 1963. The dashed line is the current sales rate.
Sales of new single-family houses in November 2010 were at a seasonally adjusted annual rate of 290,000 ... This is 5.5 percent (±16.2%)* above the revised October rate of 275,000, but is 21.2 percent (±13.3%) below the November 2009 estimate of 368,000And another long term graph - this one for New Home Months of Supply.
 Months of supply decreased to 8.2 in November from 8.8 in October. The all time record was 12.4 months of supply in January 2009. This is still high (less than 6 months supply is normal).
The seasonally adjusted estimate of new houses for sale at the end of November was 197,000. This represents a supply of 8.2 months at the current sales rate.
 The final graph shows new home inventory.
 The 290 thousand annual sales rate for November is just above the all time record low in August (274 thousand). This was the weakest November on record and below the consensus forecast of 300 thousand.
This was another very weak report.


