 RSS Feed
 by Calculated Risk on 12/10/2010 03:52:00 PM
Friday, December 10, 2010
Under 35: Living with Parents vs. Homeownership rate
This interesting graph is from economist Tom Lawler comparing the percent of 24-34 year olds living at home vs. the under 35 year old homeownership rate ...
There is a clear inverse relationship, and this suggests some pent up demand for housing units when the employment picture improves (although the demand could be for rental units).
 No larger image.
The Pain in Spain
by Calculated Risk on 12/10/2010 01:13:00 PM
Just an update ... the yield on Spain's 10-year bond is rising again.
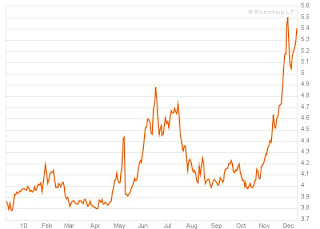 This graph from Bloomberg shows the yield for Spain's 10-year bond over the last year. The yield was up to 5.4% today, just below the peak of 5.5% in late November.
The bond yields declined in July following the European bank stress tests, but most investors have lost confidence in those tests - and another round will be conducted early next year. But will the bond markets wait?
The yield on Portugal's 10-year bond is up to 6.27%.
Consumer Sentiment increases in December
by Calculated Risk on 12/10/2010 09:55:00 AM
The preliminary Reuters / University of Michigan consumer sentiment index increased to 74.2 in December from 71.6 in November.
 Click on graph for larger image in graphics gallery.
This was above the consensus forecast of 72.5.
This is the highest level since June 2010, but sentiment is still at levels usually associated with a recession - and sentiment is well below the pre-recession levels.
In general consumer sentiment is a coincident indicator.
Trade Deficit decreases in October
by Calculated Risk on 12/10/2010 08:30:00 AM
The Census Bureau reports:
[T]otal October exports of $158.7 billion and imports of $197.4 billion resulted in a goods and services deficit of $38.7 billion, down from $44.6 billion in September, revised. October exports were $4.9 billion more than
September exports of $153.8 billion. October imports were $0.9 billion less than September imports of $198.4 billion.
 Click on graph for larger image.
The first graph shows the monthly U.S. exports and imports in dollars through October 2010.
After trade bottomed in the first half of 2009, imports increased much faster than exports. October exports were $4.9 billion more than in September and are at the highest level since August 2008.
The second graph shows the U.S. trade deficit, with and without petroleum, through October.
 The blue line is the total deficit, and the black line is the petroleum deficit, and the red line is the trade deficit ex-petroleum products.
The petroleum deficit decreased slightly in September - even with higher prices - and the trade deficit with China decreased (NSA).
After stalling over the summer, it appears exports are growing again. I expect the dollar volume of oil imports to rise over the next couple of months since oil prices have increased sharply since October.
Thursday, December 09, 2010
Tax Bill to add $857 Billion to Debt
by Calculated Risk on 12/09/2010 11:10:00 PM
From Bloomberg: Senate Tax-Cut Extension Plan Would Add $857 Billion to Debt
The congressional Joint Committee on Taxation, which estimates the revenue effects of tax legislation, said the provisions would cost the government $801.3 billion in forgone revenue over 10 years. Extending unemployment benefits for 13 months, another feature of the package, would cost $56 billion, the Obama administration has said.It is important to remember the Joint Committee on Taxation assumed all the provisions will end as scheduled; the payroll tax cut after one year, and the other tax cuts after two years. That seems very unlikely, so the actual cost will be much much higher. As an example, if the tax cut for high income earners stays in place for the next decade that will add $700 billion alone to the debt!
Also, the vast majority of the impact is from extending the Bush tax cuts.
Building Costs after the Bust
by Calculated Risk on 12/09/2010 06:54:00 PM
Jeff Collins at the OC Register has some numbers: Builders benefit from cost savings
Builders say construction costs are down 15 to 25 percent.This is definitely low end construction at $50 to $70 per sq ft excluding land and entitlements.
That translates into an average cost of $100,000 to $140,000 for just the "sticks and bricks" (without land) for a modest, 2,000-square-foot house.
That same house cost $140,000 to $190,000 to build during the peak of the housing boom just four years ago.
Collins notes that most of the savings has come from labor costs:
"A typical laborer used to make between $150 and $180 a day," observed [Scott McKernan, president of Joseph Holt Plastering in Corona]. "Now (he or she is) making $60."
...
Price drops for materials like lumber and drywall have helped some, but not much, industry officials say. ... Ganahl Lumber's purchasing Vice President Pete Meichtry says that overall material costs are down – at best – 5 to 10 percent.
Hotels: RevPAR up 5.3% compared to same week in 2009
by Calculated Risk on 12/09/2010 04:20:00 PM
A weekly update on hotels from HotelNewsNow.com: STR: Orlando leads weekly performance
Overall, the U.S. hotel industry’s occupancy increased 4.7% to 49.9%, ADR was up 0.5% to US$96.87, and RevPAR ended the week up 5.3% to US$48.31.The following graph shows the four week moving average for the occupancy rate by week for 2008, 2009 and 2010 (and a median for 2000 through 2007).
 Click on graph for larger image in new window.
Notes: the scale doesn't start at zero to better show the change. The graph shows the 4-week average, not the weekly occupancy rate.
On a 4-week basis, occupancy is up 7.8% compared to last year and 4.6% below the median for 2000 through 2007.
Note: Last week RevPAR (revenue per available room) was up compared to the same week two years ago (in 2008) for the first time this year. This week RevPAR is down 5.9% compared to 2008.
Data Source: Smith Travel Research, Courtesy of HotelNewsNow.com
Q3 Flow of Funds: Household Real Estate assets declined $650 Billion in Q3 2010
by Calculated Risk on 12/09/2010 01:14:00 PM
The Federal Reserve released the Q3 2010 Flow of Funds report this morning: Flow of Funds.
According to the Fed, household net worth is now off $11 Trillion from the peak in 2007, but up $5.8 trillion from the trough in Q1 2009.
The Fed estimated that the value of household real estate fell $684 billion to $16.55 trillion in Q3 2010, from $17.2 trillion in Q2 2010.
 Click on graph for larger image in graph gallery.
This is the Households and Nonprofit net worth as a percent of GDP.
This includes real estate and financial assets (stocks, bonds, pension reserves, deposits, etc) net of liabilities (mostly mortgages). Note that this does NOT include public debt obligations.
Note that this ratio was relatively stable for almost 50 years, and then we saw the stock market and housing bubbles.
 This graph shows homeowner percent equity since 1952.
Household percent equity (as measured by the Fed) collapsed when house prices collapsed in 2007 and 2008.
In Q3 2010, household percent equity (of household real estate) declined to 38.8% as the value of real estate assets fell by almost $650 billion.
Note: something less than one-third of households have no mortgage debt. So the approximately 50+ million households with mortgages have far less than 38.8% equity.
 The third graph shows household real estate assets and mortgage debt as a percent of GDP.
Mortgage debt declined by $65 billion in Q3. Mortgage debt has now declined by $488 billion from the peak. Studies suggest most of the decline in debt has been because of defaults.
Assets prices, as a percent of GDP, have fallen significantly and are not far above historical levels. However household mortgage debt, as a percent of GDP, is still historically very high, suggesting more deleveraging ahead for households.
Freddie Mac: Mortgage Rates rise to Five-Month High
by Calculated Risk on 12/09/2010 11:29:00 AM
From Bloomberg: Mortgage Rates for U.S. Loans Jump to Five-Month High
U.S. mortgage rates surged to a five- month high ... The average rate for a 30-year fixed loan increased to 4.61 percent in the week ended today from 4.46 percent, Freddie Mac said in a statement.These rates are still low, but this increase will significantly impact refinance activity.
The average rate for a 30-year loan climbed for a fourth straight week after falling to 4.17 percent last month, the lowest in records dating to 1971.
Weekly Initial Unemployment Claims decline to 421,000
by Calculated Risk on 12/09/2010 08:30:00 AM
The DOL reports on weekly unemployment insurance claims:
In the week ending Dec. 4, the advance figure for seasonally adjusted initial claims was 421,000, a decrease of 17,000 from the previous week's revised figure of 438,000. The 4-week moving average was 427,500, a decrease of 4,000 from the previous week's revised average of 431,500.
 Click on graph for larger image in new window.
This graph shows the 4-week moving average of weekly claims since January 2000.
The dashed line on the graph is the current 4-week average. The four-week average of weekly unemployment claims decreased this week by 4,000 to 427,500.
This is the lowest level for the 4-week moving average since August 2008. The level is still high, but the decline in the 4-week average is good news.


