 RSS Feed
 by Calculated Risk on 10/28/2010 01:42:00 PM
Thursday, October 28, 2010
Update: PIMCO's Bill Gross has called end of bond rally before
Yesterday I mentioned that Bill Gross was calling the end "of a great 30-year bull market in bonds". I thought he was changing his view, but this isn't the first time (ht Erik):
From Bloomberg on March 27, 2010: Pimco’s Bill Gross Says Bonds Have Seen Best Days
“Bonds have seen their best days,” Gross said in a Bloomberg Radio interview ... Yields on two-year U.S. Treasury notes are likely to rise to 1.25 percent to 1.5 percent from 1.08 percent in the next year as the economy strengthens and the Federal Reserve begins to increase interest rates, Gross said.On March 26, 2010 the Ten Year Treasury yield was 3.86% (now 2.65%)
And from Reuters in June 2007: Pimco's Gross says he's now a "bear market manager"
Gross forecast that benchmark Treasury yields will range higher than previously thought, prompting him to acknowledge he is now a "bear market manager" after a quarter of a century as the global bond market's most powerful bull.On June 7, 2007, the ten year Treasury yield was 5.1%.
So Gross has called the end of the bond rally before. Nevermind.
The end of the "bull market in bonds" really depends on if the economy strengthens, and I don't see a pickup in economic growth any time soon.
Regional Fed Manufacturing Surveys still show "moderate" expansion in October
by Calculated Risk on 10/28/2010 11:00:00 AM
The Kansas City Fed released their October manufacturing survey this morning:
Tenth District manufacturing activity continued to expand moderately in October, and producers were increasingly optimistic about future activity.This was the last of the regional Fed surveys for October.
...
The net percentage of firms reporting month-over-month increases in production in October was 10, down from 14 in September ... the new orders index jumped from 9 to 16, its highest level since early 2007, and the employment index also edged higher [to -1].
The following graph compares the regional Fed surveys with the ISM manufacturing survey, including the Kansas City survey released this morning:
 Click on graph for larger image in new window.
For this graph I averaged the New York and Philly Fed surveys (dashed green, through October), and averaged five Fed surveys (blue) including New York, Philly, Richmond, Dallas and Kansas City.
The Institute for Supply Management (ISM) PMI (red) is through September (right axis).
Although the internals were mixed in the regional Fed surveys, this graph suggests the ISM index will still show expansion in October. The ISM Manufacturing index will be released on Monday November 1st.
Weekly Initial Unemployment Claims decrease
by Calculated Risk on 10/28/2010 08:30:00 AM
The DOL reports on weekly unemployment insurance claims:
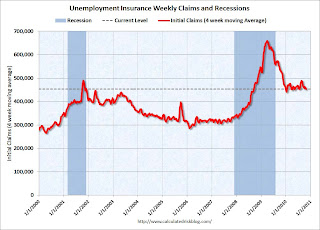
In the week ending Oct. 23, the advance figure for seasonally adjusted initial claims was 434,000, a decrease of 21,000 from the previous week's revised figure of 455,000. The 4-week moving average was 453,250, a decrease of 5,500 from the previous week's revised average of 458,750.
 Click on graph for larger image in new window.
This graph shows the 4-week moving average of weekly claims since January 2000.
The dashed line on the graph is the current 4-week average. The four-week average of weekly unemployment claims decreased this week by 5,500 to 453,250.
This is the lowest level for weekly claims and the 4-week average since July, however the 4-week moving average has been moving sideways at an elevated level for almost a year - and that suggests a weak job market.
Wednesday, October 27, 2010
Report: Greece Falling Short of Rescue Package Deficit Goal
by Calculated Risk on 10/27/2010 10:28:00 PM
From Landon Thomas at the NY Times: Greece Said to Be Falling Short of Deficit-Cutting Goals
With economic conditions weaker than expected, tax revenue is coming up short of projections in parts of Europe.According to Bloomberg, the yield on the Greece 10-year bond jumped to 10.39% from 9.36% on Tuesday, and the yield on the Ireland 10-year bond increased to a new crisis closing high of 6.77%.
...
Greece ... looks as if it will run a budget deficit for 2010 greater than the 8.1 percent of gross domestic product it agreed to as part of a rescue package from the International Monetary Fund and the European Union ...
In Ireland, which is expecting its third consecutive year of economic contraction this year, the government says it will need an additional 15 billion euros in budget cuts to reduce its deficit from 32 percent of gross domestic product to 3 percent by 2014.
PIMCO's Gross: 30-year Bull Market in Bonds is Over
by Calculated Risk on 10/27/2010 06:46:00 PM
From PIMCO's Bill Gross: Run Turkey, Run
[W]hile next Wednesday’s [FOMC] announcement will carry our qualified endorsement, I must admit it may be similar to a Turkey looking forward to a Thanksgiving Day celebration.Gross has been a bond bull for as long as I can remember - I think even last year when many others were calling the end of the bond bull market.
...
Anyone for 1.10% 5-year Treasuries? Well, the Fed will buy them, but then what, and how will PIMCO tell the 500 billion investor dollars in the Total Return strategy and our equally valued 750 billion dollars of other assets that the Thanksgiving Day axe has finally arrived?
...
Ben Bernanke ... [y]ou are doing what you have to do, and it may or may not work. But either way it will likely signify the end of a great 30-year bull market in bonds ...
Freddie Mac: 90+ Day Delinquency Rate Declines Slightly in September
by Calculated Risk on 10/27/2010 03:59:00 PM
The following graph shows the Freddie Mac serious delinquency rate (loans that are "three monthly payments or more past due or in foreclosure"):
 Click on graph for larger image in new window.
Freddie Mac reports that the serious delinquency rate declined to 3.80% in September, from 3.83% in August.
Some of the rapid increase last year was probably because of foreclosure moratoriums, and distortions from modification programs because loans in trial mods were considered delinquent until the modifications were made permanent.
As modifications have become permanent, they are no longer counted as delinquent. Also, both Fannie Mae and Freddie Mac started foreclosing again (they have a record number of REOs) - and REO (real estate owned) is not counted in the delinquency rate.
The delinquency rate will probably start increasing again in October because of more foreclosure moratoriums, and possibly from falling house prices.
Home Sales: Distressing Gap Sept 2010
by Calculated Risk on 10/27/2010 12:24:00 PM
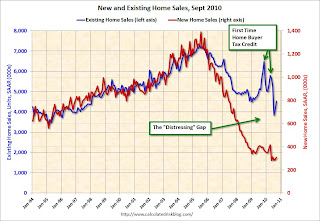
By request, here is an update - this graph shows existing home sales (left axis) and new home sales (right axis) through September. This graph starts in 1994, but the relationship has been fairly steady back to the '60s. Then along came the housing bubble and bust, and the "distressing gap" appeared (due partially to distressed sales).
Note: it is important to note that existing home sales are counted when transactions are closed, and new home sales are counted when contracts are signed. So the timing of sales is different.
 Click on graph for larger image in new window.
Initially the gap was caused by the flood of distressed sales. This kept existing home sales elevated, and depressed new home sales since builders couldn't compete with the low prices of all the foreclosed properties.
The two spikes in existing home sales were due primarily to the homebuyer tax credits (the initial credit last year, followed by the 2nd credit this year). There were also two smaller bumps for new home sales related to the tax credits.
Now, once again, the gap is mostly because of the continuing flood of distressed sales (both foreclosures and short sales). I expect that eventually this gap will be closed, however that will only happen after the huge overhang of existing inventory (especially distressed inventory) is significantly reduced.
New Home Sales increased slightly in September, still near record low
by Calculated Risk on 10/27/2010 10:00:00 AM
The Census Bureau reports New Home Sales in September were at a seasonally adjusted annual rate (SAAR) of 307 thousand. This is slightly higher than in August (288 thousand SAAR).
 Click on graph for larger image in new window.
The first graph shows monthly new home sales (NSA - Not Seasonally Adjusted or annualized).
Note the Red columns for 2010. In September 2010, 24 thousand new homes were sold (NSA). This is a new record low for September.
The previous record low for the month of September was 28 thousand in 1981; the record high was 95 thousand in September 2005.
 The second graph shows New Home Sales vs. recessions for the last 47 years. The dashed line is the current sales rate.
Sales of new single-family houses in September 2010 were at a seasonally adjusted annual rate of 307,000, according to estimates released jointly today by the U.S. Census Bureau and the Department of Housing and Urban Development. This is 6.6 percent (±16.9%)* above the revised August rate of 288,000, but is 21.5 percent (±13.3%) below the September 2009 estimate of 391,000.And another long term graph - this one for New Home Months of Supply.
 Months of supply decreased to 8.0 in September from 8.6 in August. The all time record was 12.4 months of supply in January 2009. This is still high (less than 6 months supply is normal).
The seasonally adjusted estimate of new houses for sale at the end of September was 204,000. This represents a supply of 8.0 months at the current sales rate.
 The final graph shows new home inventory.
 The 307 thousand annual sales rate for September is just above the all time record low in May (282 thousand). This was the weakest September on record.
New home sales are important for the economy and jobs - and this indicates that residential investment will be a sharp drag on GDP in Q3.
MBA: Mortgage Purchase Activity increases slightly
by Calculated Risk on 10/27/2010 07:57:00 AM
The MBA reports: Mortgage Applications Increase in Latest MBA Weekly Survey
The Refinance Index increased 3.0 percent from the previous week. The seasonally adjusted Purchase Index increased 3.9 percent from one week earlier.
...
The average contract interest rate for 30-year fixed-rate mortgages decreased to 4.25 percent from 4.34 percent, with points increasing to 1.0 from 0.81 (including the origination fee) for 80 percent loan-to-value (LTV) ratio loans. The 30-year contract rate matches the rate from the week ending October 1, 2010, which was the second lowest ever observed in this survey.
 Click on graph for larger image in new window.
This graph shows the MBA Purchase Index and four week moving average since 1990.
The four-week moving average of the purchase index is still 30% below the levels of April 2010, and is about at the levels of 1996. This suggests existing home sales will remain weak through the end of the year.
Tuesday, October 26, 2010
Report: Fed will probably use gradual approach for QE2
by Calculated Risk on 10/26/2010 11:21:00 PM
QE2 is coming. The only question is if the Fed will announce a fairly large amount of purchases on November 3rd (like $500 billion), or a somewhat smaller amount and revisit the purchases at each FOMC meeting. It sounds like the Fed might take the 2nd approach ...
From Jon Hilsenrath and Jonathan Cheng at the WSJ: Fed Gears Up for Stimulus
The central bank is likely to unveil a program of U.S. Treasury bond purchases worth a few hundred billion dollars over several months, a measured approach in contrast to purchases of nearly $2 trillion it unveiled during the financial crisis.This is the approach the NY Fed's EVP Brian Sack described earlier this month: Managing the Federal Reserve’s Balance Sheet
It is hard to call "a few hundred billion dollars" a gradual approach, but this is less than current expectations for the Nov 3rd FOMC announcement.


