 RSS Feed
 by Calculated Risk on 10/25/2010 08:16:00 PM
Monday, October 25, 2010
WSJ Survey: Housing Inventories up in 19 of 28 Markets Year-over-Year
From Nick Timiraos at the WSJ: Housing Gloom Deepens
The growing pessimism is attributed partly to rising inventory in many markets ... The Wall Street Journal's latest quarterly survey ... in 28 major metropolitan areas found inventories of unsold homes were up in 19 markets ... compared with a year ago ...I highlighted the 8.9% year-over-year inventory increase in the NAR report - a strong indicator of more house price declines to come, especially with the already high level of supply.
"We'll see some additional price declines," said David Berson, chief economist at PMI Group Inc ... "The gains we've seen can't be sustained given the current supply situation."
This survey from the WSJ shows that the inventory increases are fairly widespread. And that suggests that price declines will probably be widespread too. This morning CoreLogic noted that house prices declined in 78 out of the largest 100 metropolitan areas in their August report.
Tomorrow Case-Shiller will report on August house prices, and the expectations are for a slight decline in prices - and it will be interesting to see how many of the 20 Case-Shiller cities are showing price declines.
Misc: Expectations, Dallas Fed Manufacturing, HAMP and Foreclosure-Gate
by Calculated Risk on 10/25/2010 03:57:00 PM
Earlier posts on Existing Home sales:
Texas factory activity increased in October, according to business executives responding to the Texas Manufacturing Outlook Survey. The production index, a key measure of state manufacturing conditions, was positive for the second consecutive month and slightly higher than its September reading.So the headline number improved slightly, but the internals were weak.
Despite the rise in output, several other manufacturing activity indicators fell again. The new orders and shipments indexes were negative for the fifth consecutive month. The capacity utilization index dipped below zero, with more than one-quarter of respondents reporting a decrease.
...
Labor market indicators worsened slightly in October. Hours worked fell for the fourth consecutive month, and the employment index dipped back into negative territory ...
This means that for the median borrower, about 80% of the borrower's income went to servicing debt. And the median is 63.3% after the modification. So I expect the redefault rate to be high. Although Treasury is arguing the modifications are performing "well":
At nine months, nearly 90% of homeowners remain in a permanent modification, with 11% defaulted. Fewer than 16% of permanent modifications are 60+ days delinquent.With a median back end DTI after modification of 63.3%, I expect the redefault rate will move higher. Also here the October Housing Scorecard.
Before I address the specific topics of this conference, I would like to note that we have been concerned about reported irregularities in foreclosure practices at a number of large financial institutions. The federal banking agencies are working together to complete an in-depth review of practices at the largest mortgage servicing operations. We are looking intensively at the firms' policies, procedures, and internal controls related to foreclosures and seeking to determine whether systematic weaknesses are leading to improper foreclosures. We take violations of proper procedures seriously. We anticipate preliminary results of the review next month. In addition, Federal Reserve staff members and their counterparts at other federal agencies are evaluating the potential effects of these problems on the real estate market and financial institutions.
Bank of America... confirmed that it had discovered errors, including incorrect data and misspelled names, in the paperwork it has reviewed.
CoreLogic: House Prices Declined 1.2% in August
by Calculated Risk on 10/25/2010 01:41:00 PM
Notes: CoreLogic reports the year-over-year change. The headline for this post is for the change from July 2010 to August 2010. The CoreLogic HPI is a three month weighted average of June, July and August, and is not seasonally adjusted (NSA).
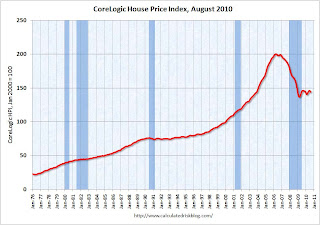
From CoreLogic: August Home Prices Declined 1.5 Percent Year Over Year
CoreLogic ... today released its Home Price Index (HPI) which shows that home prices in the U.S. declined for the first time this year. According to the CoreLogic HPI, national home prices, including distressed sales, declined 1.5 percent in August 2010 compared to August 2009 and increased by 0.6 percent in July 2010 compared to July 2009. Excluding distressed sales, year-over-year prices declined 0.4 percent in August 2010. ...
“Price declines are geographically expanding as 78 out of the largest 100 metropolitan areas are experiencing declines, up from 58 just one month ago” said Mark Fleming, chief economist for CoreLogic.
 Click on graph for larger image in new window.
 This graph shows the national CoreLogic HPI data since 1976. January 2000 = 100.
The index is down 1.5% over the last year, and off 28.2% from the peak.
The index is 5.4% above the low set in March 2009, and I expect to see a new post-bubble low for this index later this year or early in 2011. As Fleming noted, prices are falling in most areas now (unusually for the summer months).
Earlier posts on Existing Home sales:
Existing Home Inventory increases 8.9% Year-over-Year
by Calculated Risk on 10/25/2010 11:22:00 AM
Earlier the NAR released the existing home sales data for September; here are a couple more graphs ...
The first graph shows the year-over-year (YoY) change in reported existing home inventory and months-of-supply. Inventory is not seasonally adjusted, so it really helps to look at the YoY change.
 Click on graph for larger image in new window.
Although inventory decreased slightly from August 2010 to September 2010, inventory increased 8.9% YoY in September. This is the largest YoY increase in inventory since early 2008.
Note: Usually July is the peak month for inventory.
The year-over-year increase in inventory is very bad news because the reported inventory is already historically very high (around 4 million), and the 10.7 months of supply in September is far above normal.
And double digit months-of-supply suggests house prices will continue to fall.
 By request - the second graph shows existing home sales Not Seasonally Adjusted (NSA).
The red columns are for 2010. Sales for the last three months are significantly below the previous years, and sales will probably be well weak for the remainder of 2010.
The bottom line: Sales were weak in September - almost exactly at the levels I expected - and will continue to be weak for some time. Inventory is very high - and the significant year-over-year increase in inventory is very concerning. The high level of inventory and months-of-supply will put downward pressure on house prices.
September Existing Home Sales: 4.53 million SAAR, 10.7 months of supply
by Calculated Risk on 10/25/2010 10:00:00 AM
The NAR reports: September Existing-Home Sales Show Another Strong Gain
Existing-home sales, which are completed transactions that include single-family, townhomes, condominiums and co-ops, jumped 10.0 percent to a seasonally adjusted annual rate of 4.53 million in September from a downwardly revised 4.12 million in August, but remain 19.1 percent below the 5.60 million-unit pace in September 2009 when first-time buyers were ramping up in advance of the initial deadline for the tax credit last November.
...
Total housing inventory at the end of September fell 1.9 percent to 4.04 million existing homes available for sale, which represents a 10.7-month supply at the current sales pace, down from a 12.0-month supply in August.
 Click on graph for larger image in new window.
This graph shows existing home sales, on a Seasonally Adjusted Annual Rate (SAAR) basis since 1993.
Sales in September 2010 (4.53 million SAAR) were 10% higher than last month, and were 19.1% lower than September 2009 (5.6 million SAAR).
 The second graph shows nationwide inventory for existing homes.
According to the NAR, inventory decreased slightly to 4.04 million in September from August from 4.12 million in August. The all time record high was 4.58 million homes for sale in July 2008.
Inventory is not seasonally adjusted and there is a clear seasonal pattern with inventory increasing in the spring and into the summer. I'll have more on inventory later ...
 The last graph shows the 'months of supply' metric.
Months of supply decreased to 10.7 months in September from 12.0 months in August. This is extremely high and suggests prices, as measured by the repeat sales indexes like Case-Shiller and CoreLogic, will continue to decline.
Ignore the NAR spin and the median price! These fairly weak numbers are exactly what I expected.
The ongoing high level of supply - and double digit months-of-supply are the key stories. I'll have more ...
Chicago Fed: Economic activity slowed further in September
by Calculated Risk on 10/25/2010 08:30:00 AM
Note: This is a composite index based on a number of economic releases.
From the Chicago Fed: Index shows economic activity slowed further in September
Led by declines in production-related indicators, the Chicago Fed National Activity Index decreased to –0.58 in September from –0.49 in August.
...
The index’s three-month moving average, CFNAI-MA3, ticked down to –0.33 in September from –0.32 in August. September’s CFNAI-MA3 suggests that growth in national economic activity was below its historical trend. With regard to inflation, the amount of economic slack reflected in the CFNAI-MA3 suggests subdued inflationary pressure from economic activity over the coming year.
 Click on graph for larger image in new window.
This graph shows the Chicago Fed National Activity Index (three month moving average) since 1967. According to the Chicago Fed:
A zero value for the index indicates that the national economy is expanding at its historical trend rate of growth; negative values indicate below-average growth; and positive values indicate above-average growth.
Sunday, October 24, 2010
Short Sales vs. Foreclosures
by Calculated Risk on 10/24/2010 11:03:00 PM
Posted earlier:
Michael Powell at the NY Times looks at short sales and foreclosures: Owners Seek to Sell at a Loss, but Bankers Push Foreclosure
The article offers two explanations for why lenders seem to prefer foreclosures: 1) short sale fraud, and 2) some incentives might favor foreclosure.
From Powell:
[F]inancial incentives can push toward a foreclosure rather than a short sale. Servicers can reap high fees from foreclosures. And lenders can try to collect on private mortgage insurance.In a more normal environment, servicers can "reap high fees" from foreclosures, but in the current environment there is a less of an incentive (since investors are reviewing all expenses closely). And mortgage insurance is a definite stumbling block to some short sales. But there is little evidence of the banks sitting on REOs to avoid taking losses (there just aren't that many REOs on their balance sheets) - so I think that point is incorrect.
Some advocates and real estate agents also point to an April 2009 regulatory change in an obscure federal accounting law. The change, in effect, allowed banks to foreclose on a home without having to write down a loss until that home was sold. By contrast, if a bank agrees to a short sale, it must mark the loss immediately.
When I've spoken to lenders / servicers, short sale fraud is always the first thing they mention. There are all kinds of possible frauds - from non-arms length transactions (selling to friends or relatives), off the record kickbacks to the owner, and "flopping", where the agent presents an offer to the bank from a partner - even though the agents has received higher offers, and then the partner flips the house after the short sale splitting the profits with the agent.
Even with all these problems, and the long waits for buyers, short sales have increased significantly this year.
60 Minutes: Unemployment and the "99ers"
by Calculated Risk on 10/24/2010 08:19:00 PM
Posted earlier:
Here is a preview (here is the link if the embed doesn't work).
Not on preview, but one 99er was asked ...
Q: "What comes next?"
A: "The abyss"
Schedule for Week of Oct 24th
by Calculated Risk on 10/24/2010 01:27:00 PM
The previous post is the Summary for Week ending Oct 23rd
The key economic report for the coming week is the Q3 advance GDP report to be released on Friday. There are also three important housing reports to be released early in the week: Existing home sales on Monday, Case-Shiller house prices on Tuesday, and New Home sales on Wednesday.
CoreLogic House Price Index for August. This release will probably show further declines in house prices. The index is a weighted 3 month average for June, July and August.
Making Home Affordable Program (HAMP) for September and the “Housing Scorecard”
8:30 AM ET: Chicago Fed National Activity Index (September). This is a composite index of other data.
8:30 AM: Fed Chairman Bernanke, Welcoming Remarks at Mortgage Foreclosures and the Future of Housing Finance in Arlington, VA. I don't expect anything newsworthy from Bernanke, but there are a number of interesting topics at this two day conference on housing issues (see agenda at link).
10:00 AM: Existing Home Sales for September from the National Association of Realtors (NAR). The consensus is for an increase to 4.30 million on a Seasonally Adjusted Annual Rate (SAAR) in September from 4.13 million in August. Housing economist Tom Lawler is projecting 4.5 million SAAR. In addition to sales, the level of inventory and months-of-supply will be very important (since months-of-supply impacts prices). Months-of-supply should still be in double digits in September. Note: there will probably be no impact on September sales from the "robo-signer" foreclosure moratorium.
10:30 AM: Dallas Fed Manufacturing Survey for October. The Texas survey showed a slight expansion last month (at 4.0), and is expected to show a slight expansion again in October.
Various Fed Speeches: St. Louis Fed President Bullard (1:30 PM), NY Fed President Dudley (4:30 PM), and Kansas City Fed President Hoenig (8 PM) are all scheduled to speak.
9:00 AM: S&P/Case-Shiller Home Price Index for August. Although this is the August report, it is really a 3 month average of June, July and August. The consensus is for a slight decline in prices month-over-month in August.
10:00 AM: Richmond Fed Survey of Manufacturing Activity for October. The consensus is for the index to be flat after showing contraction (-2) last month.
10:00 AM: 10:00 FHFA House Price Index for August. This is based on GSE repeat sales and is no longer as closely followed as Case-Shiller (or CoreLogic).
10:00 AM: Conference Board's consumer confidence index for October. The consensus is for an increase to 50 from 48.5 last month. This is down sharply from earlier this year.
7:00 AM: The Mortgage Bankers Association (MBA) will release the mortgage purchase applications index. This index declined sharply following the expiration of the tax credit, and the index has only recovered slightly over the last few months even with record low mortgage rates.
8:30 AM: Durable Goods Orders for September from the Census Bureau. The consensus is for a 1.6% increase in durable goods orders after declining 1.3% in August.
10:00 AM: New Home Sales for September from the Census Bureau. The consensus is for a slight increase in sales to 300K (SAAR) in September from 288K in August. New home sales collapsed in and have averaged only 293K (SAAR) over the last four months. Prior to the last four months, the previous record low was 338K in Sept 1981.
8:30 AM: The initial weekly unemployment claims report will be released. Consensus is for about an increase to 455,000 from 452,000 last week (still elevated).
11:00 AM: Kansas City Fed regional Manufacturing Survey for October. The index was at 14 in September.
8:30 AM: Q3 GDP (second release). This is the advance release from the BEA, and the consensus is for real GDP to increase 2.0% annualized. My initial estimate was for a 1.5% annualized real increase in Q3 GDP, and I'll post another preview during the week. This is probably the last economic report standing between the Fed and QE2 (2nd round of quantitative easing). It would take a huge upside surprise in the GDP report to delay QE2 from arriving on November 3rd at 2:15 PM.
8:30 AM: The Q3 Employment Cost Index from the BLS. This is a measure of total compensation costs and the consensus is for 0.5% increase.
9:45 AM: Chicago Purchasing Managers Index for October. The consensus is for a decline to 57.6 from 60.4 in September.
9:55 AM: Reuter's/University of Michigan's Consumer sentiment index (final for October).
After 4:00 PM: The FDIC will probably have another busy Friday afternoon ...
Summary for Week ending Oct 23rd
by Calculated Risk on 10/24/2010 09:00:00 AM
A summary of last week - mostly in graphs.
With all the Fed speeches last week it is clear that the countdown to QE2 continues (QE2: quantitative easing, 2nd round). Also "put-backs" of "soured" mortgages (repurchase demands) is picking up steam, see:
From the Fed: Industrial production and Capacity Utilization
Industrial production decreased 0.2 percent in September after having increased 0.2 percent in August. ... The capacity utilization rate for total industry edged down to 74.7 percent ...
 Click on graph for larger image in new window.
This graph shows Capacity Utilization. This series is up 9.5% from the record low set in June 2009 (the series starts in 1967).
Capacity utilization at 74.7% is still far below normal - and well below the pre-recession levels of 81.2% in November 2007.
 The second graph shows industrial production since 1967.
Industrial production declined slightly in September, and production is still 7.5% below the pre-recession levels at the end of 2007.
This is below consensus expectations of a 0.2% increase in Industrial Production, and an increase to 74.8% (from 74.7% before revision) for Capacity Utilization.
 Total housing starts were at 610 thousand (SAAR) in September, up 0.3% from the revised August rate of 608 thousand (revised up from 598 thousand), and up 28% from the all time record low in April 2009 of 477 thousand (the lowest level since the Census Bureau began tracking housing starts in 1959).
 There has been an increase in multi-family starts over the last two months, although single family starts are significantly below the levels of earlier this year.
Single-family starts increased 4.4% to 452 thousand in August. This is 25% above the record low in January 2009 (360 thousand).
This was above expectations of 580 thousand starts, mostly because of the volatile multi-family starts.
 The National Association of Home Builders (NAHB) reports the housing market index (HMI) was at 16 in October. This is a 3 point increase from 13 in September, and is the highest level since June. The record low was 8 set in January 2009, and 16 is still very low ...
Note: any number under 50 indicates that more builders view sales conditions as poor than good.
This graph compares the NAHB HMI (left scale) with single family housing starts (right scale). This includes the October release for the HMI and the August data for starts (posted before starts were released).
This shows that the HMI and single family starts mostly move in the same direction - although there is plenty of noise month-to-month.
 Moody's reported today that the Moody’s/REAL All Property Type Aggregate Index declined 3.3% in August. This is a repeat sales measure of commercial real estate prices.
Here is a comparison of the Moodys/REAL Commercial Property Price Index (CPPI) and the Case-Shiller composite 20 index.
CRE prices only go back to December 2000.
The Case-Shiller Composite 20 residential index is in blue (with Dec 2000 set to 1.0 to line up the indexes).
It is important to remember that the number of transactions is very low and there are a large percentage of distressed sales.
Note: This index is a leading indicator for new Commercial Real Estate (CRE) investment.
 Reuters reports that the American Institute of Architects’ Architecture Billings Index increased to 50.4 in September from 48.2 in August. Any reading above 50 indicates expansion.
This graph shows the Architecture Billings Index since 1996. This is the first time the index has been above 50 since Jan 2008.
Note: Nonresidential construction includes commercial and industrial facilities like hotels and office buildings, as well as schools, hospitals and other institutions.
According to the AIA, there is an "approximate nine to twelve month lag time between architecture billings and construction spending" on non-residential construction. So, if the index stays at 50 or above, this suggests there will probably be further declines in CRE investment for the next 9 to 12 months.
Here is the Philadelphia Fed Index: Business Outlook Survey
Results from the Business Outlook Survey suggest that regional manufacturing activity was steady in October. Although the broad survey measures showed marginal improvement this month, the new orders index continued to suggest weak demand for manufactured goods.
...
The survey’s broadest measure of manufacturing conditions, the diffusion index of current activity, increased from a reading of –0.7 in September to 1.0 in October.
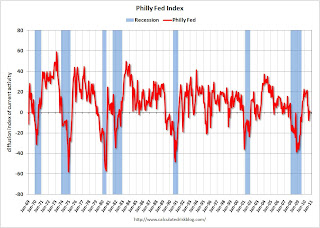 This graph shows the Philly index for the last 40 years.
This index turned down sharply in June and July and was negative in August and September (indicating contraction). The index was barely positive in October, and the internals (new orders, employment) are still weak.
These surveys are timely, but noisy. However this is further evidence of a slowdown in manufacturing. This was slightly worse than the consensus view of a reading of 1.8 (slight expansion).
Best wishes to all.


