 RSS Feed
 by Calculated Risk on 10/12/2010 08:32:00 PM
Tuesday, October 12, 2010
California: Number of Licensed Real Estate Agents declines Sharply
From Eric Wolff at the North County Times: Agents flee real estate slump

The ranks of holders of the "sales person" license thinned by 18 percent since the peak, down to 327,341 active licenses in August.Not only are sales down, but so is the percentage commission, also from Eric Wolff: Real estate agents reducing commissions
The number of brokers, who have a larger investment in time and money into the business, also slumped, but by 3 percent to 148,373.
The drop in licensees whacked membership rolls at the California Association of Realtors by 20 percent, pushing their membership to 160,000.
...
"When you go from one to three sales a month to one sale every three or six months, you can't make a living," said Susana Marquez, a San Diego real estate agent.
Lawler: "Early read" on September Existing Home Sales
by Calculated Risk on 10/12/2010 03:55:00 PM
CR Note: This is from housing economist Tom Lawler:
While as always results vary by area, on balance most local realtors/MLS are reporting significant YOY home sales declines for September sales. However, it’s important to remember that last September home sales were “goosed” a bit by the federal home buyer tax credit, which was set to expire at the end of November. Existing home sales ran at an estimated seasonally adjusted annual rate of 5.6 million last September, compared to 5.1 million in August 2009.
While I only have data on a relatively small part of the country, right now I estimate that existing home sales ran at a seasonally adjusted annual rate of about 4.50 million, up almost 9% from the August [2010] pace [of 4.13 million SAAR].
CR Note: This would put the months of supply around 10.3 months in September based on an estimate of 3.85 million for inventory.
Note: It is too soon for any impact on sales from "Foreclosure-Gate".
Existing home sales for September will be released on Monday October 25th at 10 AM ET.
FOMC September Meeting Minutes: "focused on further purchases of longer-term Treasury securities"
by Calculated Risk on 10/12/2010 02:00:00 PM
From the Fed: Minutes of the Federal Open Market Committee
Staff Economic Outlook
In the economic forecast prepared for the September FOMC meeting, the staff lowered its projection for the increase in real economic activity over the second half of 2010. The staff also reduced slightly its forecast of growth next year but continued to anticipate a moderate strengthening of the expansion in 2011 as well as a further pickup in economic growth in 2012. The softer tone of incoming economic data suggested that the underlying level of demand was weaker than projected at the time of the August meeting. Moreover, the outlook for foreign economic activity also appeared a bit weaker. In the medium term, the recovery in economic activity was expected to receive support from accommodative monetary policy, further improvements in financial conditions, and greater household and business confidence. Over the forecast period, the increase in real GDP was projected to be sufficient to slowly reduce economic slack, although resource slack was anticipated to still remain elevated at the end of 2012.
Monetary policy:
Participants discussed the medium-term outlook for monetary policy and issues related to monetary policy implementation. Many participants noted that if economic growth remained too slow to make satisfactory progress toward reducing the unemployment rate or if inflation continued to come in below levels consistent with the FOMC's dual mandate, it would be appropriate to provide additional monetary policy accommodation. However, others thought that additional accommodation would be warranted only if the outlook worsened and the odds of deflation increased materially. Meeting participants discussed several possible approaches to providing additional accommodation but focused primarily on further purchases of longer-term Treasury securities and on possible steps to affect inflation expectations. Participants reviewed the likely benefits and costs associated with a program of purchasing additional longer-term assets--with some noting that the economic benefits could be small in current circumstances--as well as the best means to calibrate and implement such purchases. A number of participants commented on the important role of inflation expectations for monetary policy: With short-term nominal interest rates constrained by the zero bound, a decline in short-term inflation expectations increases short-term real interest rates (that is, the difference between nominal interest rates and expected inflation), thereby damping aggregate demand. Conversely, in such circumstances, an increase in inflation expectations lowers short-term real interest rates, stimulating the economy. Participants noted a number of possible strategies for affecting short-term inflation expectations, including providing more detailed information about the rates of inflation the Committee considered consistent with its dual mandate, targeting a path for the price level rather than the rate of inflation, and targeting a path for the level of nominal GDP. As a general matter, participants felt that any needed policy accommodation would be most effective if enacted within a framework that was clearly communicated to the public. The minutes of FOMC meetings were seen as an important channel for communicating participants' views about monetary policy.That last sentence indicates that the FOMC views the minutes as an important communication tool - and the earlier sentences strongly suggest QE2 will arrive on Nov 3rd and will consist of purchases of longer-term Treasury securities.
This isn't anything new - but it is quite clear. And this was before the recent weak employment report.
Graphs: Small Business Optimism, Hiring and "Biggest Problem"
by Calculated Risk on 10/12/2010 11:02:00 AM
By request, here are a few graphs based on the NFIB press release: Small Business Optimism Index Remains at Recessionary Level
 Click on graph for larger image in new window.
The first graph shows the small business optimism index since 1986. Although the index increased slightly in September, it is still at recessionary level according to NFIB Chief Economist Bill Dunkelberg who said: "The downturn may be officially over, but small business owners have for the most part seen no evidence of it."
 The second graph shows the net hiring plans over the next three months.
Hiring plans have turned negative again. According to NFIB: "Over the next three months, eight percent plan to increase employment (unchanged), and 16 percent plan to reduce their workforce (up three points), yielding a seasonally adjusted net negative three percent of owners planning to create new jobs, down four points from August."
 And the third graph shows the percent of small businesses saying "poor sales" is their biggest problem.
Usually small business owners complain about taxes and regulations (that usually means business is good!), but now their self reported biggest problem is lack of demand.
NFIB: Small Businesses slightly less pessimistic, Hiring plans weaken
by Calculated Risk on 10/12/2010 08:03:00 AM
From NFIB: Small Business Confidence inches up
The Index of Small Business Optimism gained 0.2 points in September, rising to 89.0. The increase is certainly not a significant move, but at least it did not fall. Still, the Index remains in recession territory. The downturn may be officially over, but small business owners have for the most part seen no evidence of it.On employment:
Eleven (11) percent (seasonally adjusted) reported unfilled job openings, unchanged from August and historically very weak. Over the next three months, eight percent plan to increase employment (unchanged), and 16 percent plan to reduce their workforce (up three points), yielding a seasonally adjusted net negative three percent of owners planning to create new jobs, down four points from August, The decline in hiring plans is an unexpected reversal in job creation prospects. Hiring plans continue to underperform the recoveries following previous recessions.On capital spending:
The environment for capital spending is not good. ... A net negative three percent expect business conditions to improve over the next six months, a five point improvement from August, but still more owners expect the economy to weaken than strengthen.Note: Small businesses have a larger percentage of real estate and retail related companies than the overall economy.
And the key problem: Poor sales.
Monday, October 11, 2010
Duy: The Final End of Bretton Woods 2?
by Calculated Risk on 10/11/2010 09:25:00 PM
Tim Duy is deeply concerned: The Final End of Bretton Woods 2?
The inability of global leaders to address global current account imbalances now truly threatens global financial stability. Perhaps this was inevitable - the dollar has not depreciated to a degree commensurate with the financial crisis. Moreover, as the global economy stabilized the old imbalances made a comeback, sucking stimulus from the US economy and leaving US labor markets crippled. The latter prompts the US Federal Reserve to initiate a policy stance that will undoubtedly resonate throughout the globe. As a result we could now be standing witness to the final end of Bretton Woods 2. And a bloody end it may be.There is much more in the piece.
...
Put simply, the Federal Reserve is positioned to declare war on Bretton Woods 2. November 3, 2010. Mark it on your calendars.
...
Consider the enormity of the situation at hand. The Federal Reserve is poised to crank up the printing press for the sake of satisfying their domestic mandate. One mechanism, perhaps the only mechanism, by which we can expect meaningful, sustained reversal from the current set of imbalances is via a significant depreciation of the dollar. The rest of the world appears prepared to fight the Fed because they know no other path.
...
Bottom Line: The time may finally be at hand when the imbalances created by Bretton Woods 2 now tear the system asunder. The collapse is coming via an unexpected channel; rather than originating from abroad, the shock that sets it in motion comes from the inside, a blast of stimulus from the US Federal Reserve. And at the moment, the collapse looks likely to turn disorderly quickly. If the Federal Reserve is committed to quantitative easing, there is no way for the rest of the world to stop to flow of dollars that is already emanating from the US. Yet much of the world does not want to accept the inevitable, and there appears to be no agreement on what comes next. Call me pessimistic, but right now I don't see how this situation gets anything but more ugly
Back in 2005, I discussed Bretton Woods 2 with Brad Setser (Duy excerpts from one of Brad's pieces). I suggested that the housing bubble would collapse, reducing the U.S. demand for overseas goods and that would bring an end to Bretton Woods 2 - and that led me to predict that the trade deficit would decline in 2007 (a very lonely position!). However I didn't expect the imbalances to return so quickly, and that is very concerning. And I hope Tim Duy is wrong about how it ends.
Rail Intermodal Traffic at 2008 levels, Carload Traffic Lags
by Calculated Risk on 10/11/2010 06:06:00 PM
From the Association of American Railroads: Rail Time Indicators. The AAR reports carload traffic in September 2010 was up 7.7% compared to September 2009 - and carload traffic was 7.5% lower than in September 2008. Intermodal traffic (using intermodal or shipping containers) is up up 17.3% over September 2009 and up 0.2% over September 2008.
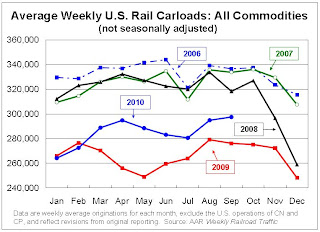 Click on graph for larger image in new window.
This graph shows U.S. average weekly rail carloads (NSA). Traffic increased in 16 of 19 major commodity categories year-over-year.
From AAR:
• U.S. freight railroads originated 1,487,511 carloads in September 2010, an average of 297,502 carloads per week. That’s up 7.7% from September 2009 and down 7.5% from September 2008 on a non-seasonally adjusted basis. It’s also the highest weekly average for any month since October 2008.As the graph above shows, rail carload traffic collapsed in November 2008, and now, a year into the recovery, carload traffic has only recovered half way. However ...
• Average unadjusted weekly carloads are typically lower in September than in August because of the Labor Day holiday. This year, though, September’s weekly unadjusted average (297,502) was higher than August’s (294,862). Why? The week with Labor Day was, as usual, one of the lowest-volume weeks of the year, but the other four weeks in September 2010 were all among the six highest-volume weeks of the year. The top two weeks so far in 2010 were in September.
• That explains why seasonally adjusted U.S. rail carloads were up 1.9% in September 2010 over August 2010, reaching their highest level since November 2008.

• U.S. railroads originated 1,165,288 intermodal trailers and containers in September 2010, an average of 233,058 per week on an unadjusted basis. That’s down slightly from August 2010, but that’s just due to Labor Day. The four non-Labor Day weeks in September were four of the top five intermodal weeks so far in 2010. September 2010 intermodal traffic was up 17.3% over September 2009 and up 0.2% over September 2008.The increase in intermodal traffic, along with the increase in West Coast port import traffic, are two of the indicators that suggest retailers might have over-ordered for the holidays. Stephanie Clifford and Catherine Rampell mentioned this possibility in the NY Times article last week: Dim Outlook for Holiday Jobs
• On an unadjusted basis, September is traditionally the second (sometimes third) highest-volume month of the year for intermodal, behind October. Intermodal peaks in the fall as retailers stock up for the holidays.
excerpts with permission
While retailers are just now making plans for Christmas hiring, they had to make plans for Christmas merchandise months ago, and that lag might create some inventory problems.
In the first part of the year, the economic picture looked much brighter. ... That was at about the same time that retailers had to order holiday merchandise because of the time it takes to produce and ship the inventory.
And recent traffic at the nation’s ports suggests that retailers made optimistic bets.
Economic Nobel Prize: Matching "the honored work with the moment"
by Calculated Risk on 10/11/2010 03:22:00 PM
A couple of reviews and explanations of the work of Peter Diamond, Dale Mortensen and Christopher Pissarides ...
From Edward Glaeser at Economix: The Work Behind the Nobel Prize
This year’s Nobel Memorial Prize in Economic Science ... was awarded today to Peter A. Diamond, Dale T. Mortensen and Christopher A. Pissarides for their research on “markets with search frictions,” which means any setting where buyers and sellers don’t automatically find each other. Search models are relevant in many settings, including dating, used cars and housing, but above all, these models help us make sense of unemployment.And more from Paul Krugman: What We Learn From Search Models
...
Professor Diamond’s ... work was distinguished both by elegant modeling — building the theoretical tools needed to make sense of labor turnover—and important insights. Perhaps the key idea is the “search externality,” the idea that each “additional worker makes it easier for vacancies to find workers and harder for other workers to find jobs.” ... Whenever one worker passes up a job, that worker makes finding a job easier for other workers. This insight led to Professor Diamond’s conclusion that higher levels of unemployment insurance could improve the workings of the labor market by making some workers pass up marginal jobs.
...
The work of these economists does not tell us how to fix our current high unemployment levels, but it does help us to make some sense of our current distress. Their models tell us that common wisdom — like the belief that higher unemployment benefits always increase unemployment — may be wrong and that policies that improve matching may have great value. Rarely has the prize committee been better able to match the honored work with the moment.
With regard to current concerns, probably the most relevant paper is Blanchard and Diamond on the Beveridge Curve — the relationship between job vacancies and unemployment. ... It shows that structural unemployment is a real issue, and that the volume of structural unemployment shifts over time. It also shows, however, that short-term movements in unemployment are overwhelmingly the result of overall shocks to demand ...And from Catherine Rampell at the NY Times: 3 Share Nobel Economics Prize for Labor Analysis
In a telephone interview with reporters at the Nobel news conference in Sweden, Professor Pissarides said he thought the work being honored had one lesson in particular for today’s policy makers: “What we should really be doing is make sure the unemployed do not stay unemployed for too long, to try to give them direct work experience,” so that they “don’t lose their attachment to the labor force.”
Professor Diamond, in a news conference at M.I.T., echoed his colleague’s advice about getting people back to work as quickly as possible, but said fears about permanently higher unemployment rates and structural displacement of workers were overblown.
“I think the economy is very adaptive,” he said. “Workers and employers will adapt to what will make the economy function. I see no reason why, once we get fully over this, we won’t go back to normal times,” with more “normal” unemployment rates.
Real GDP Growth and the Unemployment Rate
by Calculated Risk on 10/11/2010 12:33:00 PM
At the November FOMC meeting, the Fed will update their economic forecasts.
In June, the Fed forecast was for GDP growth of between 3.5% and 4.2% in 2011, with the unemployment rate falling to 8.3% to 8.7%. However since their forecasts were too optimistic for 2010, the unemployment rate would even be higher next year with the same growth forecast in 2011 (because the FOMC had expected the unemployment rate to fall further in 2010).
 Click on graph for larger image.
Here is an update on a version of Okun's Law. This graph shows the annual change in real GDP (x-axis) vs. the annual change in the unemployment rate (y-axis).
Note: For this graph I used a rolling four quarter change - so all the data points are not independent. However - remember - this "law" is really just a guide.
Using this graph and the previous Fed forecasts for 2011 (3.5% to 4.2% GDP growth), we can estimate that the unemployment rate will be in the 9.0% to 9.4% range in a year (although the spread is pretty wide).
The following table summarizes several scenarios over the next year (starting from the current 9.6% unemployment rate):
| Real GDP Growth | Unemployment Rate in One Year |
|---|---|
| 0.0% | 11.0% |
| 1.0% | 10.5% |
| 2.0% | 10.0% |
| 3.0% | 9.6% |
| 4.0% | 9.1% |
| 5.0% | 8.7% |
I expected a sluggish recovery in 2010, so I thought the unemployment rate would stay elevated throughout 2010 (that was correct).
Going forward, I think the recovery will stay sluggish and choppy for some time and I'd guess the unemployment rate will tick up in the short term and still be above 9% later next year. You can see why those expecting 1% to 2% growth next year (like Goldman Sachs) are expecting the unemployment rate to be close to 10%.
Obviously higher growth rates would mean an even quicker decline in the unemployment rate, and a decline in real GDP would mean much higher unemployment rates.
CNBC Survey: Fed Certain to act in November
by Calculated Risk on 10/11/2010 09:23:00 AM
Market participants now expects QE2 to be announced at 2:15 PM ET on November 3rd (when the FOMC statement is released at the conclusion of the two day meeting).
From Steve Liesman at CNBC: Fed Certain to Act in November In a Big Way: Survey
[M]arket participants are now virtually certain that the Federal Reserve will announce [QE2] at the conclusion of its November meeting and do so in a sizeable way, according to an exclusive CNBC Fed Survey. ... participants forecast that the Fed will announce plans to purchase $500 billion in assets ...The FOMC might announce a large amount - or they might announce a monthly pace of purchases like the $100 billion we've discussed before, with the intention of reviewing the purchase pace at each subsequent FOMC meeting.
Note: This coming Friday, at 8:15 AM ET, Fed Chairman Ben Bernanke will address the tools and goals of QE2 at the Federal Reserve Bank of Boston Conference. His speech is titled: "Monetary Policy Objectives and Tools in a Low-Inflation Environment".


