 RSS Feed
 by Calculated Risk on 9/25/2010 11:31:00 AM
Saturday, September 25, 2010
Unofficial Problem Bank List increases to 872 institutions
Note: this is an unofficial list of Problem Banks compiled only from public sources.
Here is the unofficial problem bank list for September 24, 2010.
Changes and comments from surferdude808:
The Unofficial Problem Bank List underwent significant changes this week from failures and the FDIC releasing its enforcement actions for August 2010. The list finished the week at 872 institutions with assets of $422.4 billion, up from 854 institutions with assets of $416 billion last week.The list just keeps growing.
Changes this week include three removals and 21 additions. The removals are the two failures -- Haven Trust Bank Florida ($149 million) and North County Bank ($289 million) and one from an unassisted merger -- Sunrise Bank of Atlanta ($50 million).
Most notable among the additions are Lydian Private Bank, Palm Beach, FL ($1.96 billion); Universal Bank, West Covina, CA ($537 million); TruPoint Bank, Grundy, VA ($484 million); First Guaranty Bank and Trust Company of Jacksonville, Jacksonville, FL ($460 million); and First South Bank, Spartanburg, SC ($456 million Ticker: FSBS).
Other changes include Prompt Corrective Action Orders issued against Peoples State Bank ($445 million), LandMark Bank of Florida ($320 million), First Arizona Savings, a FSB ($272 million), American Patriot Bank ($108 million), and Idaho First Bank ($82 million).
WSJ: Committee to Save the Euro
by Calculated Risk on 9/25/2010 08:41:00 AM
An interesting back story in the WSJ: On the Secret Committee to Save the Euro, a Dangerous Divide
Two months after Lehman Brothers collapsed in the fall of 2008, a small group of European leaders set up a secret task force ... Its mission: Devise a plan to head off a default by a country in the 16-nation euro zone.And a year later - when Greece was near default - the committee hadn't agreed on a strategy. And that lead to the frantic last minute scramble to piece together a bailout for Greece - with Germany calling the shots.
Friday, September 24, 2010
Misc: Bernanke, "Toxie", GMAC, Credit Card debt and Housing
by Calculated Risk on 9/24/2010 10:46:00 PM
A few stories:
When we bought Toxie , in January of this year, she seemed like a great deal. We paid $1,000. That was 99 percent less than she cost dring the housing boom.And on the four housing reports this week: "Been down so long it looks like up to me", (book by Richard Fariña)
Every month, when homeowners paid their mortgages, we got a check. We thought we'd make back our investment before she died. But in the end, we collected only $449.
I'll have a weekly summary on Sunday.
Bank Failure #127: North County Bank, Arlington, Washington
by Calculated Risk on 9/24/2010 09:07:00 PM
From the FDIC: Whidbey Island Bank, Coupeville, Washington, Assumes All of the Deposits of North County Bank, Arlington, Washington
As of June 30, 2010, North County Bank had approximately $288.8 million in total assets and $276.1 million in total deposits. ... The FDIC estimates that the cost to the Deposit Insurance Fund (DIF) will be $72.8 million. ... North County Bank is the 127th FDIC-insured institution to fail in the nation this year, and the ninth in Washington.Just 2 this week? The unofficial problem bank list will be increasing ...
Bank Failure #126: Haven Trust Bank Florida, Ponte Vedra Beach, Florida
by Calculated Risk on 9/24/2010 05:29:00 PM
Too big of a bite was had
Indigestible
by Soylent Green is People
From the FDIC: First Southern Bank, Boca Raton, Florida, Assumes All of the Deposits of Haven Trust Bank Florida, Ponte Vedra Beach, Florida
As of June 30, 2010, Haven Trust Bank Florida had approximately $148.6 million in total assets and $133.6 million in total deposits. ... The FDIC estimates that the cost to the Deposit Insurance Fund (DIF) will be $31.9 million. ... Haven Trust Bank Florida is the 126th FDIC-insured institution to fail in the nation this year, and the twenty-fourth in Florida. The last FDIC-insured institution closed in the state was Horizon Bank, Bradenton, on September 10, 2010..
National Credit Union Administration announces plan to manage $50 billion in impaired assets
by Calculated Risk on 9/24/2010 04:51:00 PM
Press Release: NCUA Adopts Reforms for Corporate Credit Union System, Protects Consumers
The National Credit Union Administration today assumed control of three undercapitalized corporate credit unions, announced a plan to isolate the impaired assets in the corporate credit union system, and finalized a set of stronger regulations - key elements in its efforts to resolve the financial challenges facing corporate credit unions without disrupting consumer service.The WSJ reports:
...
Setting the plan into motion required conservatorship today of three additional corporate credit unions that are not viable: Members United Corporate Federal Credit Union of Warrenville, Illinois; Southwest Corporate Federal Credit Union of Plano, Texas; and Constitution Corporate Federal Credit Union of Wallingford, Connecticut. In 2009, U.S. Central Corporate Federal Credit Union of Lenexa, Kansas, and Western Corporate Federal Credit Union of San Dimas, California, were also placed into conservatorship.
Friday's moves include the seizure of three wholesale credit unions and an unusual plan by government officials to manage $50 billion of troubled assets inherited from failed institutions. To help fund the rescue, the National Credit Union Administration plans to issue $30 billion to $35 billion in government-guaranteed bonds, backed by the shaky mortgage-related assets.These "corporate credit unions" don't serve the general public - they are owned by the "natural person" credit unions - and all the "natural person" money held at these corporate credit unions was guaranteed early last year. But this is another $50 billion in "troubled" assets that will need to be worked through.
DOT: Vehicle Miles driven increase slightly in July
by Calculated Risk on 9/24/2010 03:23:00 PM
The Department of Transportation (DOT) reported that vehicle miles driven in June were up 0.8% compared to July 2009:
Travel on all roads and streets changed by 0.8% (2.2 billion vehicle miles) for July 2010 as compared with July 2009.
Cumulative Travel for 2010 changed by 0.2% (2.9 billion vehicle miles).
 Click on graph for larger image in new window.
This graph shows the rolling 12 month total vehicle miles driven.
On a rolling 12 month basis, vehicle miles driven are mostly moving sideways. Miles driven are still 1.8% below the peak in 2007.
Back in 2008, vehicle miles turned strongly negative on a "month over the same month of the prior year" basis, and that was one of the pieces of data that helped me correctly predict oil prices would decline sharply in the 2nd half of 2008. So far we haven't seen a sharp decline in vehicle miles - but we also haven't seen a strong increase.
Early next year this will be the longest period with the rolling 12-months miles driven below the previous peak since the DOT started tracking this series. The current longest slump followed the 1979 oil crisis and lasted for 40 months (starting in 1979 and lasting through the recession of the early '80s).
Home Sales: Distressing Gap
by Calculated Risk on 9/24/2010 01:31:00 PM
By request, here is an update - this graph shows existing home sales (left axis) and new home sales (right axis) through August. This graph starts in 1994, but the relationship has been fairly steady back to the '60s. Then along came the housing bubble and bust, and the "distressing gap" appeared (due partially to distressed sales).
Note: it is important to note that existing home sales are counted when transaction are closed, and new home sales are counted when contracts are signed. So the timing of sales is different.
 Click on graph for larger image in new window.
Initially the gap was caused by the flood of distressed sales. This kept existing home sales elevated, and depressed new home sales since builders couldn't compete with the low prices of all the foreclosed properties.
The two spikes in existing home sales were due primarily to the first time homebuyer tax credit (the initial credit last year, followed by the extension to April 30th / close by June 30th). There were also two smaller bumps for new home sales related to the tax credit.
Since new home sales are reported when contracts are signed, the 2nd spike for new home sales was in April and then sales collapsed in May. The 2nd spike for existing home sales was in May and June, and then existing home sales collapsed in July.
I expect that eventually this gap will be closed. However that will only happen after the huge overhang of existing inventory (especially distressed inventory) is significantly reduced.
New Home Sales August 2010 (Repeat with graphs)
by Calculated Risk on 9/24/2010 10:58:00 AM
Note: I apologize for the technical difficulties this AM.
The Census Bureau reports New Home Sales in August were at a seasonally adjusted annual rate (SAAR) of 288 thousand. This is unchanged from July.
 Click on graph for larger image in new window.
The first graph shows monthly new home sales (NSA - Not Seasonally Adjusted or annualized).
Note the Red columns for 2010. In August 2010, 25 thousand new homes were sold (NSA). This is a new record low for August.
The previous record low for the month of August was 34 thousand in 1981; the record high was 110 thousand in August 2005.
 The second graph shows New Home Sales vs. recessions for the last 47 years. The dashed line is the current sales rate.
Sales of new single-family houses in August 2010 were at a seasonally adjusted annual rate of 288,000, according to estimates released jointly today by the U.S. Census Bureau and the Department of Housing and Urban Development. This is unchanged (±16.7%)* from the revised July rate of 288,000 and is 28.9 percent (±11.0%) below the August 2009 estimate of 405,000.And another long term graph - this one for New Home Months of Supply.
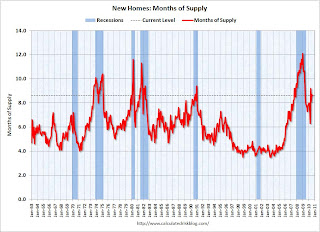 Months of supply decreased to 8.6 in August from 8.7 in July. The all time record was 12.4 months of supply in January 2009. This is still very high (less than 6 months supply is normal).
The seasonally adjusted estimate of new houses for sale at the end of August was 206,000. This represents a supply of 8.6 months at the current sales rate.
 The final graph shows new home inventory.
 The 288 thousand annual sales rate for August is just above the all time record low in May (282 thousand). This was another very weak report. New home sales are important for the economy and jobs - and this indicates that residential investment will be a sharp drag on GDP in Q3.
New Home Sales: Unchanged from July, Worst August on Record
by Calculated Risk on 9/24/2010 10:00:00 AM
NOTE: My host (Google) is not uploading images this morning - I'm working on a fix. You can follow the links to the images.
The Census Bureau reports New Home Sales in August were at a seasonally adjusted annual rate (SAAR) of 288 thousand. This is unchanged from July.
Here is the graph for New Home Sales NSA.
The first graph shows monthly new home sales (NSA - Not Seasonally Adjusted or annualized).
Note the Red columns for 2010. In August 2010, 25 thousand new homes were sold (NSA). This is a new record low for August.
The previous record low for the month of August was 34 thousand in 1981; the record high was 110 thousand in August 2005.
The second graph shows New Home Sales vs. recessions for the last 47 years.
Sales of new single-family houses in August 2010 were at a seasonally adjusted annual rate of 288,000, according to estimates released jointly today by the U.S. Census Bureau and the Department of Housing and Urban Development. This is unchanged (±16.7%)* from the revised July rate of 288,000 and is 28.9 percent (±11.0%) below the August 2009 estimate of 405,000.And another long term graph - this one for New Home Months of Supply.
The third graph is for Months of Supply
Months of supply decreased to 8.6 in August from 8.7 in July. The all time record was 12.4 months of supply in January 2009. This is still very high (less than 6 months supply is normal).
The seasonally adjusted estimate of new houses for sale at the end of August was 206,000. This represents a supply of 8.6 months at the current sales rate.The final graph shows new home inventory.
The 288 thousand annual sales rate for August is just above the all time record low in May (282 thousand). This was another very weak report. New home sales are important for the economy and jobs - and this indicates that residential investment will be a sharp drag on GDP in Q3.
Note: Sorry for the technical problems.


