 RSS Feed
 by Calculated Risk on 9/17/2010 02:25:00 PM
Friday, September 17, 2010
Inflation: Core CPI, Median CPI, 16% trimmed-mean CPI
The Cleveland Fed has released the median CPI:
According to the Federal Reserve Bank of Cleveland, the median Consumer Price Index rose 0.1% (0.6% annualized rate) in August. The 16% trimmed-mean Consumer Price Index increased 0.1% (1.2% annualized rate) during the month.
...
Over the last 12 months, the median CPI rose 0.5%, the trimmed-mean CPI rose 0.9%, the CPI rose 1.1%, and the CPI less food and energy rose 0.9%.
 Click on graph for larger image in new window.
This graph shows three measure of inflation, Core CPI, Median CPI (from the Cleveland Fed), and 16% trimmed CPI (also from Cleveland Fed).
They all show that inflation has been falling, and that measured inflation is up less than 1% year-over-year. Core CPI was flat, and median CPI and the 16% trimmed mean CPI were up 0.1% in August.
Note: The Cleveland Fed has a discussion of a number of measures of inflation: Measuring Inflation
No increase to Social Security Benefits for 2011 (unofficial)
by Calculated Risk on 9/17/2010 11:28:00 AM
It won't be official until the BLS releases the September CPI-W report, but we can already say there will be no increase in Social Security benefits or the Maximum Contribution Base in 2011 (assuming no new legislation).
The BLS reported this morning that the Consumer Price Index for Urban Wage Earners and Clerical Workers (CPI-W) was at 214.205 in August (CPI-W was at 213.898 in July).
Here is an explanation of why there will be no change (some repeated from a post last month):
The calculation dates have changed over time (see Cost-of-Living Adjustments), but the current calculation uses the average CPI-W for the three months in Q3 (July, August, September) and compares to the average for the highest previous average of Q3 months. Note: this is not the headline CPI-U.
 Click on graph for larger image in new window.
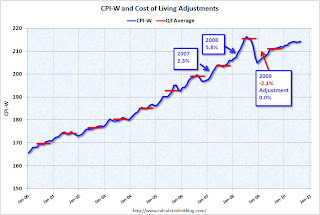
This graph shows CPI-W over the last ten years. The red lines are the Q3 average of CPI-W for each year.
The COLA adjustment is based on the increase from Q3 of one year from the highest previous Q3 average. So a 2.3% increase was announced in 2007 for 2008, and a 5.8% increase was announced in 2008 for 2009.
In Q3 2009, CPI-W was lower than in Q3 2008, so there was no change in benefits for 2010.
For 2011, the calculation is not based on Q3 2010 over Q3 2009, but based on the average CPI-W for Q3 2010 over the highest preceding Q3 average - the 215.495 in Q3 2008. This means CPI-W in Q3 2010 has to average above 215.495 for there to be an increase in Social Security benefits in 2011.
In July 2010, CPI-W was at 213.898, and in August CPI-W was at 214.205 - so CPI-W would have to increase by almost 2% in September for the Q3 average to be at or above the Q3 2008 average. There is no evidence of a huge surge in inflation this month, so there will be no increase in Social Security benefits in 2011.
Even though there was no increase last year, and there will be no increase this year, those receiving benefits are still ahead because of the huge increase in Q3 2008.
Note: See post last month for a discussion of CPI-W and the Contribution Base.
Now the question is: Will Social Security benefits be flat in 2012 too? That is possible.
Consumer Sentiment declines in September, lowest level in a year
by Calculated Risk on 9/17/2010 09:55:00 AM
From MarketWatch: U.S. Sept. consumer sentiment falls to 66.6
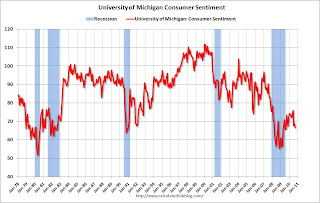
The UMich index declined to 66.6 in September - the lowest level since August 2009 -- from 68.9 in August.
 Click on graph for larger image in new window.
Consumer sentiment is a coincident indicator - and this is further evidence of a sluggish economy.
This was a big story in July when consumer sentiment collapsed to the lowest level since late 2009. Now it is even lower ...
Consumer Price Index increases 0.3%, core rate unchanged in August
by Calculated Risk on 9/17/2010 08:30:00 AM
From the BLS report on the Consumer Price Index this morning:
The Consumer Price Index for All Urban Consumers (CPI-U) increased 0.3 percent in August on a seasonally adjusted basis, the U.S. Bureau of Labor Statistics reported today. ... Over the last 12 months, the all items index increased 1.1 percent before seasonal adjustment.The general disinflationary trend continues - core CPI is up less than 1% over the last year - and with all the slack in the system (especially the 9.6% unemployment rate), the various measures of inflation will probably stay low or even fall further.
...
The index for all items less food and energy was unchanged in August ... Over the last 12 months, the index for all items less food and energy rose 0.9 percent ...
The index for owners' equivalent rent was unchanged and the lodging away from home index fell 1.3 percent....
Note: I'll post a graph later after the Cleveland Fed releases the 16% trimmed CPI (another measure of inflation).
Thursday, September 16, 2010
Weekly Update on European Bond Spreads
by Calculated Risk on 9/16/2010 08:38:00 PM
Here are the European bond spreads from the Atlanta Fed weekly Financial Highlights released today (graph as of Sept 15th): Click on graph for larger image in new window.
From the Atlanta Fed:
European bond spreads have risen and remain elevated since the August FOMC meeting.A quiet week, but definitely still worth watching ... especially with all the currency manipulation going on.
Update: Regional Fed Surveys and ISM
by Calculated Risk on 9/16/2010 04:35:00 PM
Note: Usually I don't watch this very closely, but right now I'm looking for signs of a slowdown in manufacturing. Eventually a watched pot does boil ...
By request - now that the Empire State and Philly Fed manufacturing surveys for September have been released - here is an update to the graph I posted last month: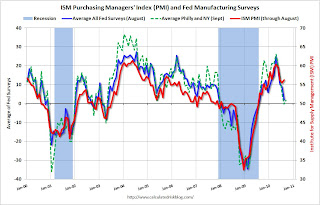 Click on graph for larger image in new window.
For this graph I averaged the New York and Philly Fed surveys (dashed green, through September), and averaged five surveys including New York, Philly, Richmond, Dallas and Kansas City (blue, through August).
The Institute for Supply Management (ISM) PMI (red) is through August (right axis).
Last month, when the ISM survey came in slightly better than expected, I wrote: "Based on this graph, I'd expect either the Fed surveys to bounce back in September - or the ISM to decline."
So far there has been little "bounce back" in the Fed surveys.
Hotel Occupancy Rate: "Bumpy Week"
by Calculated Risk on 9/16/2010 01:57:00 PM
Hotel occupancy is one of several industry specific indicators I follow ...
From HotelNewsNow.com: STR: US hotel industry has bumpy week
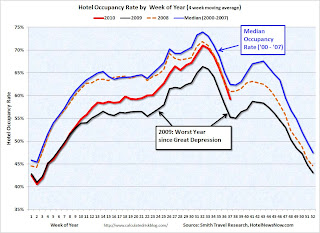
The U.S. hotel industry reported a decrease in average daily rate ADR for the first time in 13 consecutive weeks for the week of 5-11 September 2010, according to data from STR.The following graph shows the four week moving average for the occupancy rate by week for 2008, 2009 and 2010 (and a median for 2000 through 2007).
ADR fell 2.0% to US$92.84, occupancy increased 2.7% to 54.2%, and revenue per available room ended the week virtually flat with a 0.7% increase to US$50.32.
 Click on graph for larger image in new window.
Notes: the scale doesn't start at zero to better show the change. The graph shows the 4-week average, not the weekly occupancy rate.
On a 4-week basis, occupancy is up 7.2% compared to last year (the worst year since the Great Depression) and 5.1% below the median for 2000 through 2007.
The occupancy rate has fallen below the levels of 2008 again - and 2008 was a tough year for the hotel industry!
Important: Even with the occupancy rate close to 2008 levels, 2010 is a much more difficult year. The average daily rate (ADR) is off 14% from 2008 levels - so even with the similar occupancy rates, hotel room revenue is off sharply.
Data Source: Smith Travel Research, Courtesy of HotelNewsNow.com
Misc: China's Exchange Rate, Foreclosures, Poverty and Walking Away
by Calculated Risk on 9/16/2010 11:57:00 AM
A few articles:
It is the judgment of the IMF that, in view of the very limited movement in the Chinese currency, the rapid pace of productivity and income growth in China relative to its trading partners, the size of its current account surplus, and the substantial level of ongoing intervention in exchange markets to limit the appreciation of the Chinese currency, the renminbi is significantly undervalued.
We share that assessment. We are concerned, as are many of China’s trading partners, that the pace of appreciation has been too slow and the extent of appreciation too limited.
We will take China’s actions into account as we prepare the next Foreign Exchange Report, and we are examining the important question of what mix of tools, those available to the United States as well as multilateral approaches, might help encourage the Chinese authorities to move more quickly.
Bank repossessions ... increased about 3 percent from the month before to 95,364, a record high. At the same time the number of properties that received default notices—the first step in the foreclosure process—decreased 1 percent from a month ago and fell 30 percent from a year ago ...
Forty-four million people in the United States, or one in seven residents, lived in poverty in 2009, an increase of 4 million from the year before, the Census Bureau reported on Thursday.Here is the Census Bureau report.
The poverty rate climbed to 14.3 percent — the highest since 1994 — from 13.2 percent in 2008.
[T]he majority of Americans still believe [walking away] is unacceptable, according to a report from Pew Research Center.Here is the Pew Research report.
On the other hand, more than a third (36 percent) say the practice is at least sometimes acceptable.
Philly Fed Index shows contraction in September
by Calculated Risk on 9/16/2010 10:00:00 AM
Here is the Philadelphia Fed Index: Business Outlook Survey
The survey’s broadest measure of manufacturing conditions, the diffusion index of current activity, increased from a reading of -7.7 in August to -0.7 in September. The index, which has been negative for two consecutive months, suggests that growth has stalled over the last two months (see Chart). Indexes for new orders and shipments continued to indicate weakness this month: The new orders index fell 1 point, remaining negative for the third consecutive month, and the shipments index decreased 3 points, remaining negative for the second consecutive month.
Firms reported near steady employment this month but lower average work hours for existing employees. The percentage of firms reporting increases in employment (18 percent) narrowly edged out the percentage reporting decreases (16 percent). The index for employment was slightly positive this month, increasing 5 points from its negative reading in August. Indicative of weaker activity, more firms reported declines in average work hours for existing employees (30 percent) than reported increases (8 percent).emphasis added
 Click on graph for larger image in new window.
This graph shows the Philly index for the last 40 years.
This index turned down sharply in June and July and was negative in August and September (indicating contraction).
These surveys are timely, but noisy. However this is further evidence of a slowdown in manufacturing. This was slightly worse than the consensus view of a reading of 3.8 (slight expansion).
Weekly initial unemployment claims decline slightly
by Calculated Risk on 9/16/2010 08:32:00 AM
The DOL reports on weekly unemployment insurance claims:
In the week ending Sept. 11, the advance figure for seasonally adjusted initial claims was 450,000, a decrease of 3,000 from the previous week's revised figure of 453,000 [revised up from 451,000]. The 4-week moving average was 464,750, a decrease of 13,500 from the previous week's revised average of 478,250.
 Click on graph for larger image in new window.
This graph shows the 4-week moving average of weekly claims since January 2000.
The dashed line on the graph is the current 4-week average. The four-week average of weekly unemployment claims decreased this week by 13,500 to 464,750.
This is the lowest level for weekly claims since early July, but it is still very high - the 4-week moving average has been moving sideways at an elevated level for about 10 months - and that suggests a weak job market.


