 RSS Feed
 by Calculated Risk on 8/28/2010 01:05:00 PM
Saturday, August 28, 2010
Employment Report Preview: Will the unemployment rate spike higher?
The August employment report will be released next Friday, Sept 3rd. The consensus is for the loss of around 90,000 payroll jobs, and an increase in the unemployment rate to 9.6% (from 9.5% in July).
The decennial Census will subtract about 116,000 payroll jobs in August (estimate here), so the consensus is for about +26,000 payroll jobs ex-Census.
I will take the under on the number of payroll jobs. I think it is possible that we will see a negative payroll number, ex-Census, because of weak private hiring combined with state and local layoffs.
And I will also take the over on the unemployment rate. Here is why:
The unemployment rate is from the household survey, and is impacted by the participation rate - the percent of the civilian population in the labor force. The following graph shows the sharp decline in the participation rate during the current employment recession.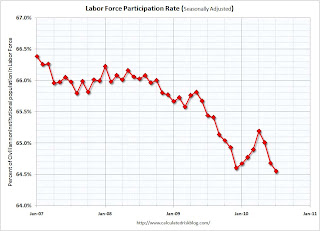 Click on graph for larger image in new window.
Note: y-axis starts at 64% to show the change.
The increase in the participation rate earlier this year was good news. This meant some workers who had given up were rejoining the labor force. The increase in the participation rate pushed up the unemployment rate, since the economy wasn't adding jobs fast enough to employ all the workers rejoining the labor force. But it was still good news that the participation rate was increasing.
However it was bad news when the participation rate started falling again over the last few months. The decline in the unemployment rate - from 9.9% in April to 9.5% in June and July - was related to the decline in the participation rate. And workers leaving the labor force is not great news.
But what will happen to the participation rate in August? The first guess, with the weak economy, is that the participation rate declined further in August, putting downward pressure on the unemployment rate.
But there are two reasons I think the participation rate might have increased.
Summer teen employment: As I noted in June, the record low number of teens joining the labor force appeared to push down the seasonally adjusted participation rate (and therefore pushed down the unemployment rate). I think this will start to unwind in August. As a lower than normal number of teens leave the labor force, the seasonally adjusted teen labor force will probably increase - my guess is by 100,000 to 150,000 workers. All else being equal, this would push up the participation rate, and also push up the unemployment rate to around 9.6%.
Unemployment Benefits: At the end of July, the qualification dates for the various tiers of Federal unemployment benefits were extended through November 30th. This extension was also made retroactive to June 2nd. Some people who have given up, might rejoin the labor force to collect additional benefits. If this happens, the participation rate might increase in August - and that would push up the unemployment rate. Although the number is uncertain, if 250,000 workers rejoin the labor force to collect benefits that would push the unemployment rate to 9.7%. If 500,000 workers rejoin the labor force, plus the 125,000 from the teen adjustment, the unemployment rate would increase to around 9.9%.
As noted above, the weak economy would normally lead to a lower participation rate, but these two reasons might push the participation rate up - and that could mean a higher than expected increase in the unemployment rate.
Unofficial Problem Bank List increases to 840 institutions
by Calculated Risk on 8/28/2010 08:44:00 AM
Note: this is an unofficial list of Problem Banks compiled only from public sources.
Here is the unofficial problem bank list for August 27, 2010.
Changes and comments from surferdude808:
The Unofficial Problem Bank List grew by more than five percent this week as the FDIC released its enforcement actions for July 2010. This week, there were 28 additions and 5 removals. Also, the list was updated to reflect assets as of the second quarter. For institutions on the list since the first quarter, aggregate assets declined by $13.9 billion. With these changes, the Unofficial Problem Bank List includes 840 institutions with aggregate assets of $410.3 billion.
Removals include First National Bank and Trust of Syracuse ($58 million), Town Center Bank ($40 million), and Peoples State Bank ($26 million), which were involved in unassisted mergers during July. Other removals from action termination include Independence Bank ($352 million) and Darien Rowayton Bank ($107 million).
Among the 28 additions are TIB Bank, Naples, FL ($1.7 billion); CB&S Bank, Inc., Russellville, AL ($1.3 billion); First Bank and Trust, New Orleans, LA ($944 million); Citizens Bank of Mukwonago, Mukwonago, WI ($627 million); and First Chatham Bank, Savannah, GA ($596 million). Geographically, the additions include 5 institutions from Illinois, 4 from Florida, and 3 from Minnesota.
Next week, the FDIC likely will release the Official Problem Bank List as of June 30th.
Friday, August 27, 2010
Jim the Realtor: "Good time to be a looker"
by Calculated Risk on 8/27/2010 08:20:00 PM
Prices are falling ... and Jim the Realtor says: "You won’t hear me say it’s a great time to buy, but ... it’s a great time to look.”
U.S. Births decline in 2009
by Calculated Risk on 8/27/2010 04:03:00 PM
From the National Center for Health Statistics: Births, Marriages, Divorces, and Deaths: Provisional Data for 2009
The NCHS reports that U.S. births declined to 4.136 million in 2009, from 4.247 million in 2008. The birth rate declined to 13.5 from 13.9 in 2008 (births per 1000 total population).
Here is a long term graph of annual U.S. births through 2009 ... Click on graph for larger image in new window.
Births have declined for two consecutive years, and are now 4.2% below the peak in 2007. I suspect certain segments of the population were under stress before the recession started - like construction workers - and even more families were in distress in 2008 and 2009. Of course it takes 9 months to have a baby, so families in distress in 2009 probably put off having babies in 2010 too.
Notice that the number of births started declining a number of years before the Great Depression started. Many families in the 1920s were under severe stress long before the economy collapsed. By 1933 births were down by almost 23% from the early '20s levels.
Of course economic distress isn't the only reason births decline - look at the huge decline following the baby boom that was driven by demographics. But it is common for births to slow or decline during tough economic times in the U.S. - and that appears to be happening now.
Last year I guessed that we'd see further declines in births in 2009 (now confirmed) and probably in 2010. But I don't think the declines in births will be anything like what happened during the 1920s.
Estimate of Decennial Census impact on August payroll employment: minus 116,000
by Calculated Risk on 8/27/2010 12:49:00 PM
The Census Bureau released the weekly payroll data for the week ending August 14th this week (ht Bob_in_MA). If we subtract the number of temporary 2010 Census workers in the week containing the 12th of the month, from the same week for the previous month - this provides a close estimate for the impact of the Census hiring on payroll employment.
The Census Bureau releases the actual number with the employment report. 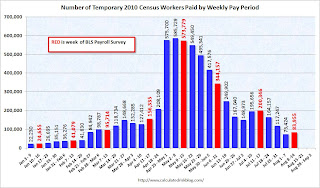 Click on graph for larger image in new window.
This graph shows the number of Census workers paid each week. The red labels are the weeks of the BLS payroll survey.
The Census payroll decreased from 200,346 for the week ending July 17th to 83,955 for the week ending August 14th.
So my estimate for the impact of the Census on August payroll employment is minus 116 thousand (this will probably be close). The employment report will be released on September 3rd, and the headline number for August - including Census numbers - will probably be negative again. But a key number will be the hiring ex-Census (so we will add back the Census workers again this month).
The following table compares the weekly payroll report estimate to the monthly BLS report on Census hiring (the weekly report is revised slightly, so the correlation looks better than in real time):
| Payroll, Weekly Pay Period | Payroll, Monthly BLS | Change based on weekly report | Actual Change (monthly) | |
|---|---|---|---|---|
| Jan | 25 | 24 | ||
| Feb | 41 | 39 | 16 | 15 |
| Mar | 96 | 87 | 55 | 48 |
| Apr | 156 | 154 | 61 | 67 |
| May | 574 | 564 | 418 | 410 |
| Jun | 344 | 339 | -230 | -225 |
| Jul | 200 | 196 | -144 | -143 |
| Aug | 84 | -116 | ||
| All thousands | ||||
Analysis: Bernanke paves the way for QE2
by Calculated Risk on 8/27/2010 11:22:00 AM
Just some quick thoughts on Fed Chairman Ben Bernanke's speech today.
For a sustained expansion to take hold, growth in private final demand--notably, consumer spending and business fixed investment--must ultimately take the lead. On the whole, in the United States, that critical handoff appears to be under way. ... the pace of that growth recently appears somewhat less vigorous than we expected. ... Incoming data on the labor market have remained disappointing. ... Overall, the incoming data suggest that the recovery of output and employment in the United States has slowed in recent months, to a pace somewhat weaker than most FOMC participants projected earlier this year. ... I expect the economy to continue to expand in the second half of this year, albeit at a relatively modest pace.
Despite the weaker data seen recently, the preconditions for a pickup in growth in 2011 appear to remain in place.
Under what conditions would the FOMC make further use of these or related policy tools? At this juncture, the Committee has not agreed on specific criteria or triggers for further action, but I can make two general observations.
First, the FOMC will strongly resist deviations from price stability in the downward direction. ... It is worthwhile to note that, if deflation risks were to increase, the benefit-cost tradeoffs of some of our policy tools could become significantly more favorable.
Second, regardless of the risks of deflation, the FOMC will do all that it can to ensure continuation of the economic recovery. Consistent with our mandate, the Federal Reserve is committed to promoting growth in employment and reducing resource slack more generally. Because a further significant weakening in the economic outlook would likely be associated with further disinflation, in the current environment there is little or no potential conflict between the goals of supporting growth and employment and of maintaining price stability.
A first option for providing additional monetary accommodation, if necessary, is to expand the Federal Reserve's holdings of longer-term securities. As I noted earlier, the evidence suggests that the Fed's earlier program of purchases was effective in bringing down term premiums and lowering the costs of borrowing in a number of private credit markets. I regard the program (which was significantly expanded in March 2009) as having made an important contribution to the economic stabilization and recovery that began in the spring of 2009. Likewise, the FOMC's recent decision to stabilize the Federal Reserve's securities holdings should promote financial conditions supportive of recovery.Bernanke was not as positive on changes to the "extended period" language or reducing the interest rate on excess reserves.
I believe that additional purchases of longer-term securities, should the FOMC choose to undertake them, would be effective in further easing financial conditions.
"Revenue is being affected by weaker than expected demand for consumer PCs in mature markets," the company said in a statement.Or perhaps the unemployment rate ticking up in the August employment report next Friday might be enough. There will be plenty of data released before the September 21 FOMC meeting (and if the data is weaker, the meeting might be expanded to two days). Or perhaps the FOMC will wait until November, but it does appears Bernanke is preparing everyone for QE2.
Bernanke: The Economic Outlook and Monetary Policy
by Calculated Risk on 8/27/2010 10:02:00 AM
From Fed Chairman Ben Bernanke: The Economic Outlook and Monetary Policy. Excerpt on monetary policy:
Policy Options for Further EasingPaving the way for QE2.
...
I will focus here on three that have been part of recent staff analyses and discussion at FOMC meetings: (1) conducting additional purchases of longer-term securities, (2) modifying the Committee's communication, and (3) reducing the interest paid on excess reserves. I will also comment on a fourth strategy, proposed by several economists--namely, that the FOMC increase its inflation goals.
A first option for providing additional monetary accommodation, if necessary, is to expand the Federal Reserve's holdings of longer-term securities. ...
A second policy option for the FOMC would be to ease financial conditions through its communication, for example, by modifying its post-meeting statement. ...
A third option for further monetary policy easing is to lower the rate of interest that the Fed pays banks on the reserves they hold with the Federal Reserve System. Inside the Fed this rate is known as the IOER rate, the "interest on excess reserves" rate. The IOER rate, currently set at 25 basis points, could be reduced to, say, 10 basis points or even to zero. ...
A rather different type of policy option, which has been proposed by a number of economists, would have the Committee increase its medium-term inflation goals above levels consistent with price stability. I see no support for this option on the FOMC.
Update: Bernanke also addressed WHEN the FOMC will act:
Each of the tools that the FOMC has available to provide further policy accommodation--including longer-term securities asset purchases, changes in communication, and reducing the IOER rate--has benefits and drawbacks, which must be appropriately balanced. Under what conditions would the FOMC make further use of these or related policy tools? At this juncture, the Committee has not agreed on specific criteria or triggers for further action, but I can make two general observations.
First, the FOMC will strongly resist deviations from price stability in the downward direction. Falling into deflation is not a significant risk for the United States at this time, but that is true in part because the public understands that the Federal Reserve will be vigilant and proactive in addressing significant further disinflation. It is worthwhile to note that, if deflation risks were to increase, the benefit-cost tradeoffs of some of our policy tools could become significantly more favorable.
Second, regardless of the risks of deflation, the FOMC will do all that it can to ensure continuation of the economic recovery. Consistent with our mandate, the Federal Reserve is committed to promoting growth in employment and reducing resource slack more generally. Because a further significant weakening in the economic outlook would likely be associated with further disinflation, in the current environment there is little or no potential conflict between the goals of supporting growth and employment and of maintaining price stability.
Q2 real GDP revised down to 1.6% annualized growth rate
by Calculated Risk on 8/27/2010 08:48:00 AM
From the BEA: Gross Domestic Product, 2nd quarter 2010 (second estimate)
The following table shows the changes from the advance release (this is the Contributions to Percent Change in Real Gross Domestic Product).
The largest downward revisions were to the change in private inventories, imports, and non-residential structure investment. Personal consumption expenditures and investment in Equipment and software were revised up.
| Advance | 2nd Estimate (Revision) | Change | |
|---|---|---|---|
| Percent change at annual rate: | |||
| Gross domestic product | 2.4 | 1.6 | -0.8 |
| Percentage points at annual rates: | |||
| Personal consumption expenditures | 1.15 | 1.38 | 0.23 |
| Goods | 0.79 | 0.82 | 0.03 |
| Durable goods | 0.53 | 0.49 | -0.04 |
| Nondurable goods | 0.25 | 0.33 | 0.08 |
| Services | 0.36 | 0.56 | 0.20 |
| Gross private domestic investment | 3.14 | 2.75 | -0.39 |
| Fixed investment | 2.09 | 2.12 | 0.03 |
| Nonresidential | 1.50 | 1.54 | 0.04 |
| Structures | 0.14 | 0.01 | -0.13 |
| Equipment and software | 1.36 | 1.53 | 0.17 |
| Residential | 0.59 | 0.58 | -0.01 |
| Change in private inventories | 1.05 | 0.63 | -0.42 |
| Net exports of goods and services | -2.78 | -3.37 | -0.59 |
| Exports | 1.22 | 1.08 | -0.14 |
| Imports | -4.00 | -4.45 | -0.45 |
| Government consumption expenditures and gross investment | 0.88 | 0.86 | -0.02 |
| Federal | 0.72 | 0.72 | 0.00 |
| National defense | 0.4 | 0.39 | -0.01 |
| Nondefense | 0.33 | 0.32 | -0.01 |
| State and local | 0.16 | 0.14 | -0.02 |
Thursday, August 26, 2010
Summary, Fannie-Freddie "Autopsy", and European Bond Spreads
by Calculated Risk on 8/26/2010 10:10:00 PM
Here’s a last-minute option for summer reading material: An autopsy on Fannie Mae and Freddie Mac by their overseer, the Federal Housing Finance Agency.
The report aims to inform the continuing debate in Washington about the future of the government’s role in housing finance. It’s not hard sledding, just 15 pages of bullet points and charts. And it does a good job of making a few key points:
1. Fannie and Freddie did not cause the housing bubble. ...
2. This was not for a lack of trying. ...
3. Importantly, the companies’ losses are mostly in their core business of guaranteeing loans, not in their investment portfolios.
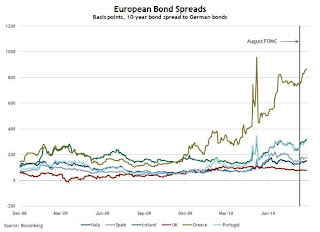 Click on graph for larger image in new window.
From the Atlanta Fed:
Peripheral European bond spreads (over German bonds) have risen since the August FOMC meeting.In fact the Greece-to-Germany, and the Ireland-to-Germany, bond spreads are near the levels reached during the May financial crisis.
 The total percent of loans delinquent or in the foreclosure process declined only slightly in Q2 from Q1 - and the rate is the second highest on record.
Loans 30 days delinquent increased to 3.51%, and this is about the same levels as in Q4 2008 (slightly below the peak of 3.77% in Q1 2009).
Delinquent loans decreased in all other buckets - especially in the 90+ day bucket. MBA Chief Economist Jay Brinkmann suggested the decline in the 90+ day bucket was because of some successful modifications - since the lenders reported the loans as delinquent until the modification was made permanent.
 This graph shows the negative equity and near negative equity by state.
 Although the five states mentioned above have the largest percentage of homeowners underwater, 10 percent or more of homeowners with mortgages in 33 states and the D.C. have negative equity.
Are lenders "procrastinating" on foreclosures?
by Calculated Risk on 8/26/2010 07:13:00 PM
From Jeff Horwitz and Kate Berry at American Banker: Procrastination on Foreclosures, Now 'Blatant,' May Backfire
[S]ervicers are not initiating or processing foreclosures at the pace they could be.There is much more in the article.
By postponing the date at which they lock in losses, banks and other investors positioned themselves to benefit from the slow mending of the real estate market. But now industry executives are questioning whether delaying foreclosures — a strategy contrary to the industry adage that "the first loss is the best loss" — is about to backfire. With home prices expected to fall as much as 10% further, the refusal to foreclose quickly on and sell distressed homes at inventory-clearing prices may be contributing to the stall of the overall market seen in July sales data.
...
Banks have filed fewer notices of default so far this year in California ... than they did 2009 or 2008, according to data gathered by [RadarLogic]. Foreclosure default notices are now at their lowest level since the second quarter of 2007, when the percentage of seriously delinquent loans in the state was one-sixth what it is now.
New data from LPS Applied Analytics in Jacksonville, Fla., suggests that the backlog is no longer worsening nationally — but foreclosures are not at the levels needed to clear existing inventory.
...
"The industry as a whole got into a panic mode and was worried about all these loans going into foreclosure and driving prices down, so they got all these programs, started Hamp and internal mods and short sales," said John Marecki, vice president of East Coast foreclosure operations for Prommis Solutions ... "Now they're looking at this, how they held off and they're getting to the point where maybe they made a mistake in that realm."
...
"The math doesn't bode well for what is ultimately going to occur on the real estate market," said Herb Blecher, a vice president at LPS. "You start asking yourself the question when you look at these numbers whether we are fixing the problem or delaying the inevitable."
Note: The LPS delinquency data for July will be released tomorrow. Here are some of the findings (no link):
• July showed an astounding 24.5% month-over-month increase in foreclosure starts, which dovetails with Treasury's latest report on HAMP cancellations (approx. 50% according to Treasury's numbers)The report shows the GSEs are stepping up foreclosures.
• Abysmal foreclosure rates in NV, FL and CA have led to much higher level equity loss for homeowners in those states as compared to the rest of the country.
• Cure rates remain steady, but seriously delinquent (6 mos.+) cures have declined significantly, by approximately 25%
• Origination remains depressed due to much stricter underwriting guidelines and low purchase activity, but what is being originated is of good quality.
• Until the deterioration ratio improves from its steady two deteriorations for every one improvement, it's hard to see how we're going to get out of the hole.


