 RSS Feed
 by Calculated Risk on 8/11/2010 04:30:00 PM
Wednesday, August 11, 2010
Ceridian-UCLA: Diesel Fuel index increases in July
This is the new UCLA Anderson Forecast and Ceridian Corporation index using real-time diesel fuel consumption data: Pulse of Commerce IndexTM
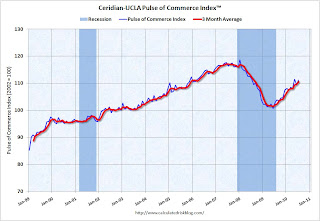
Press Release: PCI Climbs in July, Confirming Economy’s Slow but Steady Recovery
All signs continue to point to an economy in recovery with the latest release of the Ceridian-UCLA Pulse of Commerce Index™ (PCI) by UCLA Anderson School of Management. The July PCI climbed 1.7 percent after dropping 1.9 percent in June.
...
“The key takeaway from the July report is that the economy continues to recover – which is encouraging – but the pace needs to substantially pick up to put people back to work,” said Ed Leamer, chief PCI economist. “With the unemployment rate still at 9.5 percent and consumers understandably nervous about opening their wallets, it is hard to be very optimistic about economic growth. On the other hand, there is nothing about the PCI that is supportive of the pessimistic double-dip view.”
...
The PCI is based on an analysis of real-time diesel fuel consumption data from over the road trucking tracked by Ceridian ...
 Click on graph for larger image in new window.
This graph shows the index since January 1999.
This is a new index and doesn't have much of a track record in real time - although it appears to suggest that the sluggish recovery was continuing in July.
NY Fed Plans to Buy $18 billion in Treasuries over the next month
by Calculated Risk on 8/11/2010 03:03:00 PM
This is a followup to the FOMC announcement yesterday ...
From the NY Fed: New York Fed releases tentative outright Treasury operation schedule
[T]he Desk plans to purchase approximately $18 billion. This is the amount of principal payments from agency debt and agency MBS expected to be received between mid-August and mid-September, adjusted for prior SOMA agency MBS purchases that have been allocated since August 4.The $18 billion will be spread over 9 purchases (one of TIPS), with duration of 2 to 30
Two Stories: More Homeowner Assistance for Unemployed, Q2 GDP likely to be Revised Down
by Calculated Risk on 8/11/2010 01:00:00 PM
A couple of stories ...
From HUD: Obama Administration Announces Additional Support for Targeted Foreclosure-Prevention Programs to Help Homeowners Struggling with Unemployment
Treasury’s Hardest Hit Fund Will Provide $2 Billion of Additional Assistance in 17 states and the District of Columbia; HUD to Launch a New $1 Billion Program to Help Unemployed Borrowers in Other AreasThis is an extension of a program announced in February to help the unemployed.
...
The program will work through a variety of state and non-profit entities and will offer a declining balance, deferred payment “bridge loan” (zero percent interest, non-recourse, subordinate loan) for up to $50,000 to assist eligible borrowers with payments on their mortgage principal, interest, mortgage insurance, taxes and hazard insurance for up to 24 months.
And from Catherine Rampell at the NY Times Economix: 2nd Quarter G.D.P. May Be Revised Even Lower
The government’s preliminary estimate for economic growth in the second quarter is likely to be revised substantially lower.
...
"Combining the bigger-than-expected trade deficit with other weak data suggests that Q2 growth was only 1.2 percent rather than the 2.4 percent originally estimated, placing the economy on even shakier ground than it seemed,” wrote Nigel Gault, chief United States economist at IHS Global Insight
BLS: Low Labor Turnover in June
by Calculated Risk on 8/11/2010 10:26:00 AM
From the BLS: Job Openings and Labor Turnover Summary
The number of job openings in June was 2.9 million, which was little changed from May. Although the month-to-month change is small, the number of job openings has risen by 599,000 (26 percent) since the most recent series trough of 2.3 million in July 2009. Even with the gains since July 2009, the number of job openings remained well below the 4.4 million open jobs when the recession began in December 2007...Note: The difference between JOLTS hires and separations is similar to the CES (payroll survey) net jobs headline numbers. The CES (Current Employment Statistics, payroll survey) is for positions, the CPS (Current Population Survey, commonly called the household survey) is for people.
The following graph shows job openings (purple), hires (blue), Total separations (include layoffs, discharges and quits) (red) and Layoff, Discharges and other (yellow) from the JOLTS.
Unfortunately this is a new series and only started in December 2000.
 Click on graph for larger image in new window.
Notice that hires (blue) and separations (red) are pretty close each month. In June, about 4.35 million people lost (or left) their jobs, and 4.25 million were hired (this is the labor turnover in the economy) for a loss of 97,000 jobs in June (this includes Census jobs lost).
When the hires (blue line) is above total separations, the economy is adding net jobs, when the blue line is below total separations (as in June), the economy is losing net jobs.
Note: The temporary Census hiring has distorted this series over the last few months.
The separations in June included the 225 thousand temporary Census 2010 jobs lost. Layoffs and discharges increased in June, but that is probably because of the temporary Census jobs. The number of job openings also decreased slightly in June, after increasing earlier this year.
The overall turnover, especially after removing the impact of the Census hiring, is still low.
Trade Deficit increases sharply in June
by Calculated Risk on 8/11/2010 08:30:00 AM
The Census Bureau reports:
[T]otal June exports of $150.5 billion and imports of $200.3 billion resulted in a goods and services deficit of $49.9 billion, up from $42.0 billion in May, revised.
 Click on graph for larger image.
The first graph shows the monthly U.S. exports and imports in dollars through June 2010.
Clearly imports are increasing much faster than exports. On a year-over-year basis, exports are up 17% and imports are up 29%. This is an easy comparison because of the collapse in trade at the end of 2008 and into early 2009.
The second graph shows the U.S. trade deficit, with and without petroleum, through June.
 The blue line is the total deficit, and the black line is the petroleum deficit, and the red line is the trade deficit ex-petroleum products.
The increase in the deficit in June was unrelated to oil as the trade gap with China increased to $26.15 billion in June - the highest level since October 2008 and up sharply from last year. Once again the imbalances have returned ...
MBA: Mortgage Applications Essentially Unchanged Despite Lowest Rates
by Calculated Risk on 8/11/2010 07:35:00 AM
The MBA reports: Mortgage Applications Essentially Unchanged Despite Lowest Rates
The Refinance Index increased 0.6 percent from the previous week and the seasonally adjusted Purchase Index increased 0.3 percent from one week earlier.
...
The average contract interest rate for 30-year fixed-rate mortgages decreased to 4.57 percent from 4.60 percent, with points decreasing to 0.89 from 0.93 (including the origination fee) for 80 percent loan-to-value (LTV) ratio loans. This was the lowest 30-year contract rate ever recorded in the survey.
 Click on graph for larger image in new window.
This graph shows the MBA Purchase Index and four week moving average since 1990.
The purchase index has increased slightly for four straight weeks - but is still 40% below the level of the last week of April (and about 32% below the last week of April using the 4-week average).
This recent collapse in the purchase index has already shown up as a decline in new home sales (counted when the contract is signed), and will show up in the July and August existing home sales reports (counted at close of escrow).
Note: Mortgage rates will probably fall to another record low this week too.
Tuesday, August 10, 2010
Lowell: The Natural History of a Rumor
by Calculated Risk on 8/10/2010 08:55:00 PM
Linda Lowell at HousingWire wrote a great piece chronicling the history of that ridiculous rumor last week of a massive bailout of underwater homeowners: "Slam Dunk Stimulus" – The Natural History of a Rumor
I'd like to thank Linda for mentioning my reaction ("nonsense"). I usually ignore these rumors, but this one was getting significant coverage and was obviously nonsense.
Linda's piece is excellent.
"Quantitative Neutrality"
by Calculated Risk on 8/10/2010 06:14:00 PM
People are struggling with a name for the Fed's action today. I've seen QE 1.5 and variations, but perhaps the best comes from Asha Bangalore at Northern Trust who called it Quantitative Neutrality (QN), see: Fed Moves from "QE" to "QN"
The Fed's goal (according to the technical note from the NY Fed) is to "maintain the face value of outright holdings of domestic securities" at approximately $2.054 trillion. Click on graph for larger image in new window.
The red line on this graph is the amount of outright holdings on the Fed's balance sheet. The dashed line is the new target level. This is about $17 billion below the peak of a few weeks ago.
The outright holdings were expected to fall by about $200 billion by the end of 2011 (some have estimated as high as $400 billion), and that would represent tightening in the face of high unemployment and below target inflation.
The NY Fed will announce the size of the September purchases tomorrow and that will give an idea of how much the Fed expected the outright holdings to fall. The recent increase in refinance activity might have accelerated the process.
NY Fed: Technical Note on Reinvestment
by Calculated Risk on 8/10/2010 02:47:00 PM
From the Open Market Trading Desk: Statement Regarding Reinvestment of Principal Payments on Agency Debt and Agency MBS
On August 10, 2010, the Federal Open Market Committee directed the Open Market Trading Desk (the Desk) at the Federal Reserve Bank of New York to keep constant the Federal Reserve’s holdings of securities at their current level by reinvesting principal payments from agency debt and agency mortgage-backed securities (agency MBS) in longer-term Treasury securities. The most recent H.4.1 data release indicates that outright holdings of domestic securities in the System Open Market Account (SOMA) totaled $2.054 trillion as of August 4, 2010. The Desk will seek to maintain the face value of outright holdings of domestic securities in the SOMA at approximately this level. Due to differences in settlement dates for purchases and principal payments, it is anticipated that the actual level of domestic securities held will vary around this level to some degree.
In the middle of each month, the Desk will publish a tentative schedule of purchase operations expected to take place through the middle of the following month, as well as the anticipated total amount of purchases to be conducted over that period. The anticipated total amount of purchases will be calibrated to offset the amount of principal payments from agency debt and agency MBS expected to be received over that period. The announcement will occur shortly after the monthly releases of current MBS factors from Fannie Mae, Freddie Mac, and Ginnie Mae, allowing the Desk to anticipate the principal payments to be received by the SOMA portfolio over the period.
The first tentative schedule of purchase operations and the anticipated total amount of purchases to be conducted through the middle of September will be published tomorrow, August 11, at 3 p.m. The purchase schedule will include a list of operation dates, settlement dates, security types to be purchased (nominal coupons or TIPS), and a maturity date range of eligible issues for each scheduled operation. The Desk expects to begin purchasing Treasury securities under this policy on or around August 17.
The Desk will concentrate its purchases in the 2- to 10-year sector of the nominal Treasury curve, although purchases will occur across the nominal Treasury coupon and TIPS yield curves. The Desk will typically refrain from purchasing securities for which there is heightened demand or of which the SOMA already holds large concentrations.
Purchases will be conducted with the Federal Reserve’s primary dealers through a series of competitive auctions via the Desk’s FedTrade system. The exact list of securities eligible for purchase will be made available at the beginning of each purchase operation. The results of each operation will be published on the Federal Reserve Bank of New York’s website shortly after each purchase operation has concluded.
FAQs: Reinvestment of Principal Payments on Agency Debt and Agency Mortgage-Backed Securities in Treasuries
FOMC Statement: Weaker Economy, to Reinvest
by Calculated Risk on 8/10/2010 02:15:00 PM
The key is the reinvestment of maturing MBS in long term Treasury securities!
From the Fed:
Information received since the Federal Open Market Committee met in June indicates that the pace of recovery in output and employment has slowed in recent months. Household spending is increasing gradually, but remains constrained by high unemployment, modest income growth, lower housing wealth, and tight credit. Business spending on equipment and software is rising; however, investment in nonresidential structures continues to be weak and employers remain reluctant to add to payrolls. Housing starts remain at a depressed level. Bank lending has continued to contract. Nonetheless, the Committee anticipates a gradual return to higher levels of resource utilization in a context of price stability, although the pace of economic recovery is likely to be more modest in the near term than had been anticipated.The language about rates stayed the same: "The Committee ... continues to anticipate that economic conditions, including low rates of resource utilization, subdued inflation trends, and stable inflation expectations, are likely to warrant exceptionally low levels of the federal funds rate for an extended period."
Measures of underlying inflation have trended lower in recent quarters and, with substantial resource slack continuing to restrain cost pressures and longer-term inflation expectations stable, inflation is likely to be subdued for some time.
The Committee will maintain the target range for the federal funds rate at 0 to 1/4 percent and continues to anticipate that economic conditions, including low rates of resource utilization, subdued inflation trends, and stable inflation expectations, are likely to warrant exceptionally low levels of the federal funds rate for an extended period.
To help support the economic recovery in a context of price stability, the Committee will keep constant the Federal Reserve's holdings of securities at their current level by reinvesting principal payments from agency debt and agency mortgage-backed securities in longer-term Treasury securities.1 The Committee will continue to roll over the Federal Reserve's holdings of Treasury securities as they mature.
The Committee will continue to monitor the economic outlook and financial developments and will employ its policy tools as necessary to promote economic recovery and price stability.
Voting for the FOMC monetary policy action were: Ben S. Bernanke, Chairman; William C. Dudley, Vice Chairman; James Bullard; Elizabeth A. Duke; Donald L. Kohn; Sandra Pianalto; Eric S. Rosengren; Daniel K. Tarullo; and Kevin M. Warsh.
Voting against the policy was Thomas M. Hoenig, who judges that the economy is recovering modestly, as projected. Accordingly, he believed that continuing to express the expectation of exceptionally low levels of the federal funds rate for an extended period was no longer warranted and limits the Committee's ability to adjust policy when needed. In addition, given economic and financial conditions, Mr. Hoenig did not believe that keeping constant the size of the Federal Reserve's holdings of longer-term securities at their current level was required to support a return to the Committee's policy objectives.


