 RSS Feed
 by Calculated Risk on 7/28/2010 07:53:00 AM
Wednesday, July 28, 2010
MBA: Mortgage Purchase Applications increase slightly last week
The MBA reports: Mortgage Applications Decrease in Latest MBA Weekly Survey
The Refinance Index decreased 5.9 percent from the previous week. The seasonally adjusted Purchase Index increased 2.0 percent from one week earlier and is the highest Purchase Index observed in the survey since the end of June.
...
The average contract interest rate for 30-year fixed-rate mortgages increased to 4.69 percent from 4.59 percent, with points decreasing to 0.88 from 1.04 (including the origination fee) for 80 percent loan-to-value (LTV) ratio loans.
 Click on graph for larger image in new window.
This graph shows the MBA Purchase Index and four week moving average since 1990.
Although the weekly applications index increased slightly, the 4-week average is still near the levels of 1996.
This collapse in the mortgage application index has already shown up as a decline in new home sales, and will show up in the July and August existing home sales reports (counted at close of escrow).
Tuesday, July 27, 2010
Paper: Policy helped avert Great Depression II
by Calculated Risk on 7/27/2010 10:58:00 PM
Alan Blinder and Mark Zandi will release a new paper tomorrow analyzing the impact of the policy response to the crisis ... Sewell Chan at the NY Times has a preview: In Study, 2 Economists Say Intervention Helped Avert a 2nd Depression
In a new paper, [Alan S. Blinder, a Princeton professor and former vice chairman of the Fed, and Mark Zandi, chief economist at Moody’s Analytics] argue that without the Wall Street bailout, the bank stress tests, the emergency lending and asset purchases by the Federal Reserve, and the Obama administration’s fiscal stimulus program, the nation’s gross domestic product would be about 6.5 percent lower this year.I'll post a link tomorrow (if it is available). David Leonhardt adds:
In addition, there would be about 8.5 million fewer jobs, on top of the more than 8 million already lost; and the economy would be experiencing deflation, instead of low inflation.
As Mr. Blinder and Mr. Zandi note, their estimates of the fiscal stimulus are similar to the estimates of others — including the Congressional Budget Office.Although Zandi completely missed the housing bubble, I've been using his estimates of the impact of policy (and estimates from Goldman Sachs), and I think they have been very useful in forecasting.
How far will the homeownership rate fall?
by Calculated Risk on 7/27/2010 07:32:00 PM
Earlier today the Census Bureau released the homeownership and vacancy rates for Q2 2010.
I posted a few graphs this morning, and I noted that the homeownership rate had fallen to the 1999 level of 66.9%.
A few years ago - when the homeownership rate was at 69%, I forecast that the rate would probably fall to the 66% to 67% range. Here is a repeat of the graph from this morning showing the trend of the homeownership rate since 1965. Click on graph for larger image in new window.
Note: graph starts at 60% to better show the change.
As I noted this morning, the homeownership rate increased in the '90s and first half of the '00s because of changes in demographics and "innovations" in mortgage lending. My guess is the increase due to demographics (older population) will probably stick, but the mortgage "innovation" increase will disappear.
Using the data from the Census Bureau on number of households per age cohort, we can calculate what would have happened to the overall homeownership rate if the rate per age cohort had stayed the same as in 1989 or in 1999.
Using the 1989 percentages, the homeownership rate would have increased from 63.9% in 1989 to 66.2% in 2009 just because of the aging population. Using the 1999 homeownership percentages, the homeownership rate would be 66.8% given the changes in demographics. That was the basis for my original forecast of the homeownership rate falling to the 66% to 67% range.
It is certainly possible that the homeownership rate might fall further than I originally expected since certain cohorts now own at a lower than historically normal rate - and many of these people might be turned off on home ownership for some time (if not forever). The second graph shows the homeownership rate by age cohort for 1989, 1999, 2005 (peak of housing bubble), and Q2 2010.
For those currently under 30, the homeownership rate is above the 1989 and 1999 levels - probably because most of these people were too young to participate in the insanity and some have taken advantage of the first time home buyer tax credit.
For the 30 to 60 groups, the homeownership rate is currently below the 1989 and 1999 levels. These groups were in their early 20s to early 50s during the bubble years - the prime buying years.
For the groups above 60 years old, the homeownership rate has stayed above the 1989 level. Most of these people already owned and probably didn't participate in the insanity.
But notice the highest cohort (over 75 years old). The homeownership rate is above the bubble years! This could mean that some people are staying in their homes, perhaps waiting for a better market to sell.
This does shows that the most impacted cohorts are currently in the 30 to 60 age groups, with the 30 to 35 year old cohort the hardest hit group (in their mid to late 20s during the bubble). The next hardest hit groups are the 45 to 59 cohorts - probably because some people were moving up to more home than they could afford.
For now I'll stick with my prediction of the homeownership rate falling to 66% or so, but it could certainly fall lower.
Survey: Local Government job losses projected to approach 500,000
by Calculated Risk on 7/27/2010 05:02:00 PM
As a follow-up to point 6 of the previous posts on the 2nd half slowdown (cutbacks at the state and local level), here is a new report released today: Job losses projected to approach 500,000 (ht Brian)
The effects of the Great Recession on local budgets will be felt most deeply from 2010 to 2012. In response, local governments are cutting services and personnel. This report from the National League of Cities (NLC), National Association of Counties (NACo), and the U.S. Conference of Mayors (USCM) reveals that local government job losses in the current and next fiscal years will approach 500,000, with public safety, public works, public health, social services and parks and recreation hardest hit by the cutbacks.According to the BLS, local governments (ex-education) have cut 89,000 jobs over the last year, and this survey suggests there will be much deeper cuts ahead.
...
In May and June of 2010 NLC, NACo and USCM conducted a survey of cities and counties across the country for the purpose of gauging the extent of job losses. The survey was emailed and faxed to all cities over 25,000 in population and to all counties over 100,000 in population. The survey results presented below are based on 270 responses, 214 responses from cities and 56 responses from counties.
...
The surveyed local governments report cutting 8.6 percent of total full-time equivalent (FTE) positions over the previous fiscal year to the next fiscal year (roughly 2009-2011). If applied to total local government employment nationwide, an 8.6 percent cut in the workforce would mean that 481,000 local government workers were, or will be, laid off over the two-year period. Projected cuts for the next fiscal year will likely increase as many of the nation’s local governments draft new budgets, deliberate about how to balance shortfalls and adopt new budgets.
The survey has a list or respondents (page 6) and several examples.
2nd Half Slowdown Update
by Calculated Risk on 7/27/2010 01:25:00 PM
"For me a double-dip is another recession before we've healed from this recession ... The probability of that kind of double-dip is more than 50 percent. I actually expect it."Now that the 2nd half slowdown is here, it might be worth reviewing some of the arguments for a slowdown:
Professor Robert Shiller, July 27, 2010 (via Reuters: Chance of Double-Dip US Recession is High: Shiller)
1) less Federal stimulus spending in the 2nd half of 2010.
The only additional stimulus has been the extension of the qualifying dates for unemployment benefits. Even with this extension, the overall stimulus peaked in Q2 or possibly Q3.
2) the end of the inventory correction.
This is pretty clear in the data, and we are seeing a slowdown in growth for the manufacturing sector (but not contraction). This is one of the reasons I'm tracking the regional manufacturing surveys so closely this week.
3) more household saving leading to slower growth in personal consumption expenditures.
This still isn't clear, although the personal saving rate ticked up in May.
4) another downturn in housing (lower prices, less residential investment).
It is clear that residential investment will be a drag on GDP in Q3. As far as prices, the declining prices will not show up until the September reports - or possibly the October reports (released with a significant lag). So this still seems correct, especially with the existing home months-of-supply in double digits. Diana Olick at CNBC quoted NAR chief economist Lawrence Yun:
Even the always glass-is-half-full chief economist Lawrence Yun made clear several times in the briefing before the report's release, that he expects home prices to come under significant pressure over the coming months, as inventories rise.Usually Yun is too optimistic.
...
Inventories will surpass ten months," says Yun. "If sustained, prices will surely be under pressure." Yun added that he originally expected the drag after the tax credit expiration to last about two months; he's now pushing that forecast to three to four months.
5) slowdown in China and Europe and
Growth in China has slowed, from the WSJ:
China's central bank struck a confident note Tuesday, saying the country's current economic slowdown is beneficial for long-term sustainable growth, and there is little risk of a "double-dip" recession.6) cutbacks at the state and local level.
"Although economic growth is showing signs of slowing down, China's current economic fundamentals are still very good. While a further slowdown and stabilization of growth is likely, the possibility of a double-dip is low," the People's Bank of China said in a quarterly report on the economy's performance.
This is starting to happen, and I expect the number of layoffs to increase later this year.
I still think we will avoid a technical double dip recession, but that won't matter to the people impacted by the slowdown.
Note: if the economy does slide into a recession, it will probably be consider a continuation of the recession that started in December 2007, see: Recession Dating and a "Double Dip"
Richmond Fed: Manufacturing Activity Moderates in July; Expectations Slip
by Calculated Risk on 7/27/2010 11:13:00 AM
Note: Usually I don't post all the regional manufacturing surveys, however with the inventory adjustment over, export growth appearing to slow, and domestic consumer demand sluggish, these surveys might provide a hint of weakness in the manufacturing sector.
From the Richmond Fed: Manufacturing Activity Moderates in July; Expectations Slip
In July, the seasonally adjusted composite index of manufacturing activity — our broadest measure of manufacturing — declined seven points to 16 from June's reading of 23. Among the index's components, shipments lost nine points to 22, new orders dropped 12 points to finish at 13, while the jobs index moved up six points to 15.This is similar to the Dallas Fed report yesterday: Texas Manufacturing Activity Remains Sluggish. It appears growth in the manufacturing sector is slowing.
...
Other indicators also suggested somewhat slower activity. The backlog of orders measure moved down two points to 1, and the index for capacity utilization fell eight points to 13.
Q2 2010: Homeownership Rate Lowest Since 1999
by Calculated Risk on 7/27/2010 10:00:00 AM
The Census Bureau reported the homeownership and vacancy rates for Q2 2010 this morning. Here are a few graphs ... Click on graph for larger image in new window.
The homeownership rate declined to 66.9%. This is the lowest level since 1999.
Note: graph starts at 60% to better show the change.
The homeownership rate increased in the '90s and early '00s because of changes in demographics and "innovations" in mortgage lending. The increase due to demographics (older population) will probably stick, so I've been expecting the rate to decline to the 66% to 67% range - and not all the way back to 64% to 65%.
I'll have to revisit this now that the homeownership rate has fallen back to the top of the range I expected!  The homeowner vacancy rate declined to 2.5% in Q2 2010.
A normal rate for recent years appears to be about 1.7%.
This leaves the homeowner vacancy rate about 0.8% above normal. This data is not perfect, but based on the approximately 75 million homeowner occupied homes, we can estimate that there are close to 500 thousand excess vacant homes.
The rental vacancy rate was steady at 10.6% in Q2 2010.  Other reports have suggested that the rental vacancy rate has declined slightly. This report is nationwide and includes homes for rent.
It's hard to define a "normal" rental vacancy rate based on the historical series, but we can probably expect the rate to trend back towards 8%. According to the Census Bureau there are close to 41 million rental units in the U.S. If the rental vacancy rate declined from 10.6% to 8%, then 2.6% X 41 million units or 1.07 million excess units would have to be absorbed.
This suggests there are still about 1.6 million excess housing units. These excess units will keep pressure on housing starts, rents and house prices for some time.
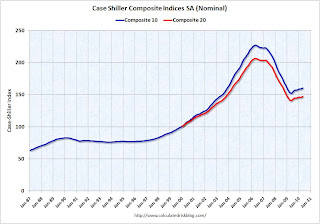
Case-Shiller: House Price indexes increase in May
by Calculated Risk on 7/27/2010 09:00:00 AM
IMPORTANT: These graphs are Seasonally Adjusted (SA). S&P has cautioned that the seasonal adjustment is probably being distorted by irregular factors. These distortions could include distressed sales and the various government programs.
S&P/Case-Shiller released the monthly Home Price Indices for May (actually a 3 month average).
This includes prices for 20 individual cities, and two composite indices (10 cities and 20 cities).
From S&P: For the Past Year Home Prices Have Generally Moved Sideways
Data through May 2010, released today by Standard & Poor’s for its S&P/Case-Shiller1 Home Price Indices, the leading measure of U.S. home prices, show that the annual growth rates in 15 of the 20 MSAs and the 10- and 20-City Composites improved in May compared to those reported for April 2010. The 10-City Composite is up 5.4% and the 20-City Composite is up 4.6%from where they were in May 2009. While 19 MSAs and both Composites reported positive monthly changes in May over April, only 12 of the MSAs and the two Composites saw better month-over-month growth rates in May than those reported in April.
 Click on graph for larger image in new window.
 The first graph shows the nominal seasonally adjusted Composite 10 and Composite 20 indices (the Composite 20 was started in January 2000).
The Composite 10 index is off 29.3% from the peak, and up 1.0% in May (SA).
The Composite 20 index is off 28.7% from the peak, and up 1.1% in May (SA).
 The second graph shows the Year over year change in both indices.
The Composite 10 is up 5.4% compared to May 2009.
The Composite 20 is up 4.6% compared to May 2009.
This is the fourth month with YoY price increases in a row.
The third graph shows the price declines from the peak for each city included in S&P/Case-Shiller indices.
 Prices increased (SA) in 15 of the 20 Case-Shiller cities in May seasonally adjusted.
Prices in Las Vegas are off 56.1% from the peak, and prices in Dallas only off 4.8% from the peak.
Case Shiller is reporting on the NSA data (19 cities with increasing prices), and I'm using the SA data. I'm not sure why S&P calls a 5% increase "moving sideways". Prices are probably starting to fall right now, but this will not show up in the Case-Shiller index for a few months.
Monday, July 26, 2010
Home builders to start building more homes?
by Calculated Risk on 7/26/2010 09:13:00 PM
The following article discusses both new and existing home supply. Here is a short excerpt on new homes ...
From Robbie Whelan at the WSJ: Supply of Homes Set to Grow
Home builders ... are stuck with thousands of acres that are prone to lose value as the market struggles. Many will build homes on the land, rather than write off its value and wait for the market to improve.In some communities with excess supply, home builders are competing with the distressed sales by building smaller homes. As an example, a couple months ago David Streitfeld at the NY Times wrote about a building boom in Las Vegas: In City of Homes That Sit Empty, Building Booms
... "They're discounting the homes, they're making very small profit margins, but they're building homes." [said Brad Hunter, chief economist at Metrostudy]
...
Other indicators also point to builders preparing to increase home construction, despite lagging sales. The number of finished vacant lots, or parcels of land that have been developed and readied for building, stands at about 1.2 million nationwide, according to Metrostudy, or just 5% below the peak in late 2008.
Home prices in Las Vegas are down by 60 percent from 2006 in one of the steepest descents in modern times. There are 9,517 spanking new houses sitting empty. An additional 5,600 homes were repossessed by lenders in the first three months of this year and could soon be for sale.But just because they have the lots, I hope they don't start overbuilding again.
Yet builders here are putting up 1,100 homes, and they are frantically buying lots for even more. ... Land and labor costs have fallen significantly, so the newest homes are competitively priced.
Jim the Realtor: Beach Cheapie?
by Calculated Risk on 7/26/2010 05:57:00 PM
Earlier (with graphs): New Home Sales: Worst June on Record
I haven't checked in with Jim for some time. This 800 sq ft REO is "cheap"?


