 RSS Feed
 by Calculated Risk on 7/21/2010 01:50:00 PM
Wednesday, July 21, 2010
Live Feeds: Bernanke Testimony at 2 PM ET
Here are two live feeds for Fed Chairman Ben Bernanke's testimony to the Senate Banking Committee: The Semiannual Monetary Policy Report to the Congress
Here is the CNBC feed.
Here is the C-Span3 Link
Prepared testimony: Semiannual Monetary Policy Report to the Congress
Existing Homes: Months of Supply and House Prices
by Calculated Risk on 7/21/2010 12:08:00 PM
Earlier I mentioned that a normal housing market usually has under 6 months of supply. The NAR reported that months of supply was at 8.3 months in May, and the months of supply was probably be higher in June (to be reported tomorrow).
A quick estimate: If sales are 5.3 million (SAAR) in June, and inventory stays the same at 3.9 million units, the months of supply will rise to 8.8 months in June.
This is calculated as: 3.9 divided by 5.3 * 12 (months) = 8.8 months of supply.
For July, if sales fall to 4.5 million (it could be lower) and inventory is still at 3.9 million units, months of supply will rise to 10.4 months.
I think these estimates are conservative (actual will probably be higher). For reference, the all time record high was 11.2 months of supply in 2008.
This level of supply will put additional downward pressure on house prices. Click on graph for larger image in new window.
This graph show months of supply and the annualized change in the Case-Shiller Composite 20 house price index.
Below 6 months of supply (blue line) house prices are typically rising (black line).
Above 6 or 7 months of supply house prices are usually falling (although there were many programs to support house prices over the last year).
The dashed red line is the estimate for months of supply in June and July.
This is a key reason why I expect house prices to fall further later this year as measured by the Case-Shiller and CoreLogic repeat sales house price indexes.
WSJ: Housing Market Stumbles
by Calculated Risk on 7/21/2010 08:55:00 AM
Nick Timiraos and Robbie Whelan write at the WSJ Housing Market Stumbles. A few excerpts:
The Wall Street Journal's quarterly survey of housing-market conditions in 28 major metropolitan areas shows that inventory levels have grown in many markets.A few comments:
... newly signed contracts in May and June have plunged. ...
More broadly, the housing market faces two big problems: too many homes and falling demand.
MBA: Mortgage Purchase Applications increase slightly last week
by Calculated Risk on 7/21/2010 07:43:00 AM
The MBA reports: Interest Rate Drops Spur Refinance Applications in Latest MBA Weekly Survey
The Refinance Index increased 8.6 percent from the previous week and was the highest Refinance Index observed in the survey since the week ending May 15, 2009.
...
The seasonally adjusted Purchase Index increased 3.4 percent from one week earlier, driven by an 8.0 percent increase in government purchase applications.
...
"As rates on 30- and 15-year fixed-rate mortgages declined to the lowest levels recorded in the survey, refinance activity increased last week. The refinance index is up almost 30 percent over the past 4 weeks, but is still well below the peak seen last spring,” said Michael Fratantoni, MBA’s Vice President of Research and Economics.
...
The average contract interest rate for 30-year fixed-rate mortgages decreased to 4.59 percent from 4.69 percent, with points increasing to 1.04 from 0.96 (including the origination fee) for 80 percent loan-to-value (LTV) ratio loans. This was the lowest 30-year contract rate ever recorded in the survey.
 Click on graph for larger image in new window.
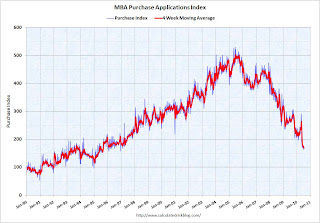
This graph shows the MBA Purchase Index and four week moving average since 1990.
Although the weekly applications index increased slightly, the four-week moving average is at a 15 year low (lowest since August 1995). The four week average is off 36% since the mini-peak in April (the weekly index is off 42% since the end of April).
This collapse in the mortgage application index has already shown up as a decline in new home sales, and will show up in the July and August existing home sales reports (counted at close of escrow).
Tuesday, July 20, 2010
Quick Update: Bernanke rescheduled to 2 PM ET
by Calculated Risk on 7/20/2010 10:08:00 PM
The Semiannual Monetary Policy Report to the Congress 02:00 PM - 05:00 PM ET
Bernanke Testimony Preview
by Calculated Risk on 7/20/2010 07:45:00 PM
Tomrrow, starting at 10 AM ET, Fed Chairman Ben Bernanke will report to the Senate Banking Committee: The Semiannual Monetary Policy Report to the Congress
David Wessel at the WSJ has a preview: The View From Bernanke's Perch at the Fed
Neil Irwin at the WaPo has some comments: Why Wall Street doesn't understand the Fed
Bernanke will very likely tell the Senate Banking Committee on Wednesday that cutting [interest on excess reserves] is one of a handful of options that the Fed is evaluating should the economic recovery continue to stumble. The others ... are strengthening its promise to keep interest rates low for an extended period and buying enough mortgage securities to replace those that mature. He will indicate openness to buying more long-term assets, but only if the economy appears to be heading back toward recession.I doubt Bernanke will mention options for further easing in his prepared statement, however he will probably be asked about what options are available in the Q&A. As Andrew Tilton at Goldman Sachs noted yesterday: "Any commentary on easing options seems more likely to come in the question-and-answer session rather than prepared remarks. One way for Chairman Bernanke to keep specific ideas at arm’s length might be to couch them in terms of a discussion of what other central banks have done."
I think Bernanke will mention the recent weak economic data in his prepared testimony, and it will interesting to see how he phrases it. As far as policy options, I think the options Irwin mentions are possible - and also possible is setting target ceiling rates for 3 to 5 year Treasury securities (he discussed this in his 2002 speech: Deflation: Making Sure "It" Doesn't Happen Here).
Obama Housing Scorecard
by Calculated Risk on 7/20/2010 04:31:00 PM
The Obama Administration released the June Housing Scorecard today. The graphs are a little hard to read, but they do provide a list of sources.
On modifications they provide a graph showing 2.95 million total modifications for Hope Now, HAMP, and FHA loss mitigation (page 3). There are also private modifications too (not mentioned) - so quite a few borrowers have had some sort of loan modification.
For housing supply (page 2 last graph), they show existing home inventory and "vacant housing units, held off market, year round, other" from the Census Bureau. I suppose they are using this number (about 3.6 million now - usually around 2.7 million) as a measure of shadow inventory. I think a better measure of the excess supply is to use the vacancy rates from the Census Bureau. The Q2 vacancy rates will be released next week on July 27th.
HAMP data: Only 15,000 trial modifications started in June
by Calculated Risk on 7/20/2010 01:07:00 PM
From Treasury: HAMP Servicer Performance Report Through June 2010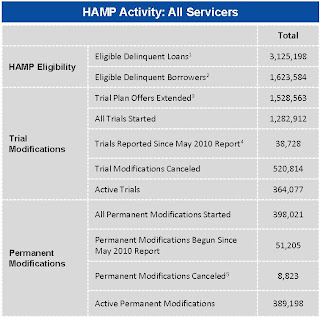 Click on table for larger image in new window.
About 389 thousand modifications are now "permanent" - up from 347 thousand last month - and 521 thousand trial modifications have been cancelled - up sharply from 430 thousand last month.
According to HAMP, there are 364,077 "active trials", down from 467,672 last month. There is still a large number of borrowers in limbo since only 235 thousand trials were started over the last 5 months. I expect another large number of cancellations in July. The second graph shows the cumulative HAMP trial programs started.
Notice that the pace of new trial modifications has slowed sharply from over 150,000 in September to just over 15,000 in June (down from 30,000 in April 2010). This is the slowest pace since the program started, probably because of two factors: 1) servicers are now pre-qualifying borrowers, and 2) servicers are running out of eligible borrowers. The program is winding down ...
Debt-to-income ratios
If we look at the HAMP program stats (see page 3), the median front end DTI (debt to income) before modification was 44.8% - the same as last month. And the back end DTI was an astounding 79.9 (up slightly from last month).
Think about that for a second: for the median borrower, about 80% of the borrower's income went to servicing debt. And the median is 63.7% after the modification.
And that is the median - and just imagine the characteristics of the borrowers who can't be converted!
Summary:
Note: On page 3, HAMP added the delinquency rates for "permanent" modifications. As an example, 5.9% of borrowers are 60+ days delinquent six months after their modifications became "permanent". Over 8,800 "permanent" modifications have been cancelled, and only 195 have been paid off (probably sold property). The others probably are in foreclosure (or other distress sale).
State Unemployment Rates: Generally lower in June
by Calculated Risk on 7/20/2010 10:03:00 AM
 Click on graph for larger image in new window.
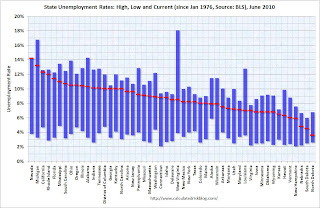
This graph shows the high and low unemployment rates for each state (and D.C.) since 1976. The red bar is the current unemployment rate (sorted by the current unemployment rate).
Sixteen states and D.C. now have double digit unemployment rates. Arizona and New Jersey are close.
Nevada set a new series high at 14.2% and now has the highest state unemployment rate. Michigan held the top spot for over 4 years until May.
From the BLS: Regional and State Employment and Unemployment Summary
Regional and state unemployment rates were generally lower in June. Thirty-nine states and the District of Columbia recorded unemployment rate decreases, five states had increases and six states had no change, the U.S. Bureau of Labor Statistics reported today.
...
Nevada again reported the highest unemployment rate among the states, 14.2 percent in June. The rate in Nevada also set a new series high. (All region, division, and state series begin in 1976.) The states with the next highest rates were Michigan, 13.2 percent; California, 12.3 percent; and Rhode Island, 12.0 percent.
emphasis added
Housing Starts decline in June
by Calculated Risk on 7/20/2010 08:30:00 AM
 Click on graph for larger image in new window.
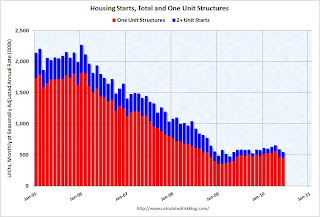
Total housing starts were at 549 thousand (SAAR) in June, down 5% from the revised May rate of 578,000 (revised down from 593 thousand), and up 15% from the all time record low in April 2009 of 477 thousand (the lowest level since the Census Bureau began tracking housing starts in 1959).
Single-family starts declined 0.7% to 454,000 in June. This is 26% above the record low in January 2009 (360 thousand). 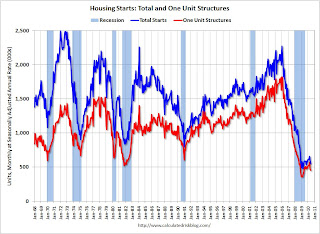 The second graph shows total and single unit starts since 1968. This shows the huge collapse following the housing bubble, and that housing starts have mostly been moving sideways for over a year.
Here is the Census Bureau report on housing Permits, Starts and Completions.
Housing Starts:This is way below expectations of 580 thousand (I took the under!), and is good news for the housing market longer term (there are too many housing units already), but bad news for the economy and employment short term.
Privately-owned housing starts in June were at a seasonally adjusted annual rate of 549,000. This is 5.0 percent (±13.2%)* below the 13.2%) revised May estimate of 578,000 and is 5.8 percent (±10.5%)* below the June 2009 rate of 583,000.
Single-family housing starts in June were at a rate of 454,000; this is 0.7 percent (±10.7%)* below the revised May figure of 457,000.
Building Permits:
Privately-owned housing units authorized by building permits in June were at a seasonally adjusted annual rate of 586,000. This is 2.1 percent (±2.1%)* above the revised May rate of 574,000, but is 2.3 percent (±2.0%) below the June 2009 estimate of 600,000.
Single-family authorizations in June were at a rate of 421,000; this is 3.4 percent (±1.8%) below the revised May figure of 436,000.


