 RSS Feed
 by Calculated Risk on 7/16/2010 05:09:00 PM
Friday, July 16, 2010
Bank Failure #91: Woodlands Bank, Bluffton, South Carolina
Woodlands Bank squanders their trust
Grasshoppers rescued
by Soylent Green is People
From the FDIC: Bank of the Ozarks, Little Rock, Arkansas, Assumes All of the Deposits of Woodlands Bank, Bluffton, South Carolina
As of March 31, 2010, Woodlands Bank had approximately $376.2 million in total assets and $355.3 million in total depositsFriday arrives ...
...
The FDIC estimates that the cost to the Deposit Insurance Fund (DIF) will be $115.0 million. ... Woodlands Bank is the 91st FDIC-insured institution to fail in the nation this year, and the second in South Carolina. The last FDIC-insured institution closed in the state was Beach First National Bank, Myrtle Beach, on April 9, 2010.
Mortgage Repurchase: The growing writedown
by Calculated Risk on 7/16/2010 02:01:00 PM
Another graph from the BofA Second Quarter 2010 Earnings Presentation (ht Brian)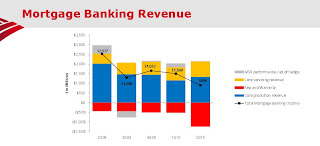 Click on graph for larger image in new window.
This graph shows the components of BofA mortgage banking revenue. The increasing red contribution is from "Rep and warranty" - these are the loans being pushed back on BofA. The second graph/chart is from First Horizon National's second quarter presentation (page 8).
Notice the pipeline of repurchase requests continues to grow, the high rescission rate of 40-50%, and the loss severity of 50-55% (the loss to First Horizon on mortgages they have to repurchase).
Note: the FHFA issued subpoenas last week "seeking documents related to private-label mortgage-backed securities" in which Fannie Mae and Freddie Mac invested. That could lead to more repurchase requests for the Wall Street banks.
BofA 30+ Day Delinquency and FHA
by Calculated Risk on 7/16/2010 11:32:00 AM
The following graph from the BofA Second Quarter 2010 Earnings Presentation says more about the FHA than BofA (ht Brian): Click on graph for larger image in new window.
For BofA, the 30+ day deliquency trends continue to improve.
That red line at the top that is still increasing? That includes FHA insured residential mortgages ...
Notice how the risk has been shifted to the FHA.
Reuters University of Michigan's Consumer Sentiment drops sharply in July
by Calculated Risk on 7/16/2010 10:01:00 AM
From Reuters: Consumer Sentiment Sinks To Lowest in 11 Months
The survey's preliminary July reading on the overall index on consumer sentiment plummeted to 66.5 from 76.0 in June.
The figure was below the median forecast of 74.5 among economists polled by Reuters.
 Click on graph for larger image in new window.
Consumer sentiment is a coincident indicator - and this is further evidence of an economic slowdown.
Interesting - the survey's one-year inflation expectations increased to 2.9% even as measured inflation has been falling.
Consumer Price Index declines 0.1% in June
by Calculated Risk on 7/16/2010 08:30:00 AM
From the BLS report on the Consumer Price Index this morning:
The Consumer Price Index for All Urban Consumers (CPI-U) declined 0.1 percent in June on a seasonally adjusted basis, the U.S. Bureau of Labor Statistics reported today. Over the last 12 months, the index increased 1.1 percent before seasonal adjustment.Even with the slight monthly increase, Owners' equivalent rent (OER) is down year-over-year.
...
The index for all items less food and energy rose 0.2 percent in June after increasing 0.1 percent in May. ... The 12-month change in the index for all items less food and energy remained at 0.9 percent for the third month in a row.
...
The index for owners' equivalent rent also rose 0.1 percent, its first increase since August 2009 ...
The general disinflationary trend continues - CPI is unchanged over the last 8 months - and with all the slack in the system (especially the 9.5% unemployment rate), CPI will probably stay low or even fall further.
Thursday, July 15, 2010
HUD announcement: FHA Seller concession to be cut in half
by Calculated Risk on 7/15/2010 07:45:00 PM
From HUD: HUD seeks Public Comment on Three Initiatives to Boost FHA Capital Reserves
For the next 30 days, HUD is seeking public comment on the following policy changes, each of which are designed to mitigate risk to the Mutual Mortgage Insurance Fund while promoting sustainable homeownership for FHA borrowers:This will become effective after the 30 day comment period - so around August 15th.1. Update the combination of credit and down payment requirements for new borrowers. New borrowers seeking FHA-insured financing will be required to have a minimum FICO score of 580 to qualify for FHA’s flagship 3.5 percent down payment program. New borrowers with credit scores of less than a 580 will be required to make a cash investment of at least 10 percent. Borrowers with credit scores of less than 500 will no longer qualify for an FHA-insured mortgage.
2. Reduce allowable seller concessions from six to three percent. Allowing sellers to contribute up to six percent of the home’s sales price to offset a buyer’s costs exposes the FHA to excess risk by potentially driving up the cost of the home beyond its appraised value. Reducing seller concessions to three percent will bring FHA into conformity with industry standards.
3. Tighten underwriting standards for manually underwritten loans. When using compensating factors in the underwriting process, lenders will be required to consider those factors which are the best predictive indicators of loan performance, such as the borrower’s credit history, loan-to-value (LTV) percentage, debt-to income ratio, and cash reserves.
Update: For more details, here is the public notice.
Reports: BP makes progress on Oil Gusher, SEC to make "significant announcement"
by Calculated Risk on 7/15/2010 03:58:00 PM
From the WSJ: Oil Stops Flowing as BP Tests Cap
From the SEC:
The SEC Enforcement Division is holding a news conference at 4:45 p.m. ET to make a significant announcement.There will be a webcast here. Rumors are about Goldman Sachs - but we will know in 45 minutes.
UPDATE: Goldman Sachs settles with SEC, agrees to pay $550 million.
News release
The Securities and Exchange Commission today announced that Goldman, Sachs & Co. will pay $550 million and reform its business practices to settle SEC charges that Goldman misled investors in a subprime mortgage product just as the U.S. housing market was starting to collapse.Goldman Consent
In agreeing to the SEC's largest-ever penalty paid by a Wall Street firm, Goldman also acknowledged that its marketing materials for the subprime product contained incomplete information.
Proposed judgment
Hotel Occupancy Rate increases compared to same week in 2009
by Calculated Risk on 7/15/2010 12:36:00 PM
Hotel occupancy is one of several industry specific indicators I follow ...
First, some comments from the Marriott conference call today:
After dropping for eight straight quarters occupancy rates bottomed in the Fourth Quarter of 2009. .. [W]e said we hope to increase room rates year-over-year, some time in 2010. As it turned out we were able to increase room rates much faster than we anticipated. In period five roughly equivalent to May, domestic Company operated room rates rose 1%. The first increase in nearly two years. In period six, roughly equivalent to June, domestic Company operated room rates rose 3%.And from HotelNewsNow.com: STR: US results for week ending 3 July 2010
...
Leisure demand in the Second Quarter ... was solid. On weekdays Marriott brand REVPAR rose an impressive 9% in the quarter but weekends held their own with REVPAR up 5%.
...
Business in Europe and the UK remains strong despite rumbling of economic concern. Our European hotels are benefiting from strong American tourism, attracted to fabulous destinations that are on sale due to the weaker currencies. In Asia, occupancy rates at Company operated hotels rose over 16 points as newer hotels continued to mature and the Shanghai world expo attracted strong demand.
Overall, in year-over-year measurements, the industry’s occupancy increased 3.9 percent to 62.5 percent, ADR rose 0.4 percent to US$94.69, and RevPAR was up 4.3 percent to US$59.17.The following graph shows the four week moving average for the occupancy rate by week for 2008, 2009 and 2010 (and a median for 2000 through 2007).
 Click on graph for larger image in new window.
Notes: the scale doesn't start at zero to better show the change.
On a 4-week basis, occupancy is up 6.5% compared to last year (the worst year since the Great Depression) and 5.3% below the median for 2000 through 2007.
A little more than half way back ...
Data Source: Smith Travel Research, Courtesy of HotelNewsNow.com
Philly Fed Index suggests "slowing" growth
by Calculated Risk on 7/15/2010 10:15:00 AM
Here is the Philadelphia Fed Index released today: Business Outlook Survey.
The survey’s broadest measure of manufacturing conditions, the diffusion index of current activity, decreased from a reading of 8 in June to 5.1 in July. The index, although still positive and suggesting growth, has fallen for two consecutive months. Indexes for new orders and shipments also suggest a slowing this month: The new orders index fell 13 points, to its first negative reading in 12 months, and the shipments index decreased 10 points but remained positive. Indicating weakness, indexes for both delivery times and unfilled orders fell and were in negative territory this month.
Firms indicated a slight increase in employment this month.
...
On balance, firms reported declines in prices for their own manufactured goods.
emphasis added
 Click on graph for larger image in new window.
This graph shows the Philly index for the last 40 years.
The index has been positive for eleven months now, but turned down sharply in June and July.
These surveys are timely, but noisy. However this is further evidence that the manufacturing sector is slowing.
Industrial Production, Capacity Utilization mostly flat in June
by Calculated Risk on 7/15/2010 09:30:00 AM
From the Fed: Industrial production and Capacity Utilization
Industrial production edged up 0.1 percent in June after having risen 1.3 percent in May. ... For the second quarter as a whole, total industrial production increased at an annual rate of 6.6 percent. Manufacturing output moved down 0.4 percent in June after three months of gains at or near 1 percent. The output of mines rose 0.4 percent. The output of utilities increased 2.7 percent, as temperatures moved further above seasonal norms. At 92.5 percent of its 2007 average, total industrial production in June was 8.2 percent above its year-earlier level. The capacity utilization rate for total industry remained unchanged in June at 74.1 percent, a rate 5.9 percentage points above the rate from a year earlier but 6.5 percentage points below its average from 1972 to 2009.
 Click on graph for larger image in new window.
This graph shows Capacity Utilization. This series is up 8.7% from the record low set in June 2009 (the series starts in 1967).
Capacity utilization at 74.1% is still far below normal - and well below the the pre-recession levels of 81.2% in November 2007.
Note: y-axis doesn't start at zero to better show the change.
 The second graph shows industrial production since 1967.
This is the highest level for industrial production since Nov 2008, but production is still 7.9% below the pre-recession levels at the end of 2007.
Still a long way to go.


