 RSS Feed
 by Calculated Risk on 7/13/2010 03:20:00 PM
Tuesday, July 13, 2010
Rail Traffic softens further in June
From the Association of American Railroads: Rail Time Indicators. The AAR reports traffic in June 2010 was up 10.6% compared to June 2009 - but traffic was still 10.2% lower than in June 2008. Click on graph for larger image in new window.
This graph shows U.S. average weekly rail carloads. Traffic increased in 16 of 19 major commodity categories year-over-year.
From AAR:
• U.S. freight railroads originated 1,415,630 carloads in June 2010, an average of 283,126 carloads per week — up 10.6% from June 2009 (see chart) but down 10.2% from June 2008 on a non-seasonally adjusted basis.As the graph above shows, rail traffic collapsed in November 2008, and now, a year into the recovery, traffic has only recovered about half way. This is more evidence of a sluggish recovery ... also the declines in May and June are concerning although the declines were small.
• On a seasonally adjusted basis, U.S. rail carloads fell 1.3% in June 2010 from May 2010, following a 1.1% decline in May 2010 from April 2010. After bottoming out in May 2009, seasonally adjusted rail carloads trended upward, with some fits and starts along the way, through April 2010. They’ve now declined for two consecutive months.
• The declines in rail carloads over the past couple months have not been huge, and they certainly don’t prove that the wheels are coming off the economy’s bus.
• That said, an economy several months into a recovery from the worst recession in decades should be yielding rail traffic levels heading north, not south. (Remember, demand for rail service occurs as a result of demand elsewhere in the economy for the products that railroads haul.) Thus, rail traffic in June 2010 is consistent with an economy that is in far better shape than it was nine months or a year ago, but is, in the words of former Federal Reserve Chairman Alan Greenspan, “more than likely” undergoing a “pause.
excerpts with permission
CoreLogic: House Prices increase 0.9% in May
by Calculated Risk on 7/13/2010 01:10:00 PM
From CoreLogic (formerly First American LoanPerformance): CoreLogic® Home Price Index Shows Continued Increases in Home Prices for both Year-Over-Year and Month-Over-Month Figures In May
National home prices in the U.S. increased in May, the fourth-consecutive month showing a year-over-year increase. According to the CoreLogic HPI, national home prices, including distressed sales, increased by 2.9 percent in May 2010 compared to May 2009 and increased by 3.5 percent in April 2010 compared to April 2009. Excluding distressed sales, year-over-year prices only increased by 0.9 percent in May, and April’s non-distressed HPI increased by 0.4 percent.
On a month-over-month basis, May’s HPI was 0.9 percent higher than the April 2010 HPI, but the rate of increase was lower than the 1.3 percent gain from March 2010 to April 2010.
...
“Home price appreciation stabilized as homebuyer tax credit driven sales peaked in late spring,” said Mark Fleming, chief economist for CoreLogic. “But given that the labor market and income growth remain tepid we expect prices to moderate and possibly decline the rest of the year.”
 Click on graph for larger image in new window.
 This graph shows the national LoanPerformance data since 1976. January 2000 = 100.
The index is up 2.9% over the last year, and off 28.5% from the peak.
CoreLogic expects prices to "moderate and possibly decline". I expect that we will see lower prices on this index later this year.
 The second graph is an update on the price-to-rent ratio similar to the approach used by Fed economist John Krainer and researcher Chishen Wei in 2004: House Prices and Fundamental Value. Kainer and Wei presented a price-to-rent ratio using the OFHEO house price index and the Owners' Equivalent Rent (OER) from the BLS.
This graph shows the price to rent ratio using the CoreLogic data (January 2000 = 1.0).
This suggests that house prices are much closer to the bottom than the top, but that prices still have a ways to fall on a national basis.
I think this index will show a further price increase in June, as tax credit related existing home sales close. But I expect the index will show declines by the end of summer and into the fall.
BLS: Low Labor Turnover in May
by Calculated Risk on 7/13/2010 10:41:00 AM
From the BLS: Job Openings and Labor Turnover Summary
There were 3.2 million job openings on the last business day of May 2010, the U.S. Bureau of Labor Statistics reported today. The job openings rate was little changed over the month at 2.4 percent. TheNote: The difference between JOLTS hires and separations is similar to the CES (payroll survey) net jobs headline numbers. The CES (Current Employment Statistics, payroll survey) is for positions, the CPS (Current Population Survey, commonly called the household survey) is for people.
hires rate (3.4 percent) was little changed and the separations rate (3.1 percent) was unchanged.
...
[T]he number of job openings has risen by 868,000 (37 percent) since the most recent trough of 2.3 million in July 2009. Even with the gains since July 2009, the number of job openings in May 2010 remained below those in place at the start of the recession in every industry except government, and in each region except the Northeast.
The following graph shows job openings (purple), hires (blue), Total separations (include layoffs, discharges and quits) (red) and Layoff, Discharges and other (yellow) from the JOLTS.
Unfortunately this is a new series and only started in December 2000.
 Click on graph for larger image in new window.
Notice that hires (blue) and separations (red) are pretty close each month. In May, about 4.1 million people lost (or left) their jobs, and 4.5 million were hired (this is the labor turnover in the economy).
When the hires (blue line) is above total separations (as in May), the economy is adding net jobs, when the blue line is below total separations, the economy is losing net jobs.
The hires in May included the 411 thousand temporary Census 2010 hires. Without those hires, the JOLTS report shows only 8 thousand hires in May.
Layoffs and discharges have declined sharply since early 2009 - and are near a series low - and that is a good sign. And the number of job openings has moved up recently (although down slightly in May). But the overall turnover, especially after removing the impact of the Census hiring, is still low.
Trade Deficit increases in May
by Calculated Risk on 7/13/2010 08:56:00 AM
The Census Bureau reports:
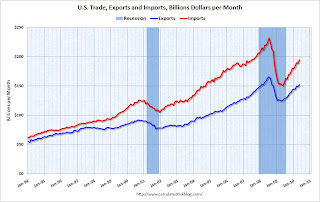
[T]otal May exports of $152.3 billion and imports of $194.5 billion resulted in a goods and services deficit of $42.3 billion, up from $40.3 billion in April, revised. May exports were $3.5 billion more than April exports of $148.7 billion. [May] imports were $5.5 billion more than April imports of $189.0 billion.
 Click on graph for larger image.
The first graph shows the monthly U.S. exports and imports in dollars through May 2010.
Clearly imports are increasing much faster than exports. On a year-over-year basis, exports are up 21% and imports are up 29%. This is an easy comparison because of the collapse in trade at the end of 2008 and into early 2009.
The second graph shows the U.S. trade deficit, with and without petroleum, through May.
 The blue line is the total deficit, and the black line is the petroleum deficit, and the red line is the trade deficit ex-petroleum products.
Import oil prices decreased slightly to $76.93 in May - and are up 96% from the low of February 2009 (at $39.22). Oil import volumes were down in May.
With oil prices and volumes down, oil imports decreased sharply in May, however other imports - especially from China - increased significantly. Most of the increase in the trade deficit since last year has been related to oil, but now it appears the ex-oil deficit is increasing sharply again.
Ceridian-UCLA: Diesel Fuel index Falls Sharply in June
by Calculated Risk on 7/13/2010 08:20:00 AM
This is the new UCLA Anderson Forecast and Ceridian Corporation index using real-time diesel fuel consumption data: Pulse of Commerce IndexTM
Press Release: Amid Fears of Double-Dip Recession, PCI Falls Sharply in June
The Ceridian-UCLA Pulse of Commerce Index™ (PCI) by UCLA Anderson School of Management tumbled 1.9 percent in June after its impressive 3.1 percent gain in May.
...
“While June’s number is substantially down, erasing two-thirds of May’s great gain, the daily and weekly activity on which the monthly PCI is based does not suggest that the economy is heading over a cliff,” said [PCI Chief Economist Edward Leamer]. “Part of the apparent strength of May and weakness in June is the result of the Memorial Day holiday occurring on the last day of May, allowing the negative Memorial Day effect which is usually confined to May to leak into June. More importantly, the June weakness was confined to the first two weeks, and by the second half of June, we were seeing strong growth again.”
...
The PCI is based on an analysis of real-time diesel fuel consumption data ...
 Click on graph for larger image in new window.
This graph shows the index since January 1999.
The decline in June is just one month (partially offsetting the large increase in May), and the three month average is still increasing.
Note: This index appears to lead Industrial Production (IP), but there is a significant amount of monthly noise. This is a new index and is something to follow along with other transportation data.
Small Businesses a little more pessimistic
by Calculated Risk on 7/13/2010 07:47:00 AM
From the NFIB:
The National Federation of Independent Business Index of Small Business Optimism lost 3.2 points in June falling to 89.0 after posting modest gains for several months. The Index has been below 93 every month since January 2008 (30 months), and below 90 for 23 of those months, all readings typical of a weak or recession-mired economy.The key problems are a shortage of customers and also falling prices (via WSJ): “widespread price cutting continued to contribute to reports of lower nominal sales.”
...
Over the next three months, 8 percent plan to reduce employment (up one point), and 10 percent plan to create new jobs (down four points), yielding a seasonally adjusted net 1 percent of owners planning to create new jobs, unchanged from the May reading and positive for the second time in 20 months.
...
“Hiring and capital spending depend on expectations for growth in future sales, so the outlook for improved spending and hiring is not good,” said [William Dunkelberg, NFIB’s chief economist].
Small business owners continued to liquidate inventories and weak sales trends gave little reason to order new stock.
Updates: something to remember: "Small businesses" includes a large percentage of real estate related companies - so weak housing skews the results. The press release will be here, and the report here.
Monday, July 12, 2010
Condo Shadow Inventory
by Calculated Risk on 7/12/2010 11:30:00 PM
Another update on condos as shadow inventory ...
From Kelly Bennett at the Voice of San Diego: Vantage Pointe's Trouble Persists, but Downtown Thinks It's Found Bottom
Weighing in at 679 units, downtown's biggest condo building, Vantage Pointe, has met with outsize trouble since 2004 when buyers first got in fistfights for the privilege of securing a unit.This is another reminder that unless these condos are listed, they do not show up as either existing or new home inventory (the new home report doesn't include high rise condos).
The building's trouble continues. The developers haven't sold a single unit in the 14 months since returning deposits to the previous contracted buyers. About 40 buyers have signed contracts to buy there but can't close the deals. More than 150 other units are being rented.
But that's not enough to satisfy the project's lenders behind its $210 million loan, the largest construction loan on a single residential building in San Diego history. Those lenders filed a notice of default in April, pushing the developers to the first stage of foreclosure.
And 150 of these units have been rented and will probably be sold someday too. I spoke to a landlord in the downtown San Diego area yesterday, and she has had to cut rents significantly to compete with all the condo units being rented.
There are some areas - like Las Vegas and Miami - that have a huge number of vacant high rise condos. But there are also many smaller buildings that are mostly vacant in a number of cities (like in New York, Chicago, Raliegh, N.C. and Irvine, Ca). This is all part of the shadow inventory ...
Stress Tests: EU Concerned about "pockets of vulnerability”
by Calculated Risk on 7/12/2010 06:32:00 PM
From James Kanter at the NY Times: European Ministers Weigh Details of Stress Test
European Union finance ministers met Monday to start two days of discussions partly aimed at deciding how much information to reveal after they complete [stress] tests ...The results will be released on July 23rd.
“The European banking sector is, over all, resilient,” Olli Rehn, the European commissioner for economic and monetary affairs, said at a news conference. “At the same time when we publish the stress tests we will have to prepare for any pockets of vulnerability.”
And posted this morning from "some investor guy", part 3 in the series on sovereign default:
Earlier posts:
More coming later this week.
Distressed Sales: Sacramento as an Example, June 2010
by Calculated Risk on 7/12/2010 04:08:00 PM
The Sacramento Association of REALTORS® has been breaking out short sales for over a year now. They report monthly resales by equity sales (conventional resales), and distressed sales (Short sales and REO sales), and I'm following this series as an example to see mix changes in a distressed area.  Click on graph for larger image in new window.
Here is the June data.
Total June sales were up from May, and up from June 2009. Of course June was the scheduled closing deadline to qualify for the Federal homebuyer tax credit (closing date since extended), and also the California tax credit played a role. Sales should collapse in July.
The year-over-year (YoY) increase in June sales break a 12 month streak of declining YoY sales. But that was because of the tax credit, and sales will be off YoY in July.
Short sales were up 66% YoY (Year of the Short Sale!), and REO sales were down by 30%.
Note: This data is not seasonally adjusted. The second graph shows the percent of REO, short sales and conventional sales. The percent of short sales is now at a high for this brief series.
In June, 62.4% of all resales (single family homes and condos) were distressed sales.
The percent of REOs has been generally declining (seasonally there are a larger percentage of REOs in the winter). Also there appears to be a higher percentage of conventional sales associated with the tax credit.
On financing, 54.6% percent were either all cash (21.3%) or FHA loans (33.3%), suggesting most of the activity in distressed former bubble areas like Sacramento is first time home buyers using government-insured FHA loans, and investors paying cash.
With the tax credit (mostly) over, I expect total sales to decline and the percent of distressed sales (Short and REO) to increase.
FHFA attempting to recoup some losses of Fannie and Freddie
by Calculated Risk on 7/12/2010 02:15:00 PM
From the Federal Housing Finance Agency: FHFA Issues Subpoenas for PLS Documents
FHFA, as Conservator of Fannie Mae and Freddie Mac (the Enterprises), has issued 64 subpoenas to various entities, seeking documents related to private-label mortgage-backed securities (PLS) in which the two Enterprises invested. The documents will enable the FHFA to determine whether PLS issuers and others are liable to the Enterprises for certain losses they have suffered on PLS. If so, the Conservator expects to recoup funds, which would be used to offset payments made to the Enterprises by the U.S. Treasury.Many of the originators of the PLS mortgages are no longer in business (New Century, etc.), however most of the PLS issuers still exist.
...
Before and during conservatorship, the Enterprises sought to assess and enforce their rights as investors in PLS, in an effort to recoup losses suffered in connection with their portfolios. Specifically, the Enterprises have attempted to determine whether misrepresentations, breaches of warranties or other acts or omissions by PLS counterparties would require repurchase of loans underlying the PLS by the counterparties and whether other remedies might be appropriate. However, difficulty in obtaining the loan documents has presented a challenge to the Enterprises’ efforts. FHFA has therefore issued these subpoenas for various loan files and transaction documents pertaining to loans securing the PLS to trustees and servicers controlling or holding that documentation.


