 RSS Feed
 by Calculated Risk on 7/08/2010 04:02:00 PM
Thursday, July 08, 2010
What might the Fed do?
Neil Irwin at the WaPo discusses some possible future actions at the Fed: Federal Reserve weighs steps to offset slowdown in economic recovery
Federal Reserve officials, increasingly concerned over signs the economic recovery is faltering, are considering new steps to bolster growth.Irwin mentions a few possibilities, such as the Fed expanding the "extended period" language in the FOMC statement to describe an even longer period, or buying more agency MBS (mortgage backed securities).
Professor Krugman weighs in with some analysis: How Much Can The Fed Help?
I think it might be useful to revisit Bernanke's 2002 speech for hints of the roadmap: Deflation: Making Sure "It" Doesn't Happen Here This entire speech is worth rereading. Bernanke suggests several policies (many have been used), but this might be a clue to the next possible action:
One relatively straightforward extension of current procedures would be to try to stimulate spending by lowering rates further out along the Treasury term structure--that is, rates on government bonds of longer maturities. There are at least two ways of bringing down longer-term rates, which are complementary and could be employed separately or in combination. One approach, similar to an action taken in the past couple of years by the Bank of Japan, would be for the Fed to commit to holding the overnight rate at zero for some specified period. Because long-term interest rates represent averages of current and expected future short-term rates, plus a term premium, a commitment to keep short-term rates at zero for some time--if it were credible--would induce a decline in longer-term rates. A more direct method, which I personally prefer, would be for the Fed to begin announcing explicit ceilings for yields on longer-maturity Treasury debt (say, bonds maturing within the next two years). The Fed could enforce these interest-rate ceilings by committing to make unlimited purchases of securities up to two years from maturity at prices consistent with the targeted yields.In the 2002 speech, Bernanke mentioned the possibility of a "specified period" for holding short rates low, as opposed to the "extended period" language (Irwin suggested this in the WaPo article).
... if operating in relatively short-dated Treasury debt proved insufficient, the Fed could also attempt to cap yields of Treasury securities at still longer maturities, say three to six years.
However Bernanke clearly prefers targeting longer term maturities. So if the Fed decides to take action, the FOMC might announce "explicit ceilings for yields on longer-maturity Treasury debt" - just like they do with the Fed funds rate at each FOMC meeting. Although the Fed purchased longer term Treasury securities during the crisis, the FOMC didn't announce an explicit interest-rate ceiling.
Below is a table of recent yields. There isn't much the Fed can do at 6 months or 1 year, but the Fed could announce lower targets for the 3 year and the 5 year and flatten the yield curve.
| Treasury constant maturities | |
|---|---|
| 1-month | 0.07% |
| 3-month | 0.17% |
| 6-month | 0.22% |
| 1-year | 0.30% |
| 2-year | 0.62% |
| 3-year | 1.03% |
| 5-year | 1.83% |
| 7-year | 2.49% |
| 10-year | 3.05% |
| 20-year | 3.82% |
| 30-year | 4.01% |
30 Year Mortgage Rates fall to Record Low
by Calculated Risk on 7/08/2010 02:16:00 PM
From Freddie Mac: 30-Year Fixed Rate Mortgage Drops Slightly to Create Another New Low
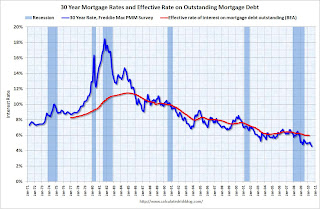
Freddie Mac today released the results of its Primary Mortgage Market Survey® (PMMS®) in which the 30-year fixed-rate mortgage (FRM) averaged 4.57 percent with an average 0.7 point for the week ending July 8, 2010, down from last week when it averaged 4.58 percent. Last year at this time, the 30-year FRM averaged 5.20 percent. This rate is yet another all-time low in Freddie Mac’s 39-year survey.
...
“With mortgage rates falling to historic lows, refinance activity has been strong over the past three months,” said Frank Nothaft, Freddie Mac vice president and chief economist. “The Bureau of Economic Analysis. reported that the effective mortgage rate of all loans outstanding was just below six percent in the first quarter of 2010, the lowest since the series began in 1977. Since the start of the second quarter, two out of three mortgage applications on average were for refinancing, according the Mortgage Bankers Association."
 Click on graph for larger image in new window.
This graph shows the 30 year fixed rate mortgage interest rate from the Freddie Mac Primary Mortgage Market Survey®.
The red line is a quarterly estimate from the BEA of the effective rate of interest on all outstanding mortgages (Owner- and Tenant-occupied residential housing).
The effective rate on outstanding mortgages is at a series low of just under 6%, but the rate is moving down slowly since so many borrowers can't refinance because they do not qualify (either because the property value is too low or their incomes are insufficient).
How Large is the Outstanding Value of Sovereign Bonds?
by Calculated Risk on 7/08/2010 11:02:00 AM
CR Note: Reader "some investor guy" has put together some data on sovereign default risk. This is the first in a series of posts.
Debt issued by governments worldwide is immense. According to the Bank for International Settlements, at year end 2009 worldwide sovereign debt exceeded $34 trillion, and is greater than the amount of corporate bonds outstanding.
Japan and the US dwarf most other borrowers. Together they have about half of all sovereign debt worldwide. Still, 23 other countries have over $100 billion of debt outstanding. The other 100+ countries worldwide have a total debt of about $1.4 trillion.
 Click on graph for larger image in new window.
Note: This graph shows the sovereign debt in December 2007 and December 2009.
Due to the recession and increased expenditures to rescue banking systems, total sovereign debts grew by almost 30% in just two years. Sovereigns became the majority of worldwide debt. Several countries doubled their debts from 2007 to 2009 (BIS data).
Source: Bank for International Settlements (BIS)
*For the US, figures include public holdings of Treasuries, but not Fannie Mae or Freddie Mac (about $8.1 trillion year end 2009, per BIS), or the “intragovernmental holdings” of Social Security, Medicare, the Civil Service Retirement Fund, etc. (about $4.5 trillion year end 2009, per US Bureau of Public Debt).
 When shown as a percent of GDP, the picture looks a bit different. Japan and Italy have both a large amount of debt in absolute terms, and as a % of GDP.
The United States has a more moderate debt as a % of GDP.
The third graph shows the size of sovereign debt compared to equities and other bonds.
 Because of its immense size, sovereign debt is one of the largest risks to the global financial system. There are many linkages to sovereign debt, including interest rates, exchange rates, bank debt, and credit default swaps. Many of the potential problems and risks are surprising, even to those well-versed in their particular area of finance.
CR Note: This is from "Some investor guy". Over the next couple of weeks, some investor guy will address several questions: How often have sovereign countries defaulted in the past? What are market estimates of the probabilities of default? What are total estimated losses on sovereign bonds due to default? What happens if things go really badly and what are the indirect effects of default?
Part 2 will be posted on Saturday: How often have sovereign countries defaulted in the past?
Series:
• Part 1: How Large is the Outstanding Value of Sovereign Bonds?
• Part 2. How Often Have Sovereign Countries Defaulted in the Past?
• Part 2B: More on Historic Sovereign Default Research
• Part 3. What are the Market Estimates of the Probabilities of Default?
• Part 4. What are Total Estimated Losses on Sovereign Bonds Due to Default?
• Part 5A. What Happens If Things Go Really Badly? $15 Trillion of Sovereign Debt in Default
• Part 5B. Part 5B. What Happens If Things Go Really Badly? More Things Can Go Badly: Credit Default Swaps, Interest Swaps and Options, Foreign Exchange
• Part 5C. Some Policy Options, Good and Bad
• Part 5D. European Banks, What if Things Go Really Badly?
Weekly Initial Unemployment Claims decline to 454,000
by Calculated Risk on 7/08/2010 08:30:00 AM
The DOL reports on weekly unemployment insurance claims:
In the week ending July 3, the advance figure for seasonally adjusted initial claims was 454,000, a decrease of 21,000 from the previous week's revised figure of 475,000. The 4-week moving average was 466,000, a decrease of 1,250 from the previous week's revised average of 467,250.
...
The advance number for seasonally adjusted insured unemployment during the week ending June 26 was 4,413,000, a decrease of 224,000 from the preceding week's revised level of 4,637,000.
 Click on graph for larger image in new window.
This graph shows the 4-week moving average of weekly claims since January 2000.
The four-week average of weekly unemployment claims decreased this week by 1,250 to 466,000.
The dashed line on the graph is the current 4-week average.
Initial weekly claims have been at about the same level since December 2009. Historically the current level of 454,000, and 4-week average of 466,000, would suggest ongoing weakness in the labor market.
Wednesday, July 07, 2010
Reis: Apartment Vacancy Rates decline slightly
by Calculated Risk on 7/07/2010 11:59:00 PM
From Nick Timiraos at the WSJ: Apartment Vacancies Fell in Quarter
The national apartment vacancy rate stood at 7.8% at the end of June, according to Reis Inc., a New York real-estate research firm. That was down from the 8% vacancy rate during the first quarter, which was the highest vacancy rate in 30 years. ...This is still near the record vacancy rate set last quarter. This decline fits with the recent survey from the NMHC that showed lower apartment vacancies.
Rents gained by 0.7% during the seasonally strong April-to-June period, the biggest quarterly gain in two years.
Note: the Reis numbers are for cities. The overall vacancy rate from the Census Bureau was at a near record 10.6% in Q1 2010.
CRE Extend and Pretend
by Calculated Risk on 7/07/2010 08:20:00 PM
From David Levitt at Bloomberg: U.S. Commercial Property Sales Trail Six-Year Average (ht Mike in Long Island)
In top cities such as New York and Washington, owners who owe more than their properties are worth are instead finding new sources of equity and lenders are willing to restructure their loans, [Sam Chandan, Real Capital’s chief economist] said. In less attractive markets, banks have been extending loans, waiting for higher prices so they don’t record losses ...From Carriick Mollenkamp and Lingling Wei at the WSJ: To Fix Sour Property Deals, Lenders 'Extend and Pretend'
A big push by banks in recent months to modify [commercial real-estate] loans—by stretching out maturities or allowing below-market interest rates—has slowed a spike in defaults. It also has helped preserve banks' capital, by keeping some dicey loans classified as "performing" and thus minimizing the amount of cash banks must set aside in reserves for future losses.With office vacancy rates at a 17 year high, and mall vacancy rates at a 19 year high, there is going to be a long wait ...
Restructurings of nonresidential loans stood at $23.9 billion at the end of the first quarter, more than three times the level a year earlier and seven times the level two years earlier
European Bank Stress Test: 91 Banks, results on July 23rd
by Calculated Risk on 7/07/2010 04:53:00 PM
From the Committee of European Banking Supervisors (CEBS) Key Features of the extended EU-wide Stress Test
The objective of the extended stress test exercise is to assess the overall resilience of the EU banking sector and the banks’ ability to absorb further possible shocks on credit and market risks, including sovereign risks, and to assess the current dependence on public support measures.The document has a list of the 91 banks.
The exercise is being conducted on a bank-by-bank basis using commonly agreed macro-economic scenarios (baseline and adverse) for 2010 and 2011, developed in close cooperation with the ECB and the European Commission.
...
On aggregate, the adverse scenario assumes a 3 percentage point deviation of GDP for the EU compared to the European Commission’s forecasts over the two-year time horizon. The sovereign risk shock in the EU represents a deterioration of market conditions as compared to the situation observed in early May 2010.
...
The results of the stress test will be disclosed, both on an aggregated and on a bank-by-bank basis, on 23 July 2010.
More from Bloomberg: EU Stress Tests Will Cover 91 Banks, Assume Bond Drop
Real Estate Sign of the Times: "Price Reduced"
by Calculated Risk on 7/07/2010 01:25:00 PM
I see "Priced Reduced" on many For Sale signs these days ...
From Thomas Grillo at the Boston Herald: Boston sellers cut prices (ht StickyDownside)
There’s a silver lining for would-be home buyers who missed the April 30 deadline for the $8,000 federal tax credit: Sellers are dropping prices.Also these price reductions are one of the key reasons why a number of deals didn't close by June 30th - the deals just wouldn't appraise at the agreed upon price because identical units are now being offered for less.
The average price reduction for a single-family home or condominium in the Bay State last month was 8 percent, or $38,883 off the original asking price, according to real estate search engine Trulia.com.
In Suffolk County, which includes the cities of Boston, Chelsea, Revere and Winthrop, the price reduction was $43,288, or 7 percent off the listing price.
Falling Mortgage Rates and Refi Mini-Boom
by Calculated Risk on 7/07/2010 09:50:00 AM
The Mortgage Bankers Association reported this morning that refinance activity increased again:
The Refinance Index increased 9.2 percent from the previous week and is the highest Refinance Index observed in the survey since the week ending May 15, 2009.
...
The refinance share of mortgage activity increased to 78.7 percent of total applications from 76.8 percent the previous week, which is the highest refinance share observed in the survey since April 2009.
 Click on graph for larger image in new window.
This graph shows the monthly MBA refinance index (Blue) and mortgage rates from the Freddie Mac Primary Mortgage Market Survey - and the Fed Funds target rate since Jan 1990.
Even with the recent decline in mortgage rates, refinance activity is still well below the peak in 2009. The reason is the 30 year mortgage rate is only slightly below the rates of April and May 2010 (4.6% now compared to just over 4.8% in 2009), so for those who refinanced last year there isn't much incentive to refinance now (considering the cost to refinance).
Of course many homeowners can't refinance because they owe more than their homes are worth, or their incomes have declined and they can't qualify.
MBA: Mortgage Purchase Applications Decrease, Refis increase
by Calculated Risk on 7/07/2010 07:21:00 AM
The MBA reports: Mortgage Refinance Applications Increase in Latest MBA Weekly Survey
The Refinance Index increased 9.2 percent from the previous week and is the highest Refinance Index observed in the survey since the week ending May 15, 2009. The seasonally adjusted Purchase Index decreased 2.0 percent from one week earlier. The Purchase Index has decreased eight of the last nine weeks.
...
“Mortgage rates remained near record lows last week, as incoming data on the job and housing markets were weaker than anticipated. As more homeowners locked in to these low rates, the level of refinance applications increased to a new 13-month high,” said Michael Fratantoni, MBA’s Vice President of Research and Economics. “For the month of June, purchase applications declined almost 15 percent relative to the prior month, and were down more than 30 percent compared to April, the last month in which buyers were eligible for the tax credit.”
...
The average contract interest rate for 30-year fixed-rate mortgages increased to 4.68 percent from 4.67 percent, with points decreasing to 0.86 from 0.96 (including the origination fee) for 80 percent loan-to-value (LTV) ratio loans.
 Click on graph for larger image in new window.
This graph shows the MBA Purchase Index and four week moving average since 1990.
There has been a mini-refi boom because of the low mortgage rates, but the purchase index has fallen sharply to the levels of 1996.


