 RSS Feed
 by Calculated Risk on 6/24/2010 02:43:00 PM
Thursday, June 24, 2010
Lennar: June Home Sales off 20% to 25% from 2009
From Bloomberg: Lennar Home Sales Down as Much as 25% in June as Tax Credit Ends, CEO Says (ht Brian)
Lennar Corp.’s home sales are down 20 percent to 25 percent this month compared with a year earlier ... Chief Executive Officer Stuart Miller said.In June 2009, new home sales were at a 396K seasonally adjusted annual rate. This is just one home builder, but a 20% to 25% decline would put sales in June at about the record low level of May. This is almost certain to the worst June sales rate since the Census Bureau started keeping records in 1963.
“The entire market knew there’d be a slowdown as we came off the tax credit,” Miller said on a conference call with investors today. “It’s just that the reality of it doesn’t feel good.”
Hotel Occupancy Rate increases
by Calculated Risk on 6/24/2010 01:12:00 PM
From HotelNewsNow.com: STR: US results for week ending 19 June
In year-over-year measurements, the industry’s occupancy last week increased 5.8 percent to 66.7 percent. Average daily rate rose 1.1 percent to US$98.03—the third time in four weeks that the measurement has risen. Revenue per available room rose 7.0 percent to US$65.36.The following graph shows the four week moving average for the occupancy rate by week for 2008, 2009 and 2010 (and a median for 2000 through 2007).
 Click on graph for larger image in new window.
Notes: the scale doesn't start at zero to better show the change.
On a 4-week basis, occupancy is up 8.1% compared to last year (the worst year since the Great Depression) and still almost 7% below normal. About half way back!
Last year leisure travel (summer) held up better than business travel, now it appears business travel is recovering - and we will soon see if leisure travel will also pick up this year.
Data Source: Smith Travel Research, Courtesy of HotelNewsNow.com
30 Year Mortgage Rates fall to Record Low
by Calculated Risk on 6/24/2010 10:54:00 AM
From Reuters: Mortgage Rates Drop to Lowest Level on Record
Interest rates on U.S. 30-year fixed-rate mortgages, the most widely used loan, averaged 4.69 percent for the week ended June 24, the lowest since Freddie Mac started the survey in April 1971.
 Click on graph for larger image in new window.
This graph shows the 30 year fixed rate mortgage interest rate, and the Ten year Treasury yield since 2002. The 30 year mortgage rate is now at a series low (started in 1971), although the spread between the mortgage rate and the treasury yield has widened about 30 bps recently.
The decline in mortgage rates is related to the weak economy and falling treasury yields.
Weekly Initial Unemployment Claims Decline, Still High
by Calculated Risk on 6/24/2010 08:30:00 AM
The DOL reports on weekly unemployment insurance claims:
In the week ending June 19, the advance figure for seasonally adjusted initial claims was 457,000, a decrease of 19,000 from the previous week's revised figure of 476,000. The 4-week moving average was 462,750, a decrease of 1,500 from the previous week's revised average of 464,250.
...
The advance number for seasonally adjusted insured unemployment during the week ending June 12 was 4,548,000, a decrease of 45,000 from the preceding week's revised level of 4,593,000.
 Click on graph for larger image in new window.
This graph shows the 4-week moving average of weekly claims since January 2000.
The four-week average of weekly unemployment claims decreased this week by 1,500 to 462,750.
The dashed line on the graph is the current 4-week average.
Initial weekly claims have been at about the same level since December 2009. The current level of 457,000 (and 4-week average of 462,750) is still high, and suggests ongoing weakness in the labor market.
Wednesday, June 23, 2010
DOT: Vehicle Miles Driven increase in April
by Calculated Risk on 6/23/2010 11:59:00 PM
Note: on New Home sales, please see: New Home Sales collapse to Record Low in May
The Department of Transportation (DOT) reported that vehicle miles driven in April were up 1.2% from April 2009:
Travel on all roads and streets changed by +1.2% (3.1 billion vehicle miles) for April 2010 as compared with April 2009. Travel for the month is estimated to be 255.9 billion vehicle miles.
Cumulative Travel for 2010 changed by -0.2% (-1.6 billion vehicle miles).
 Click on graph for larger image in new window.
This graph shows the rolling 12 month total vehicle miles driven.
On a rolling 12 month basis, miles driven are still 2.0% below the peak - and only 0.6% above the recent low - suggesting a sluggish recovery.
Home Sales: Distressing Gap
by Calculated Risk on 6/23/2010 08:06:00 PM
This is something I've been tracking for years ... the first graph shows existing home sales (left axis) and new home sales (right axis) through May. This graph starts in 1994, but the relationship has been fairly steady back to the '60s. Then along came the housing bubble, and the "distressing gap" (due partially to distressed sales). Click on graph for larger image in new window.
Initially the gap was caused by the flood of distressed sales. This kept existing home sales elevated, and depressed new home sales since builders couldn't compete with the low prices of all the foreclosed properties.
The two spikes in existing home sales were due primarily to the first time homebuyer tax credit (the initial credit last year, followed by the extension to April 30th / close by June 30th). There were also two smaller bumps for new home sales related to the tax credit. Since new home sales are reported when contracts are signed, the 2nd spike for new home sales was in April and then sales collapsed in May.
The second graph shows the same information as a ratio - new home sales divided by existing home sales - through May 2010. The ratio decreased because the expiration of the tax credit impacts new home sales first. This is the all time low for the ratio (due to timing issues), and the ratio will increase somewhat as existing home sales collapse in July.
I expect that eventually this ratio will return to the historical range of new home sales being around 15% to 20% of existing home sales. However that will only happen after the huge overhang of existing inventory (especially distressed inventory) is significantly reduced.
Fannie Mae cracks down on "Walk Aways"
by Calculated Risk on 6/23/2010 04:00:00 PM
Note: Earlier post on New Home sales: New Home Sales collapse to Record Low in May
From Fannie Mae: Fannie Mae Increases Penalties for Borrowers Who Walk Away
Fannie Mae (FNM/NYSE) announced today policy changes designed to encourage borrowers to work with their servicers and pursue alternatives to foreclosure. Defaulting borrowers who walk-away and had the capacity to pay or did not complete a workout alternative in good faith will be ineligible for a new Fannie Mae-backed mortgage loan for a period of seven years from the date of foreclosure.I'm not sure how they can tell if someone "walks away" (a borrower who could afford to make their mortgage payments, but instead strategically defaults), or if the borrower had no real choice.
...
Fannie Mae will also take legal action to recoup the outstanding mortgage debt from borrowers who strategically default on their loans in jurisdictions that allow for deficiency judgments. In an announcement next month, the company will be instructing its servicers to monitor delinquent loans facing foreclosure and put forth recommendations for cases that warrant the pursuit of deficiency judgments.
But this suggests that the number of strategic defaults is increasing.
And this reminds us of one of the tragedies of the bubble: many people bought before they were ready, or bought too much home. Whether they are "walking away" or losing their home because they can't afford it, they will be out of the market for some time.
FOMC Statement: Less Positive
by Calculated Risk on 6/23/2010 02:15:00 PM
The comments on the economy were slightly more negative than last meeting. The Fed noted the financial issues in Europe, and also commented that "underlying inflation has trended lower". Each statements was slightly less positive ...
From the Fed:
Information received since the Federal Open Market Committee met in April suggests that the economic recovery is proceeding and that the labor market is improving gradually. Household spending is increasing but remains constrained by high unemployment, modest income growth, lower housing wealth, and tight credit. Business spending on equipment and software has risen significantly; however, investment in nonresidential structures continues to be weak and employers remain reluctant to add to payrolls. Housing starts remain at a depressed level. Financial conditions have become less supportive of economic growth on balance, largely reflecting developments abroad. Bank lending has continued to contract in recent months. Nonetheless, the Committee anticipates a gradual return to higher levels of resource utilization in a context of price stability, although the pace of economic recovery is likely to be moderate for a time.The key language about rates stayed the same: "The Committee ... continues to anticipate that economic conditions, including low rates of resource utilization, subdued inflation trends, and stable inflation expectations, are likely to warrant exceptionally low levels of the federal funds rate for an extended period."
Prices of energy and other commodities have declined somewhat in recent months, and underlying inflation has trended lower. With substantial resource slack continuing to restrain cost pressures and longer-term inflation expectations stable, inflation is likely to be subdued for some time.
The Committee will maintain the target range for the federal funds rate at 0 to 1/4 percent and continues to anticipate that economic conditions, including low rates of resource utilization, subdued inflation trends, and stable inflation expectations, are likely to warrant exceptionally low levels of the federal funds rate for an extended period.
The Committee will continue to monitor the economic outlook and financial developments and will employ its policy tools as necessary to promote economic recovery and price stability.
Voting for the FOMC monetary policy action were: Ben S. Bernanke, Chairman; William C. Dudley, Vice Chairman; James Bullard; Elizabeth A. Duke; Donald L. Kohn; Sandra Pianalto; Eric S. Rosengren; Daniel K. Tarullo; and Kevin M. Warsh. Voting against the policy action was Thomas M. Hoenig, who believed that continuing to express the expectation of exceptionally low levels of the federal funds rate for an extended period was no longer warranted because it could lead to a build-up of future imbalances and increase risks to longer-run macroeconomic and financial stability, while limiting the Committee’s flexibility to begin raising rates modestly.
Estimate of June Decennial Census impact on payroll employment: minus 243,000
by Calculated Risk on 6/23/2010 12:16:00 PM
The Census Bureau released the weekly payroll data for the week ending June 12th this morning (ht Bob_in_MA). If we subtract the number of temporary 2010 Census workers in the week containing the 12th of the month, from the same week for the previous month - this provides a close estimate for the impact of the Census hiring on payroll employment.
The Census Bureau releases the actual number with the employment report. 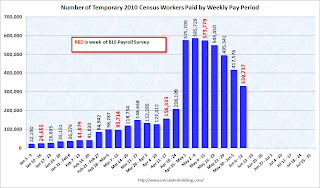 Click on graph for larger image in new window.
This graph shows the number of Census workers paid each week. The red labels are the weeks of the BLS payroll survey.
The Census payroll decreased from 573,779 for the week ending May 15th to 330,737 for the week ending June 12th.
So my estimate for the impact of the Census on June payroll employment is minus 243 thousand (this will be close). The employment report will be released on July 2nd, and the headline number for June - including Census numbers - will almost certainly be negative. But a key number will be the hiring ex-Census (so we will add back the Census workers this month).
New Home Sales collapse to Record Low in May
by Calculated Risk on 6/23/2010 10:00:00 AM
The Census Bureau reports New Home Sales in May were at a seasonally adjusted annual rate (SAAR) of 300 thousand. This is a sharp decrease from the revised rate of 446 thousand in April (revised from 504 thousand). Click on graph for larger image in new window.
The first graph shows monthly new home sales (NSA - Not Seasonally Adjusted).
Note the Red columns for 2010. In May 2010, 28 thousand new homes were sold (NSA). This is a new record low.
The previous record low for the month of May was 34 thousand in 2009; the record high was 120 thousand in May 2005. The second graph shows New Home Sales vs. recessions for the last 45 years.
Sales of new single-family houses in May 2010 were at a seasonally adjusted annual rate of 300,000 ... This is 32.7 percent (±9.9%) below the revised April rate of 446,000 and is 18.3 percent (±13.0%) below the May 2009 estimate of 367,000.And another long term graph - this one for New Home Months of Supply.
 Months of supply increased to 8.5 in May from 5.8 April. The all time record was 12.4 months of supply in January 2009. Since the sales rate declined sharply, the months of supply increased - this is still very high (less than 6 months supply is normal).
 The seasonally adjusted estimate of new houses for sale at the end of May was 213,000. This represents a supply of 8.5 months at the current sales rate.
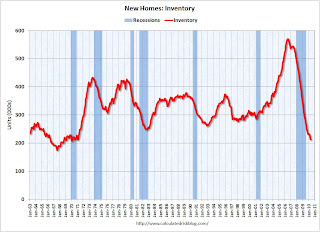 The final graph shows new home inventory.
 New home sales are counted when the contract is signed, so the tax credit related pickup in sales activity happened in April. This pulled demand forward, and April was probably the peak for new home sales this year.
The 300 thousand annual sales rate is a new all time record low. The previous record low annual sales rate was 338 thousand in September 1981.


