 RSS Feed
 by Calculated Risk on 6/23/2010 07:55:00 AM
Wednesday, June 23, 2010
MBA: Mortgage Purchase Applications Decrease in Weekly Survey
The MBA reports: Mortgage Applications Decrease in Latest MBA Weekly Survey
The Refinance Index decreased 7.3 percent from the previous week and the seasonally adjusted Purchase Index decreased 1.2 percent from one week earlier.
...
The average contract interest rate for 30-year fixed-rate mortgages decreased to 4.75 percent from 4.82 percent, with points increasing to 1.07 from 0.89 (including the origination fee) for 80 percent loan-to-value (LTV) ratio loans. This is the lowest 30-year contract rate observed in the survey since the week ending May 15, 2009.
 Click on graph for larger image in new window.
This graph shows the MBA Purchase Index and four week moving average since 1990.
The purchase index has collapsed following the expiration of the tax credit suggesting home sales will fall sharply too. This is the lowest level for 4-week average of the purchase index since February 1997.
Tuesday, June 22, 2010
AIA: Architecture Billings Index declines in May
by Calculated Risk on 6/22/2010 11:59:00 PM
Note: This index is a leading indicator for Commercial Real Estate (CRE) investment.
Reuters reports that the American Institute of Architects’ Architecture Billings Index declined to 45.8 in May from 48.5 in April. Any reading below 50 indicates contraction.
The ABI press release is not online yet. Click on graph for larger image in new window.
This graph shows the Architecture Billings Index since 1996. The index has remained below 50, indicating falling demand, since January 2008.
Note: Nonresidential construction includes commercial and industrial facilities like hotels and office buildings, as well as schools, hospitals and other institutions.
This suggests the slump for commercial real estate design is ongoing. According to the AIA, there is an "approximate nine to twelve month lag time between architecture billings and construction spending" on non-residential construction. So there will probably be further declines in CRE investment through all of 2010, and probably well into 2011.
How high will Existing Home Months-of-Supply increase this summer?
by Calculated Risk on 6/22/2010 07:28:00 PM
Earlier I posted a graph showing the relationship of existing home months-of-supply to house prices. When months-of-supply is below 6 months, house prices are typically rising - and above 6 months-of-supply, house prices are usually falling (this isn't perfect, but it is a general guide).
So how high will months-of-supply rise this summer?
Here are some estimates of sales via James Haggerty at the WSJ: Outlook for Home Prices Grows Darker
Since April 30, new purchase contracts have plunged ... Lawrence Yun, chief economist for the Realtors, estimated that contracts signed in May were 10% to 15% below the weak level of a year earlier.Contracts signed in May and June lead to sales later in the summer (counted when escrow closes).
Ronald Peltier, chief executive officer of HomeServices of America Inc., which owns real estate brokers in 21 states, said new home-purchase contracts in May and June so far are down about 20% from a year earlier.
Sales in July 2009 were at a 5.14 million rate (SAAR). Usually inventory increases in July, but if we assume inventory is steady at 3.892 million, the following table shows the month-of-supply estimates based on three year-over-year declines sales in July 2009:
| Sales Decline from 2009 | July Sales Rate (millions) | Months-of-Supply |
|---|---|---|
| Off 10% | 4.63 | 10.1 |
| Off 15% | 4.37 | 10.7 |
| Off 20% | 4.11 | 11.4 |
The peak for months-of-supply was 11.2 months in 2008. And house prices? The Case-Shiller composite 20 index fell 17.2% in 2008.
We are much closer to the price bottom now than in 2008, and I don't expect that severe of a price decline. But I do expect house prices to fall in the 2nd half of 2010 and into 2011 - probably another 5% to 10% for the major house price indexes (Case-Shiller and CoreLogic).
Of course inventory could decline or sales increase a little ... and maybe months-of-supply will only be close to double digits.
Market Update, Fed Meeting Preview and more
by Calculated Risk on 6/22/2010 04:03:00 PM

Click on graph for interactive version in new window.
The graph has tabs to look at the different bear markets - "now" shows the current market - and there is also a tab for the "four bears".
Tomorrow the Census Bureau will release New Home sales for May (consensus is for around 400,000) and the FOMC statement will be released.
Tom Lawler called the existing home sales number correctly today (he constructed an estimate from local data), and he is taking the under on new home sales too. See: Lawler: Home Sales in May: A Look at the Data.
On Sunday I posted a preview of the FOMC statement: Look Ahead to FOMC Statement on Wednesday. The statement will be a little less upbeat.
And on existing home sales today (with graphs):
Existing Homes: Months of Supply and House Prices
by Calculated Risk on 6/22/2010 02:34:00 PM
Earlier I mentioned that a normal housing market usually has under 6 months of supply. The current 8.3 months of supply is significantly above normal, and is especially concerning because the reported inventory is already historically very high.
After the tax credit related activity ends, the months of supply will probably increase, and the ratio could be close to double digits later this year. That level of supply will put additional downward pressure on house prices.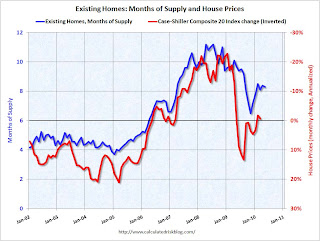 Click on graph for larger image in new window.
This graph show months of supply and the annualized change in the Case-Shiller Composite 20 house price index (inverted).
Below 6 months of supply (blue line) house prices are typically rising (red line, inverted).
Above 6 months of supply house prices are usually falling (although there were many programs to support house prices over the last year).
Later this year the months of supply will probably increase, and I expect house prices to fall further as measured by the Case-Shiller and CoreLogic repeat sales house price indexes.
Existing Home Sales: Inventory increases Year-over-Year
by Calculated Risk on 6/22/2010 11:28:00 AM
Earlier the NAR released the existing home sales data for May; here are a couple more graphs ...
The first graph shows the year-over-year (YoY) change in reported existing home inventory and months-of-supply. Inventory is not seasonally adjusted, so it really helps to look at the YoY change.  Click on graph for larger image in new window.
Inventory increased 1.1% YoY in May. This is the second consecutive month of a year-over-year increases in inventory. Although the YoY increase is small, I expect it will be higher later this year.
This increase in inventory is especially concerning because the reported inventory is already historically very high, and the 8.3 months of supply in May is well above normal. The months of supply will probably stay near this level in June, because of more tax credit related sales (reported at closing), but the months-of-supply could be close to double digits later this year.
And a double digit months-of-supply would be a really bad sign for house prices ... The second graph shows NSA monthly existing home sales for 2005 through 2010 (see Red columns for 2010).
Sales (NSA) in May 2010 were 17.7% higher than in May 2009, and also higher than in May 2008.
We will probably see sales at around this level in June because of the tax credit, however I expect to see existing home sales below last year in the 2nd half of this year.
This was definitely a weak report. Sales were up year-over-year because of the tax credit pulling sales forward, but that does very little for the economy. The key is the inventory and months-of-supply, and if these two measures increase later this year as I expect, then there will be additional downward pressure on house prices.
Existing Home Sales decline in May
by Calculated Risk on 6/22/2010 10:00:00 AM
The NAR reports: May Shows a Continued Strong Pace for Existing-Home Sales
Existing-home sales, which are completed transactions that include single-family, townhomes, condominiums and co-ops, were at a seasonally adjusted annual rate of 5.66 million units in May, down 2.2 percent from an upwardly revised surge of 5.79 million units in April. May closings are 19.2 percent above the 4.75 million-unit level in May 2009; April sales were revised to show an 8.0 percent monthly gain.
...
Total housing inventory at the end of May fell 3.4 percent to 3.89 million existing homes available for sale, which represents an 8.3-month supply at the current sales pace, compared with an 8.4-month supply in April. Raw unsold inventory is 1.1 percent above a year ago, but is still 14.9 percent below the record of 4.58 million in July 2008.
 Click on graph for larger image in new window.
This graph shows existing home sales, on a Seasonally Adjusted Annual Rate (SAAR) basis since 1993.
Sales in May 2010 (5.66 million SAAR) were 2.2% lower than last month, and were 19.2% higher than May 2009 (4.75 million SAAR).
 The second graph shows nationwide inventory for existing homes.
According to the NAR, inventory decreased to 3.89 million in May from 4.04 million in April. The all time record high was 4.58 million homes for sale in July 2008.
Inventory is not seasonally adjusted and there is a clear seasonal pattern with inventory increasing in the spring and into the summer. The increase in April 2010 was partially related to sellers hoping to take advantage of the housing tax credit, and a decline in May was expected (I'll have more on inventory later).
 The last graph shows the 'months of supply' metric.
Months of supply decreased slightly to 8.3 months in May. A normal market has under 6 months of supply, so this is high - and probably excludes some substantial shadow inventory. And the months of supply will probably increase sharply this summer as sales fade.
This was a very weak report - as anticpated by Tom Lawler yesterday (see Lawler: Home Sales in May: A Look at the Data ). I'll have more ...
Moody's: Commercial Real Estate Prices increase 1.7% in April
by Calculated Risk on 6/22/2010 08:36:00 AM
Moody's reported today that the Moody’s/REAL All Property Type Aggregate Index increased 1.7% in April, after declining for the previous two months. This is a repeat sales measure of commercial real estate prices.
Below is a comparison of the Moodys/REAL Commercial Property Price Index (CPPI) and the Case-Shiller composite 20 index.
Notes: Beware of the "Real" in the title - this index is not inflation adjusted. Moody's CRE price index is a repeat sales index like Case-Shiller - but there are far fewer commercial sales - and that can impact prices.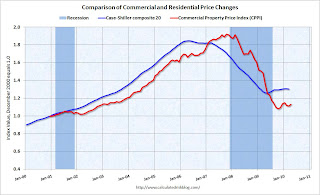 Click on graph for larger image in new window.
CRE prices only go back to December 2000.
The Case-Shiller Composite 20 residential index is in blue (with Dec 2000 set to 1.0 to line up the indexes).
It is possible that commercial real prices have bottomed - in general - but it is hard to tell because the number of transactions are very low and there are a number of distressed sales. Prices have been choppy and mostly moving sideways.
Commercial real estate values are now down 16% over the last year, and down 41% from the peak in late 2007.
Monday, June 21, 2010
Update on California bill to extend anti-deficiency rules to some Refinanced Mortgages
by Calculated Risk on 6/21/2010 10:32:00 PM
Last week I mentioned the potential law change in California: Under California law, purchase money loans are non-recourse. However once a homeowner refinances, the entire mortgage is recourse ... that is probably going to change ...
Note: This bill, if passed, will take effect June 1, 2011. Here is the proposed bill (ht pastafarian)
From David Streitfeld at the NY Times: Battles in California Over Mortgages
Lenders in California rarely chase foreclosed borrowers for deficiency judgments. Pursuing such cases in court can be an arduous process, and few of those in foreclosure have the assets or incomes to make it worthwhile.There is much more in the article. Of course the bankers are fighting to make this apply only to new loans after June 2011. The realtors are fighting to make it apply to current loans ...
But the threat of such action can come in handy for lenders, servicers and collection agencies. By raising the possibility of a court fight, they can negotiate favorable terms when agreeing to loan modifications and workouts, surrenders of deeds and sales for less than the full amount owed, also known as short sales.
“Using the threat of a deficiency, full-recourse lenders often prevail upon distressed borrowers to sign new, unsecured obligations in exchange for their assent to a proposed short sale or surrender of a deed,” said William A. Markham, a lawyer with Maldonado & Markham in San Diego. “This practice will nearly vanish overnight if the new measure becomes law.”
Lawler: Home Sales in May: A Look at the Data
by Calculated Risk on 6/21/2010 07:15:00 PM
CR Note: As mentioned in the Look Ahead post, the consensus for existing home sales (to be announced Tuesday) is for an increase to 6.2 million sales in May (SAAR), from 5.77 million in April (SAAR). For new home sales, the consensus is for a sharp decrease in sales to around 400K (SAAR), down from 504K in April.
Housing economist Tom Lawler is taking the under. The following is from Tom:
While most (though by no means all) of the country appears to have experienced a sharp gain in existing home sales (closed) this May vs. a year ago, the nationwide increase does not appear to have been as high as the surge in pending sales (related to the expiring tax credit) in March and April would have suggested. Last year’s “comp,” of course, was pretty low: the NAR estimates that existing home sales last May ran at a seasonally adjusted annual rate of 4.75 million, and unadjusted sales were estimated at 447,000. While this May’s “seasonal factor” should be lower than last May’s (meaning flat unadjusted sales would produce a seasonally adjusted increase), I estimate that unadjusted sales this May vs. last May would have to be up about 19.2% for seasonally adjusted sales to be flat to April. Obviously sales in many areas of the country were up a lot more than that, but in some large states sales showed much smaller gains, and a few saw declines.
Dataquick estimates that new and resale home sales in California were up 4.9%, with the “small” gain mainly resulting from a decline in foreclosure sales. While this stat is based on deeds recorded and includes new sales, MLS data I’ve seen aren’t too far off. The Michigan Association of Realtors reported a YOY decline in sales in May, with the drop coming many in foreclosure sales in very distressed areas. Sales in both Las Vegas and Phoenix were also down from a year ago, with both areas seeing sizable declines in foreclosure sales.
Many other states saw YOY sales gains that were decent, but hardly explosive. Based on realtor data from North Texas, Houston, San Antonio, Austin, Lubbock, and Wichita Falls, it appears as if Texas sales increased about 19.2%. Other states with “so-so” YOY sales gains include Iowa (20.8% statewide), Colorado (18% for Denver and Colorado Springs combined), Birmingham (16.8%), Indiana (14% Indianapolis and Fort Wayne combined), Minneapolis-St-Paul (10.7%), Greater Northern Virginia (6.2%), and quite a few (but not all) Florida markets showed very modest gains.
To be sure, many areas of the country saw sizable increases, but interestingly the vast bulk of these areas saw smaller YOY sales gains in May than in April.
When I add everything I have up, and make estimates for areas where I couldn’t find any reliable data, I come up with an estimated seasonally adjusted annual rate for existing home sales that is much smaller than I would have expected a few weeks ago – something in the range of 5.83 to 5.84 million, which would translate into an unadjusted YOY sales gain of around 20.5 to 20.6%, and would be a boatload under consensus.
Of course, my regional tracking – which until the last few months has easily produced a better-than-consensus estimate, of late has been low to the downside. More troubling (to me, at least), I’ve had trouble “reconciling” to the NAR data even after getting state/local realtor sales data not available until the day of the existing home sales report (or later in some cases!).
Nevertheless, the “raw” data I’ve seen so far suggests that existing home sales in May will come in well under “consensus” – for reasons that are unclear, and until recently to my surprise.
On the new home sales front (to be reported by the Census Bureau), anecdotal reports from a wide range of builders, as well as from some local realtors, suggest that new home sales as defined by the CD probably ran a bit lower than last May, when sales (based on contracts signed/deposits taken) ran at a SAAR of 367 k. I’m “guessing” that the preliminary number for May will be somewhere around 330 k, which would be a monthly decline from April of 34.5% (which is probably close to the monthly decline we’ll see in the pending home sale index scheduled to be release by the NAR on July 1.
CR Note: This was from housing economist Tom Lawler. Note the caveats, but clearly the data suggests a downside surprise.


