 RSS Feed
 by Calculated Risk on 6/04/2010 01:17:00 PM
Friday, June 04, 2010
Temporary Help Services starting to slow, Small Business hiring "Bleak"
One more graph based on data in the employment report ...
Earlier employment posts today:
Temporary Help
From the BLS report:
Temporary help services added 31,000 jobs over the month; employment in the industry has risen by 362,000 since September 2009.
 This graph is a favorite of those expecting a huge rebound in employment. The graph is a little complicated - the red line is the three month average change in temporary help services (left axis). This is shifted four months into the future.
The blue line (right axis) is the three month average change in total employment (excluding temporary help services and Census hiring).
Unfortunately the data on temporary help services only goes back to 1990, but it does appear that temporary help leads employment by about four months (although noisy).
The thinking is that before companies hire permanent employees following a recession, employers will first increase the hours worked of current employees (hours worked increased again in May) and also hire temporary employees.
Since the number of temporary workers increased sharply late last year, some people argued this was signaling the beginning of a strong employment recovery - probably in April and May. It didn't happen.
There was also evidence of a shift by employers to more temporary workers, and the joke in the comments was "We are all temporary now!". That is probably closer to the mark. The timing of this graph is useful - temporary help services does lead general employment - but the magnitude of the swings is probably less useful.
Small Business Hiring "Bleak"
The National Federation of Independent Business released the employment outlook from their May survey: Small Business Still Reluctant to Hire
“Since January 2008, the average employment per firm has been negative every month, including May 2010, which yielded a seasonally adjusted loss of negative 0.5 workers per firm. Most firms did not change employment in May, but for those that did, 8 percent increased average employment by 2.4 employees and 20 percent reduced their workforces by an average of 4 employees. Small business job creation has not crossed the 0 line in over 2 years."
...
“Overall, the job creation picture is still bleak. Poor sales and uncertainty continue to hold back any commitments to growth, hiring or capital spending. Job creation plans have been running far below comparable quarters in the recovery from two other major recessions."
Euro falls under 1.20 Dollars, Hungary “manipulated” figures
by Calculated Risk on 6/04/2010 11:45:00 AM
A break from the employment report ...
Update: a couple of Hungarian readers have told me the translation was out of context (ht Gabor, Greg). Here is a different translation:
"It was prime minister Ferenc Gyurcsany [previous prime minister of the now opposition Socialist Party] who talked about default. Indeed, he even remarked proudly that Hungary was on the verge of default one and a half years ago ... and he was proud that he could only save Hungary from default with the help of IMF. In this regard it’s not an exaggeration to talk about default.”So the spokesman was apparently referring to the comments of the previous prime minister, and not talking about default now.
Also the readers said the figures that were "manipulated" were forecasts of deficit (not actual deficit like Greece).
The euro fell to under 1.20 dollars this morning as Hungary spooked investors.
From Bloomberg: Sovereign Credit-Default Swaps Surge on Hungarian Debt Crisis
Credit-default swaps on sovereign bonds surged to a record on speculation Europe’s debt crisis is worsening after Hungary said it’s in a “very grave situation” because a previous government lied about the economy ... a spokesman for Prime Minister Viktor Orban said talk of a default is “not an exaggeration” because a previous administration “manipulated” figures.
Employment-Population Ratio, Part Time Workers, Unemployed over 26 Weeks
by Calculated Risk on 6/04/2010 09:59:00 AM
Here are a few more graphs based on the employment report ...
Percent Job Losses During Recessions, aligned at Bottom Click on graph for larger image.
This graph shows the job losses from the start of the employment recession, in percentage terms - but this time aligned at the bottom of the recession.
The current recession bounced along the bottom for a few months - so the choice of bottom is a little arbitrary (plus or minus a month or two).
Notice that the 1990 and 2001 recessions were followed by jobless recoveries - and the eventual job recovery was gradual. In earlier recessions the recovery was somewhat similar and a little faster than the decline (somewhat symmetrical).
The dotted line shows the impact of Census hiring. In May, there were 564,000 temporary 2010 Census workers on the payroll. Starting in June, the number of Census workers will decline - and the two red lines will meet later this year.
Employment-Population Ratio
The Employment-Population ratio decreased to 58.7% in May (from 58.8% in April). This had been increasing after plunging since the start of the recession. This is about the same level as in December 1983. This graph shows the employment-population ratio; this is the ratio of employed Americans to the adult population.
Note: the graph doesn't start at zero to better show the change.
The Labor Force Participation Rate decreased to 65.0% from 65.2% in April. This is the percentage of the working age population in the labor force. This decline is disappointing, and the rate is well below the 66% to 67% rate that was normal over the last 20 years.
The reason the unemployment rate declined was because people left the workforce - and that is not good news. As the employment picture improves, people will return to the labor force, and that will put upward pressure on the unemployment rate.
Part Time for Economic Reasons 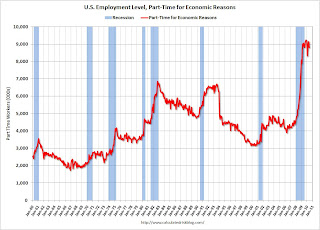 From the BLS report:
The number of persons employed part time for economic reasons (some-times referred to as involuntary part-time workers) declined by 343,000 in May to 8.8 million. These individuals were working part time because their hours had been cut back or because they were unable to find a full-time job.The number of workers only able to find part time jobs (or have had their hours cut for economic reasons) was at 8.809 million in April. This decline was a little bit of good news.
The all time record of 9.24 million was set in October.
These workers are included in the alternate measure of labor underutilization (U-6) that was at 16.6% in May.
Unemployed over 26 Weeks
 The blue line is the number of workers unemployed for 27 weeks or more. The red line is the same data as a percent of the civilian workforce.
According to the BLS, there are a record 6.763 million workers who have been unemployed for more than 26 weeks (and still want a job). This is a record 4.38% of the civilian workforce. (note: records started in 1948). It does appear the increases are slowing ...
Although the headline number of 431,000 payroll jobs was large, this was only 20,000 after adjusting for the 411,000 Census 2010 temporary hires. The underlying details were mixed. The positives: the unemployment rated decreased to 9.7%, the number of part time workers (for economic reasons) decreased helping to push down U-6 to 16.6% (from 17.1%), hourly wages increased (slightly), as did the average hours worked.
Negatives include the employment-population rate declining, the few payroll jobs ex-Census, and a record number of workers unemployed for more than 26 weeks. The number of long term unemployed is one of the key stories of this recession, especially since many of them are now losing their unemployment benefits.
I'll have even more later ...
Earlier employment post today:
May Employment Report: 20K Jobs ex-Census, 9.7% Unemployment Rate
by Calculated Risk on 6/04/2010 08:30:00 AM
From the BLS:
Total nonfarm payroll employment grew by 431,000 in May, reflecting the hiring of 411,000 temporary employees to work on Census 2010, the U.S. Bureau of Labor Statistics reported today. ... The unemployment rate edged down to 9.7 percent.Census 2010 hiring was 411,000 in May. Non-farm payroll employment increased 20,000 in May ex-Census.
 Click on graph for larger image.
This graph shows the unemployment rate and the year over year change in employment vs. recessions.
Nonfarm payrolls increased by 431,000 in May. The economy has lost 0.6 million jobs over the last year, and 7.4 million jobs since the recession started in December 2007. Ex-Census hiring, the economy only added 20,000 jobs in May.
The unemployment rate decreased to 9.7 percent.
 The second graph shows the job losses from the start of the employment recession, in percentage terms (as opposed to the number of jobs lost).
The dotted line is ex-Census hiring. The two lines will rejoin later this year when the Census hiring is unwound.
For the current recession, employment peaked in December 2007, and this recession is by far the worst recession since WWII in percentage terms, and 2nd worst in terms of the unemployment rate (only early '80s recession with a peak of 10.8 percent was worse).
This is a very weak report. The decrease in the unemployment rate was because of a decline in the participation rate - and that is not good news. I'll have much more soon ...
Thursday, June 03, 2010
WSJ: China's Property Market Freezes Up
by Calculated Risk on 6/03/2010 11:59:00 PM
The WSJ has an article tonight about the Chinese real estate market and the recent government actions: China's Property Market Freezes Up
Beijing in mid-April announced a package of policies intended to blow the froth out of the market by restricting speculative purchases. ... The housing market in many—though not all—Chinese cities seems to have nearly ground to a halt after the government moves. On average, the number of residential property transactions in the four weeks after the restrictions were announced is down 40% compared with the four weeks before the measuresThis slowdown is showing up in commodity prices. A key question is how the Chinese government will react.
Professor Michael Pettis, of the Peking University’s Guanghua School of Management, expects the Chinese government to take action to cushion the slow down, see Beijing’s stop-and-go measures: As
I have said many times before, I suspect we will see a lot of discontinuity in policymaking this year – amid lots of panicking – and recent events show just how. In the past few months Beijing seems to have become so worried about signs of overheating that, after trying unsuccessfully many times to pare growth carefully, it has given up the scalpel and has brought out the sledgehammer.It could be a wild ride.
...
Given the bad global environment, China’s huge domestic imbalances, and its out-of-control monetary condition, there are precious few tools Beijing has for fine-tuning growth. Instead policymakers are going to switch back and forth throughout the year between stomping on the accelerator and stomping on the brakes.
Oil and Florida Tourism
by Calculated Risk on 6/03/2010 08:34:00 PM
Earlier I posted: Oil Gusher impacting Gulf Coast Hotels
William Spain at MarketWatch has more: Spill could mean dark times for Sunshine State
At stake [in Florida] alone are hundreds of thousands of jobs and perhaps billions of dollars in revenue, depending on when and where the oil from BP PLC's runaway well makes landfall.Of course the loss of tourism pales in comparison to the ecological damage from the oil gusher.
Although the beaches were still in the clear as of Thursday afternoon, widespread reports of vacation cancellations are already coming in ...
"It is already ugly," said John Fareed, a partner at Fareed Zapala Koepke, an Orlando-based hospitality-industry consultancy. "When it hits, it will be real and will position itself in the psyche of consumers who are getting ready to make vacation plans. It is going to have a huge impact in terms of future bookings and cancellations.
"Every indication from the people we work with is that bookings have slowed to a trickle".
Euro Bond and CDS Spreads Widen
by Calculated Risk on 6/03/2010 03:36:00 PM
Here are two graphs from the Atlanta Fed weekly Financial Highlights released today (graph as of June 2nd): Click on graph for larger image in new window.
From the Atlanta Fed:
Despite the latest announcement of planned austerity measures by Spain, Portugal, and Italy, uncertainty around the adjustment
challenges in peripheral Europe continues to weigh on the region’s bond prices.
Downgrading of Spanish sovereign debt by Fitch and ongoing concerns about the Spanish banking sector further added to investor worries.
Compared with two weeks ago, peripheral Europe's bond spreads to bunds have widened by 30 basis points (bps) on average.
After declining early last week, sovereign debt spreads have begun widening for peripheral euro area countries. As of June 1, the 10-year bond spread stands at 503 basis points (bps) for Greece, 219 bps for Ireland, 195 bps for Portugal, and 162 bps for Spain.

Similarly, CDS spreads have risen after the initial response to the stabilization package.After declining following the policy response, the bond and CDS spreads have resumed their steady climb - especially for Greece and Portugal.
It should be noted that the German government, through its financial services regulator BaFin, unilaterally and temporarily banned naked short selling of sovereign debt securities, naked credit default swaps on European sovereign
debt in which the buyer has no hedging demand, and naked short sales in 10 prominent German financials.
And from Reuters today: Hungary Warns of Deficit Overshoot; EU Urges Action
Hungary ... government officials reiterated the 2010 fiscal gap may reach almost twice the target agreed with lenders including the EU. ... Public finances were in much worse shape than previously expected and there was only a slim chance of avoiding a Greek-style scenario, news portal napi.hu cited [the vice chairman of the ruling Fidesz party, Lajos Kosa] as saying.The euro is down to 1.2166 dollars, the lowest level in four years.
Report: Oil Gusher impacting Gulf Coast Hotels
by Calculated Risk on 6/03/2010 02:43:00 PM
From Christine Blank at HotelNewsNow.com: Oil-spill update: Hotels report mixed results
Tourism officials and hotel operators in Gulf of Mexico coastal regions say they are struggling with occupancy and reservations, but some areas are suffering more than others.The economic impact of the oil gusher is unclear, although tourism, fishing and shipping are all being impacted.
...
“We have had some cancellations. It is hitting the beachfront properties hard and the casinos have seen some impact ... and the charter boat companies,” said Richard Forester, executive director of the Mississippi Gulf Coast Convention and Visitors Bureau in Biloxi.
...
“Our members are experiencing unprecedented cancellations heading into their peak season, and this advertising campaign is critical to our economic survival,” said Carol Dover, president and CEO of the Florida Restaurant and Lodging Association in Tallahassee ... Many hoteliers in Northwest Florida that are typically at 90 percent occupancy rates heading into the Memorial Day weekend, were reporting a drop in bookings by 30 percent, according to the FRLA.
...
Texas’s coastal hotels also are feeling an impact, but that could be due to the overall U.S. economy more than to the oil spill.
“We have yet to have any cancellations [because of the oil spill],” said Theresa Elliott, GM of Casa del Mar Beachfront Suites, Galveston, Texas. ... Galveston-area hotels are significantly discounting rooms to boost stays, such as 20-percent off Sunday through Thursday stays, according to Elliott.
Employment Report Prediction: Bad Reporting!
by Calculated Risk on 6/03/2010 12:51:00 PM
This is probably a safe prediction: There will be some really bad reporting tomorrow.
Note: The May headline payroll number will be large (consensus is for 540,000 payroll jobs added in May), but this will include around 400,000 temporary Census jobs.
I think this poor reporting will fall into two major categories:
1) Reporters who use the headline payroll number and write that this shows the recovery is picking up steam. We will probably see someone use the headline number and write something like "This is the largest monthly gain since September 1983" - well, were there 400,000+ temporary Census hires in September 1983? If not, why does this comparison matter?
2) Anyone who calls the number of temporary census workers "fake" or subtracts the birth/death adjustment from the seasonally adjusted headline number.
I've spoken with actual Census workers, and I guarantee their jobs are not "fake". Their jobs are real but temporary, and it is appropriate to subtract the Census 2010 workers from the headline payroll number to determine the underlying trend (even though it is obvious, I verified this calculation with the Census Bureau).
And no matter what anyone thinks of the birth / death model, the adjustment is added to the NSA numbers - and can't be subtracted from the SA numbers. Note: I think the birth / death model is useful although we have to aware of the weaknesses (it misses turning points - something I wrote about in 2006).
The employment report has many useful numbers. But the key payroll number is U-3 minus the number of Census 2010 temporary workers. The Census Bureau is tasked with reporting an estimate of the number of payroll jobs each month - so they include the Census 2010 jobs - but they also provide the information on the number of Census hires (the report will be released here).
It is the responsibility of anyone reporting on the numbers to do the heavy math and subtract the Census workers from the headline number. I will report both numbers.
Starting in June, the impact of the Census 2010 on the payroll report will be negative - see: Impact of Census 2010 on Payroll Report. That will require adding the temporary Census 2010 workers back to determine the underlying trend.
For some reason, print reports tend to contain the first mistake, and online reports the second error. Both are poor reporting, although the second is far more egregious (because the statements are blatantly false).
Oh well ... sorry for the rant, but I'm already seeing some really bad "analysis".
ISM Non-Manufacturing Index Shows Expansion
by Calculated Risk on 6/03/2010 10:00:00 AM
The May ISM Non-Manufacturing index was at 55.4%, unchanged from April (slightly below expectations). The employment index showed some growth after 28 consecutive months of contraction.
From the Institute for Supply Management: May 2010 Non-Manufacturing ISM Report On Business®
Economic activity in the non-manufacturing sector grew in May for the fifth consecutive month, say the nation's purchasing and supply executives in the latest Non-Manufacturing ISM Report On Business®.
The report was issued today by Anthony Nieves, C.P.M., CFPM, chair of the Institute for Supply Management™ Non-Manufacturing Business Survey Committee; and senior vice president — supply management for Hilton Worldwide. "The NMI (Non-Manufacturing Index) registered 55.4 percent in May, the same percentage as registered in both April and March, indicating continued growth in the non-manufacturing sector. The Non-Manufacturing Business Activity Index increased 0.8 percentage point to 61.1 percent, reflecting growth for the sixth consecutive month. The New Orders Index decreased 1.1 percentage points to 57.1 percent, and the Employment Index increased 0.9 percentage point to 50.4 percent, reflecting growth for the first time after 28 consecutive months of contraction. The Prices Index decreased 4.1 percentage points to 60.6 percent in May, indicating that prices are still increasing but at a slower rate than in April. According to the NMI, 16 non-manufacturing industries reported growth in May. Respondents' comments remain mostly positive about current business conditions and the general direction of the economy."
emphasis added


