 RSS Feed
 by Calculated Risk on 5/21/2010 04:13:00 PM
Friday, May 21, 2010
Las Vegas land prices: 80% off peak
From Buck Wargo at the Las Vegas Sun: Foreclosures on land pushing prices back to 2003 levels
Since the peak of the market in 2007’s fourth quarter of $939,400 per acre for land not on the Strip, prices have fallen 80.6 percent, [Applied Analysis Principal Brian] Gordon said.And how about this ...
“I think we will continue to see downward pressure on prices for a while,” Gordon said. “The demand for raw land is somewhat weak. There is excess inventory of office, industrial and residential; and development activity has come to a near standstill in many of those sectors, so that they don’t need raw land.”
During the past year, many landowners have simply turned properties back to banks. ... “The reality is the landowners are finding themselves underwater and servicing their debt, and it has become a challenge,” Gordon said. “Many have opted to let the properties go back to the bank, not unlike what we have seen in the housing market.”More strategic defaults.
States: Mortgage Delinquency Rate vs. Unemployment Rate
by Calculated Risk on 5/21/2010 01:07:00 PM
Here is a scatter graph comparing the Q1 2010 delinquency rate for mortgage loans (including all loans in foreclosure) vs. the April unemployment rate for all states.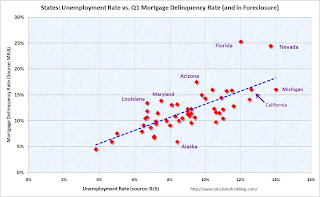 Click on graph for larger image in new window.
There definitely is a relationship between delinquency rates and the unemployment rate, although a couple of states really stand out; Florida and Nevada. Florida has a high number of delinquencies because of state specific foreclosure laws - it takes forever to foreclose.
The delinquency rate in Nevada is also very high, probably because of the large percentage of homeowners with negative equity. Both states might also have higher than expected delinquency rates because of significant investor activity during the housing bubble.
This does suggest that a large part of the delinquency problem is related to unemployment.
Note: Sorry I couldn't label all the states. Here are graphs by state for unemployment rates and mortgage delinquency rates.
April State Unemployment Rates: California and Nevada at series highs
by Calculated Risk on 5/21/2010 10:00:00 AM
From the BLS: Regional and State Employment and Unemployment Summary
Regional and state unemployment rates were generally little changed or slightly lower in April. Thirty-four states and the District of Columbia recorded unemployment rate decreases, 6 states had increases, and 10 states had no change. ...
Michigan again recorded the highest unemployment rate among the states, 14.0 percent in April. The states with the next highest rates were Nevada, 13.7 percent; California, 12.6 percent; and Rhode Island, 12.5 percent. North Dakota continued to register the lowest jobless rate, 3.8 percent, followed by South Dakota and Nebraska, 4.7 and 5.0 percent, respectively. The rate in Nevada set a new series high.
emphasis added
 Click on graph for larger image in new window.
This graph shows the high and low unemployment rates for each state (and D.C.) since 1976. The red bar is the current unemployment rate (sorted by the current unemployment rate).
Sixteen states and D.C. now have double digit unemployment rates. New Jersey is close.
Nevada set a new series high; California tied the previous record (since 1976).
Bundestag Approves Bailout, possible Strike in Spain
by Calculated Risk on 5/21/2010 08:41:00 AM
From the Financial Times: Bundestag backs eurozone rescue
Germany’s lower house of parliament on Friday narrowly approved Berlin’s contribution to the European Union’s €750bn package of loan guarantees ...The upper house, the Bundesrat, is expected to vote today and passage is expected.
From Reuters: Spain to 'probably' call general strike-report
Spain's largest workers union Comisiones Obreras could call a general strike to protest the government's austerity measures, its head Ignacio Fernandez Toxo said on Friday ...Sounds like just a one day strike.
The futures are off this morning ... but bouncing around.
Thursday, May 20, 2010
Krugman: Lost Decade Looming?
by Calculated Risk on 5/20/2010 11:58:00 PM
From Paul Krugman in the NY Times: Lost Decade Looming?
... Recent data don’t suggest that America is heading for a Greece-style collapse of investor confidence. Instead, they suggest that we may be heading for a Japan-style lost decade, trapped in a prolonged era of high unemployment and slow growth.The two key numbers: the unemployment rate is at 9.9% and inflation, by all key measures, is low and declining (CPI, core CPI, PCE deflator trimmed mean CPI, etc). Of the two problems, unemployment is real and now - and inflation is a possible future threat. The focus needs to stay on the real and now.
... As of Thursday, the 10-year [Treasury] rate was below 3.3 percent. I wish I could say that falling interest rates reflect a surge of optimism about U.S. federal finances. What they actually reflect, however, is a surge of pessimism about the prospects for economic recovery, pessimism that has sent investors fleeing out of anything that looks risky ...
Low inflation, or worse yet deflation, tends to perpetuate an economic slump ... just ask the Japanese, who entered a deflationary trap in the 1990s and, despite occasional episodes of growth, still can’t get out. And it could happen here.
So what we should really be asking right now isn’t whether we’re about to turn into Greece. We should, instead, be asking what we’re doing to avoid turning Japanese.
...
Will the worst happen? Not necessarily. Maybe the economic measures already taken will end up doing the trick, jump-starting a self-sustaining recovery. Certainly, that’s what we’re all hoping.
Financial Reform: Final Senate Vote Soon
by Calculated Risk on 5/20/2010 07:52:00 PM
Update: Passed 59 to 39.
From Brady Dennis at the WaPo: Senate clears way to vote on financial reform
A final vote on the legislation could come later Thursday evening, congressional aides said. Party leaders were working to resolve a number of procedural hurdles, but it appeared that a series of votes could begin around 7:30 p.m.
"We're passing this bill tonight," said Jim Manley, spokesman to Majority Leader Harry M. Reid (D-Nev.). "We're finishing this tonight."
Market Update
by Calculated Risk on 5/20/2010 03:45:00 PM
 Click on graph for larger image in new window.
The first graph shows the S&P 500 since 1990 (this excludes dividends).
The dashed line is the closing price today. The S&P 500 was first at this level in March 1998; over 12 years ago. 
The second graph is from Doug Short of dshort.com (financial planner): "Four Bad Bears".
Note that the Great Depression crash is based on the DOW; the three others are for the S&P 500.
As an aside, once again the Shanghai composite index appeared to lead both the S&P 500 and oil prices. Not only are there issues in Europe, but China is slowing ...
Freddie Mac: Near Record Low Mortgage Rates
by Calculated Risk on 5/20/2010 02:45:00 PM
From Freddie Mac: Long- and Short-Term Mortgage Rates Fall Again This Week
Freddie Mac today released the results of its Primary Mortgage Market Survey® (PMMS®) in which the 30-year fixed-rate mortgage (FRM) averaged 4.84 percent with an average 0.7 point for the week ending May 20, 2010, down from last week when it averaged 4.93 percent. Last year at this time, the 30-year FRM averaged 4.82 percent. Once again, the 30-year FRM has not been lower since the week ending December 10, 2009, when it averaged 4.81 percent.The record low was 4.71% for the week of Dec 3, 2009 (series started in 1971).
The decline in mortgage rates is being driven by the decrease in the Treasury yield. The Ten Year treasury yield is currently at 3.26%.
 Click on graph for larger image in new window.
This graph shows the 30 year mortgage rates from the Freddie Mac survey, and the ten year Treasury yields, since January 2008.
The spread between the two series has widened slightly since the program ended.
From Bloomberg:
The difference between yields on the Fannie Mae securities and 10-year Treasuries widened 0.03 percentage point to 0.81 percentage point, Bloomberg data show. The spread reached 0.59 percentage point on March 29, the lowest on record ... The gap climbed to 0.86 percentage point May 6, after holding near that low in April.As an aside, the euro has strengthened a little and is close to 1.26 dollars today - up from 1.23 yesterday.
FDIC Q1 Banking Profile: 775 Problem Banks
by Calculated Risk on 5/20/2010 11:51:00 AM
The FDIC released the Q1 Quarterly Banking Profile today. The FDIC listed 775 banks with $431 billion in assets as “problem” banks in Q1, up from 702 banks with $403 billion in assets in Q4, and 305 banks and $220 billion in assets in Q1 of 2009.
Note: Not all problem banks will fail - and not all failures will be from the problem bank list - but this shows the problem is significant and still growing.
The Unofficial Problem Bank List shows 725 problem banks - and will continue to increase as more formal actions (or hints of pending actions) are released. Click on graph for larger image in new window.
This graph shows the number of FDIC insured "problem" banks since 1990.
All data is year end except Q1 2010.
The 775 problem banks reported at the end of Q1 is the highest since June 30, 1993, when the number of "problem" institutions totaled 793.
The FDIC is still on pace for 1,000 problem banks by the end of the year, although it also depends on how many banks are removed from the list.  The second graph shows the assets of "problem" banks since 1990.
The assets of problem banks are the highest since June 30, 1993 when the assets of "problem" institutions were $467 billion.
Philly Fed Index increases slightly in May, New orders index declines
by Calculated Risk on 5/20/2010 10:00:00 AM
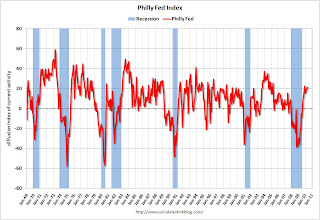
Here is the Philadelphia Fed Index released today: Business Outlook Survey.
The survey’s broadest measure of manufacturing conditions, the diffusion index of current activity, increased slightly from 20.2 in April to 21.4 this month. The index has now edged higher for four consecutive months and has remained positive for the ninth consecutive month (see Chart). Although still positive and suggesting growth, indexes for new orders and shipments showed a mixed pattern this month: The new orders index fell 8 points, while the shipments index increased 10 points. The current inventory index decreased 10 points and fell into negative territory, suggesting declines in inventories. Indexes for unfilled orders and delivery times were both negative this month, suggesting some weakening in activity from April.
emphasis added
 Click on graph for larger image in new window.
This graph shows the Philly index for the last 40 years.
The index has been positive for nine months now, after being negative or zero for 21 straight months.
The internals suggest manufacturing conditions are softening a little, as also suggested earlier by the New York Empire State manufacturing index.


