 RSS Feed
 by Calculated Risk on 5/13/2010 08:33:00 AM
Thursday, May 13, 2010
Weekly Initial Unemployment Claims at 444,000
The DOL reports on weekly unemployment insurance claims:
In the week ending May 8, the advance figure for seasonally adjusted initial claims was 444,000, a decrease of 4,000 from the previous week's revised figure of 448,000 [revised up from 444,000]. The 4-week moving average was 450,500, a decrease of 9,000 from the previous week's revised average of 459,500.
The advance number for seasonally adjusted insured unemployment during the week ending May 1 was 4,627,000, an increase of 12,000 from the preceding week's revised level of 4,615,000..
 Click on graph for larger image in new window.
This graph shows the 4-week moving average of weekly claims since 1971.
The four-week average of weekly unemployment claims decreased this week by 9,000 to 450,500.
The dashed line on the graph is the current 4-week average. The current level of 444,000 (and 4-week average of 450,500) is still high, and suggests ongoing weakness in the labor market.
Although declining over the last few weeks, the 4-week average first declined to this level at the end of December 2009, and has been at this level for almost five months.
Wednesday, May 12, 2010
NY Times: The New Poor
by Calculated Risk on 5/12/2010 11:52:00 PM
Catherine Rampell at the NY Times has a story about the long term unemployed, and the skills mismatch: In a Job Market Realignment, Some Workers Left Behind
Millions of workers who have already been unemployed for months, if not years, will most likely remain that way even as the overall job market continues to improve, economists say. The occupations they worked in, and the skills they currently possess, are never coming back in style. And the demand for new types of skills moves a lot more quickly than workers — especially older and less mobile workers — are able to retrain and gain those skills.A sad story ...
There is no easy policy solution for helping the people left behind. The usual unemployment measures — like jobless benefits and food stamps — can serve as temporary palliatives, but they cannot make workers’ skills relevant again.
EU Proposes more "interdependent" economic governance
by Calculated Risk on 5/12/2010 07:52:00 PM
From Stephen Castle at the NY Times: E.U. Plans Peer Review for Member States' Budgets
[T]he European Commission on Wednesday outlined ambitious proposals to give countries that use the euro a say over each other’s budget plans.From the EU: Mastering economic interdependence: Commission proposes reinforced economic governance in the EU
...
“Member states should have the courage to say whether they want an economic union because, if they don’t want that, it is better to forget monetary union altogether,” [European Commission president, José Manuel Barroso] said at a press conference in Brussels.
Among the ideas announced Wednesday was a plan to make the huge safety net for the euro that was decided on over the weekend a permanent crisis-resolution mechanism.
I'm not sure how this will go over.
Meanwhile in Spain from the Financial Times: Tough new Spanish austerity measures
José Luis Rodríguez Zapatero, Spain’s prime minister ... announced a surprise 5 per cent cut in civil service pay to accelerate cuts to the budget deficit.The EU €750 billion announced on Sunday just buys time. As part of that agreement, both Portugal and Spain agreed to reduce their deficits.
...
The measures should help bring the deficit down from 11.2 per cent of GDP in 2009 to just over 6 per cent in 2011.
excerpt with permission
Housing Stories and Market Update
by Calculated Risk on 5/12/2010 03:55:00 PM
A couple housing stories ... the first provides analysis from Barclays analysts that suggests distressed sales will stay elevated for some time. The second is from Diana Olick about house prices and the tax credit.
From Jon Prior at HousingWire: Shadow Inventory To Peak in Summer of 2010: Barclays
Barclays defines the shadow inventory of foreclosures as loans in 90-plus day delinquency or already in the foreclosure process. ...From Diana Olick at CNBC: Home Buyer Tax Credit Takes its Toll
The shadow inventory should reach its height in the summer in 2010 before falling gradually as the market absorbs 130,000 distressed properties per month, according to the report. Over the next three years, analysts forecast 4.7m distressed sales with 1.6m in 2010, another 1.6m in 2011 and 1.5m in 2012.
From one of our own CNBC producers, Andrea Mantia:Anybody surprised that asking prices have adjusted down?"I've been househunting for a few months now...we totally got caught up in the "tax credit frenzy"....thank God we took a deep breath and relaxed...EVERY SINGLE HOME we had our eye on dropped in price this week...and this is in Bergen Co (NJ) where prices weren't budging!"
 And on the stock market:
Click on graph for larger image in new window.
This graph is from Doug Short: "Four Bad Bears".
Note that the Great Depression crash is based on the DOW; the three others are for the S&P 500.
Ceridian-UCLA: Diesel fuel consumption index declines in April
by Calculated Risk on 5/12/2010 01:00:00 PM
This is the new UCLA Anderson Forecast and Ceridian Corporation index using real-time diesel fuel consumption data: Pulse of Commerce IndexTM
Press Release: Ceridian-UCLA Pulse of Commerce Index™ Drops 0.3 Percent in April
With the release of April’s figures, the Ceridian-UCLA Pulse of Commerce Index™ (PCI) by UCLA Anderson School of Management is showing flat, overall performance during the first four months of 2010. The PCI in April fell 0.3 percent, suggesting the economic recovery may have stalled, although an uptick in consumer spending could continue to drive a slow but steady recovery.
...
While the economy continues to climb year-over-year, the PCI indicates that expectations in the market for a robust recovery may be too optimistic. ...
“The latest PCI numbers are disappointing and cast considerable doubt on the strength of the recovery and the strength of GDP numbers for 2010,” said Ed Leamer, the PCI’s chief economist.
...
The PCI is based on an analysis of real-time diesel fuel consumption data ...
 Click on graph for larger image in new window.
This graph shows the index since January 1999.
Note: This index appears to lead Industrial Production (IP), but there is a significant amount of monthly noise. This is a new index and might be interesting to follow along with the Trucking and Railroad data.
Here is a video of Leamer's comments on the report.
Rail Traffic "Recovering at moderate pace"
by Calculated Risk on 5/12/2010 10:54:00 AM
From the Association of American Railroads: Rail Time Indicators. The AAR reports traffic in April 2010 was up 15.8% compared to April 2009 - although traffic was still 11.5% lower than in April 2008. Click on graph for larger image in new window.
This graph shows U.S. average weekly rail carloads. Traffic increased in all 19 major commodity categories YoY.
From AAR:
• U.S. freight railroads originated 1,179,029 carloads in April 2010, up 15.8% from April 2009 on a nonseasonally adjusted basis. That could very well be the highest year-over-year percentage increase for any month ever. It’s definitely the highest since at least January 1989, which is the first month for which we have comparable data.The graph above shows that rail traffic collapsed in November 2008, and now ten months into the recovery, traffic has only recovered half way. This is clearly not a "V-shaped" recovery - there is still a long way to go.
• Part of the big percentage gain in April 2010 reflects real traffic growth, but some of it also reflects the fact that April 2009 was a lousy month for U.S. freight railroads (see chart). May 2009 was even worse, so we can probably expect a very large year-over-year percentage increase in May 2010 too.
• Is this good news? Absolutely. But some caution is in order. Total U.S. rail carloads in April 2010 were still down 11.5% from April 2008, including in 17 of the 19 commodity categories. Generally speaking, recent U.S. rail traffic gains are consistent with an economy that is recovering at a moderate but not breathtaking pace.
excerpts with permission
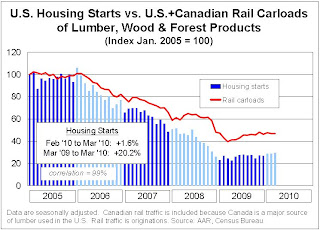 The second graph from the AAR report shows lumber rail traffic compared to U.S. housing starts.
From the AAR:
Happy days are not yet here again for homebuilders.That says it all!
Trade Deficit increases in March
by Calculated Risk on 5/12/2010 08:30:00 AM
The Census Bureau reports:
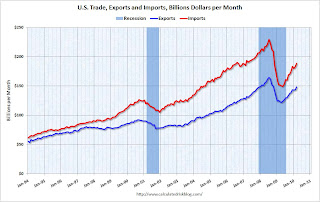
[T]otal March exports of $147.9 billion and imports of $188.3 billion resulted in a goods and services deficit of $40.4 billion, up from $39.4 billion in February, revised. March exports were $4.6 billion more than February exports of $143.3 billion. March imports were $5.6 billion more than February imports of $182.7 billion.
 Click on graph for larger image.
The first graph shows the monthly U.S. exports and imports in dollars through March 2010.
On a year-over-year basis, exports are up 20% and imports are up 24%. This is an easy comparison because of the collapse in trade at the end of 2008 and into early 2009.
The second graph shows the U.S. trade deficit, with and without petroleum, through March.
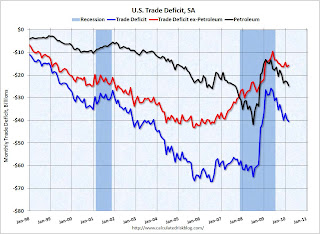 The blue line is the total deficit, and the black line is the petroleum deficit, and the red line is the trade deficit ex-petroleum products.
Import oil prices increased slightly to $73.89 in March - and are up 89% from the low of February 2009 (at $39.22). Oil import volumes increased sharply in March pushing up the value of imports.
Both imports and exports have been increasing sharply, but are still below the pre-financial crisis levels. Once again China and oil are the major contributors to the trade deficit.
MBA: Mortgage Purchase Applications Decrease
by Calculated Risk on 5/12/2010 07:21:00 AM
The MBA reports: Refinance Applications Surge, Purchase Applications Drop in Latest MBA Weekly Survey
The Market Composite Index, a measure of mortgage loan application volume, increased 3.9 percent on a seasonally adjusted basis from one week earlier. ...
The Refinance Index increased 14.8 percent from the previous week and the seasonally adjusted Purchase Index decreased 9.5 percent from one week earlier. ...
“The recent plunge in rates on US Treasury securities, due to a flight to quality as investors worldwide sought shelter from the Greek debt crisis, benefitted US mortgage borrowers last week. Rates on 30-year mortgages dropped to their lowest level since mid-March. As a result, refinance applications for conventional loans jumped, hitting their highest level in six weeks,” said Michael Fratantoni, MBA’s Vice President of Research and Economics. “In contrast, purchase applications fell almost 10 percent in the first week following the expiration of the homebuyer tax credit, as the tax credit likely pulled some sales into April that would otherwise have occurred in May or later.”
... The average contract interest rate for 30-year fixed-rate mortgages decreased to 4.96 percent from 5.02 percent, with points decreasing to 0.91 from 0.92 (including the origination fee) for 80 percent loan-to-value (LTV) ratio loans.
 Click on graph for larger image in new window.
This graph shows the MBA Purchase Index and four week moving average since 1990.
We expected the Purchase Index to increase in April - and then turn down in May since the tax credit expired at the end of April (buyers need to close by June 30th). The tax credit related peak in purchase activity is probably behind us.
As Fratantoni noted, the decline in mortgage rates (below 5% again on a 30 year fixed) resulted in a surge in refinance applications last week.
Tuesday, May 11, 2010
Shanghai Composite index Off 1%
by Calculated Risk on 5/11/2010 11:59:00 PM
 A follow up to a post two weeks ago ... keep an eye on the Shanghai index (in red). It appears China's economy is slowing.
Click on graph for larger image in new window.
This graph shows the Shanghai SSE Composite Index and the S&P 500 (in blue).
The SSE Composite Index is at 2,622.67 mid-day - down about 300 points from 2 weeks ago.
Jon Stewart explains Market Disruption
by Calculated Risk on 5/11/2010 09:17:00 PM
From Jon Stewart at the Daily Show: A Nightmare on Wall Street
| The Daily Show With Jon Stewart | Mon - Thurs 11p / 10c |
| A Nightmare on Wall Street | |


