 RSS Feed
 by Calculated Risk on 5/12/2010 01:00:00 PM
Wednesday, May 12, 2010
Ceridian-UCLA: Diesel fuel consumption index declines in April
This is the new UCLA Anderson Forecast and Ceridian Corporation index using real-time diesel fuel consumption data: Pulse of Commerce IndexTM
Press Release: Ceridian-UCLA Pulse of Commerce Index™ Drops 0.3 Percent in April
With the release of April’s figures, the Ceridian-UCLA Pulse of Commerce Index™ (PCI) by UCLA Anderson School of Management is showing flat, overall performance during the first four months of 2010. The PCI in April fell 0.3 percent, suggesting the economic recovery may have stalled, although an uptick in consumer spending could continue to drive a slow but steady recovery.
...
While the economy continues to climb year-over-year, the PCI indicates that expectations in the market for a robust recovery may be too optimistic. ...
“The latest PCI numbers are disappointing and cast considerable doubt on the strength of the recovery and the strength of GDP numbers for 2010,” said Ed Leamer, the PCI’s chief economist.
...
The PCI is based on an analysis of real-time diesel fuel consumption data ...
 Click on graph for larger image in new window.
This graph shows the index since January 1999.
Note: This index appears to lead Industrial Production (IP), but there is a significant amount of monthly noise. This is a new index and might be interesting to follow along with the Trucking and Railroad data.
Here is a video of Leamer's comments on the report.
Rail Traffic "Recovering at moderate pace"
by Calculated Risk on 5/12/2010 10:54:00 AM
From the Association of American Railroads: Rail Time Indicators. The AAR reports traffic in April 2010 was up 15.8% compared to April 2009 - although traffic was still 11.5% lower than in April 2008. Click on graph for larger image in new window.
This graph shows U.S. average weekly rail carloads. Traffic increased in all 19 major commodity categories YoY.
From AAR:
• U.S. freight railroads originated 1,179,029 carloads in April 2010, up 15.8% from April 2009 on a nonseasonally adjusted basis. That could very well be the highest year-over-year percentage increase for any month ever. It’s definitely the highest since at least January 1989, which is the first month for which we have comparable data.The graph above shows that rail traffic collapsed in November 2008, and now ten months into the recovery, traffic has only recovered half way. This is clearly not a "V-shaped" recovery - there is still a long way to go.
• Part of the big percentage gain in April 2010 reflects real traffic growth, but some of it also reflects the fact that April 2009 was a lousy month for U.S. freight railroads (see chart). May 2009 was even worse, so we can probably expect a very large year-over-year percentage increase in May 2010 too.
• Is this good news? Absolutely. But some caution is in order. Total U.S. rail carloads in April 2010 were still down 11.5% from April 2008, including in 17 of the 19 commodity categories. Generally speaking, recent U.S. rail traffic gains are consistent with an economy that is recovering at a moderate but not breathtaking pace.
excerpts with permission
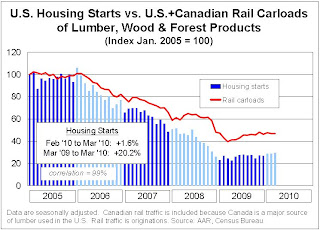 The second graph from the AAR report shows lumber rail traffic compared to U.S. housing starts.
From the AAR:
Happy days are not yet here again for homebuilders.That says it all!
Trade Deficit increases in March
by Calculated Risk on 5/12/2010 08:30:00 AM
The Census Bureau reports:
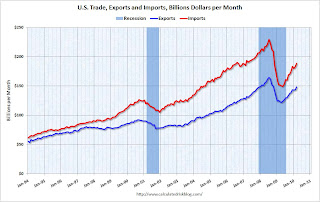
[T]otal March exports of $147.9 billion and imports of $188.3 billion resulted in a goods and services deficit of $40.4 billion, up from $39.4 billion in February, revised. March exports were $4.6 billion more than February exports of $143.3 billion. March imports were $5.6 billion more than February imports of $182.7 billion.
 Click on graph for larger image.
The first graph shows the monthly U.S. exports and imports in dollars through March 2010.
On a year-over-year basis, exports are up 20% and imports are up 24%. This is an easy comparison because of the collapse in trade at the end of 2008 and into early 2009.
The second graph shows the U.S. trade deficit, with and without petroleum, through March.
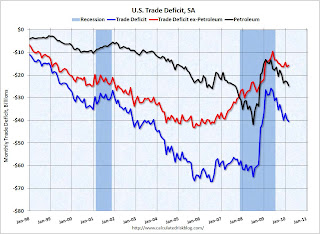 The blue line is the total deficit, and the black line is the petroleum deficit, and the red line is the trade deficit ex-petroleum products.
Import oil prices increased slightly to $73.89 in March - and are up 89% from the low of February 2009 (at $39.22). Oil import volumes increased sharply in March pushing up the value of imports.
Both imports and exports have been increasing sharply, but are still below the pre-financial crisis levels. Once again China and oil are the major contributors to the trade deficit.
MBA: Mortgage Purchase Applications Decrease
by Calculated Risk on 5/12/2010 07:21:00 AM
The MBA reports: Refinance Applications Surge, Purchase Applications Drop in Latest MBA Weekly Survey
The Market Composite Index, a measure of mortgage loan application volume, increased 3.9 percent on a seasonally adjusted basis from one week earlier. ...
The Refinance Index increased 14.8 percent from the previous week and the seasonally adjusted Purchase Index decreased 9.5 percent from one week earlier. ...
“The recent plunge in rates on US Treasury securities, due to a flight to quality as investors worldwide sought shelter from the Greek debt crisis, benefitted US mortgage borrowers last week. Rates on 30-year mortgages dropped to their lowest level since mid-March. As a result, refinance applications for conventional loans jumped, hitting their highest level in six weeks,” said Michael Fratantoni, MBA’s Vice President of Research and Economics. “In contrast, purchase applications fell almost 10 percent in the first week following the expiration of the homebuyer tax credit, as the tax credit likely pulled some sales into April that would otherwise have occurred in May or later.”
... The average contract interest rate for 30-year fixed-rate mortgages decreased to 4.96 percent from 5.02 percent, with points decreasing to 0.91 from 0.92 (including the origination fee) for 80 percent loan-to-value (LTV) ratio loans.
 Click on graph for larger image in new window.
This graph shows the MBA Purchase Index and four week moving average since 1990.
We expected the Purchase Index to increase in April - and then turn down in May since the tax credit expired at the end of April (buyers need to close by June 30th). The tax credit related peak in purchase activity is probably behind us.
As Fratantoni noted, the decline in mortgage rates (below 5% again on a 30 year fixed) resulted in a surge in refinance applications last week.
Tuesday, May 11, 2010
Shanghai Composite index Off 1%
by Calculated Risk on 5/11/2010 11:59:00 PM
 A follow up to a post two weeks ago ... keep an eye on the Shanghai index (in red). It appears China's economy is slowing.
Click on graph for larger image in new window.
This graph shows the Shanghai SSE Composite Index and the S&P 500 (in blue).
The SSE Composite Index is at 2,622.67 mid-day - down about 300 points from 2 weeks ago.
Jon Stewart explains Market Disruption
by Calculated Risk on 5/11/2010 09:17:00 PM
From Jon Stewart at the Daily Show: A Nightmare on Wall Street
| The Daily Show With Jon Stewart | Mon - Thurs 11p / 10c |
| A Nightmare on Wall Street | |
Distressed Sales: Sacramento as an Example, April Update
by Calculated Risk on 5/11/2010 05:17:00 PM
The Sacramento Association of REALTORS® is breaking out monthly resales by equity sales (conventional resales), and distressed sales (Short sales and REO sales), and I'm following this series as an example to see mix changes in a distressed area.  Click on graph for larger image in new window.
Here is the April data.
The Sacramento Association started breaking out REO sales in 2008, but they have only broken out short sales since June 2009 - so we almost have one year of data.
In April, 63% of all resales (single family homes and condos) were distressed sales.
Note: This data is not seasonally adjusted, although the decrease in sales in April is a little surprising because of the tax credit. The second graph shows the percent of REO, short sales and conventional sales. The percent of short sales is near the high set in December and will probably continue to increase later this year (2010 is the year of the short sale!).
The percent of REOs has been generally declining (seasonally there are a larger percentage of REOs in the winter).
Also total sales in April were off 9.1% compared to April 2009; the eleventh month in a row with declining YoY sales - even with the tax credit buying this year!
On financing, over 58 percent were either all cash (27.2%) or FHA loans (30.9%), suggesting most of the activity in distressed former bubble areas like Sacramento is first time home buyers using government-insured FHA loans, and investors paying cash.
SEC's Shapiro on Market Disruption: "unable to point to a single event" as cause
by Calculated Risk on 5/11/2010 03:16:00 PM
Testimony from SEC Chairman Mary Schapiro before the House Subcommittee on Capital Markets, Insurance and Government Sponsored Enterprises: Severe Market Disruption on May 6, 2010
This is an overview of what happened, what didn't happen (fat finger, unusual trading in Proctor & Gamble) and possible action to be taken (single stock trading curbs). On changes:
[W]e must consider the various types of “time out” mechanisms that can help maintain a fair and orderly market, both for the broad market and for individual stocks.
For example, we must ask whether the general, market-wide circuit breaker provisions that currently are on the books (none of which were triggered on May 6) need to be revised. I note that a vitally important element of the market-wide circuit breakers is that they apply across all stock and options trading venues and all venues for trading equity security-related futures, because markets for all equity security-related products are closely linked.
I believe that we also must consider the various types of time out mechanisms that can be applied to individual stocks. Although the prices of many stocks on May 6 declined in proportion with the broader market decline that occurred in securities and futures index products, the prices of many other individual stocks declined much, much more (before snapping back largely to the prices at which they were trading prior to the precipitous decline). At this point, the root cause of the sudden disappearance of liquidity in many stocks is unclear. ...
In addition to time out mechanisms, we will consider any other steps that potentially could prevent or help minimize the harm that occurred on May 6. These include: (1) exchange-level erroneous order filters; (2) “collars” on the prices at which market orders or aggressively priced limit orders can be executed; (3) limitations on the size of market orders or aggressively priced limit orders; and (4) eliminating the practice of displaying stub quotes that were never intended to be executed.
Senate Passes One-Time Fed Audit
by Calculated Risk on 5/11/2010 01:23:00 PM
From the NY Times: Senate Backs One-Time Audit of Fed’s Bailout Role
The Senate on Tuesday voted unanimously to require a one-time audit of the Federal Reserve’s emergency actions during and after the 2008 financial crisis as part of broad legislation overhauling the nation’s financial regulatory system.This is a one time audit (as opposed to the house bill), and would also require the Fed to release a list by Dec 1, 2010 of all of the institutions that received emergency assistance during the financial crisis.
BLS: Low Labor Turnover, More Hiring in March
by Calculated Risk on 5/11/2010 10:00:00 AM
From the BLS: Job Openings and Labor Turnover Summary
There were 2.7 million job openings on the last business day of March 2010, the U.S. Bureau of Labor Statistics reported today. The job openings rate was unchanged over the month at 2.0 percent. The hires rate (3.3 percent) was little changed, and the separations rate (3.1 percent) was unchanged in March.Note: The difference between JOLTS hires and separations is similar to the CES (payroll survey) net jobs headline numbers. The CES (Current Employment Statistics, payroll survey) is for positions, the CPS (Current Population Survey, commonly called the household survey) is for people.
The following graph shows job openings (purple), hires (blue), Total separations (include layoffs, discharges and quits) (red) and Layoff, Discharges and other (yellow) from the JOLTS.
Unfortunately this is a new series and only started in December 2000.
 Click on graph for larger image in new window.
Notice that hires (blue) and separations (red) are pretty close each month. This is the level of turnover each month. Right now about 4 million people lose their jobs each month, and a little over 4 million are hired (this is the labor turnover in the economy).
When the hires (blue line) is above total separations (as in March), the economy is adding net jobs, when the blue line is below total separations, the economy is losing net jobs.
According to the JOLTS report, there were 4.242 million hires in March (SA), and 4.016 million total separations, or 226 thousand net jobs gained. The comparable CES report showed a gain of 230 thousand jobs in March (after revision).
Layoffs and discharges have declined sharply from early 2009 - and that is a good sign.
Hiring picked up in March, although the number of job openings is still very low, as is the turnover rate.


