 RSS Feed
 by Calculated Risk on 4/29/2010 12:08:00 PM
Thursday, April 29, 2010
Hotel Occupancy increases 2.4% compared to same week in 2009
From HotelNewsNow.com: STR: Occupancy buoys chain scales' weekly results
Overall, the industry’s occupancy increased 2.4 percent to 60.7 percent, average daily rate dropped 2.4 percent to US$98.16, and RevPAR ended virtually flat with a 0.1-percent decrease to US$59.55.The following graph shows the occupancy rate by week and the 52 week rolling average since 2000.
 Click on graph for larger image in new window.
Notes: the scale doesn't start at zero to better show the change.
The graph shows the distinct seasonal pattern for the occupancy rate; higher in the summer because of leisure/vacation travel, and lower on certain holidays.
The occupancy rate is running slightly above 2009 - the worst year since the Depression - but still well below the normal level of close to 65% for this week.
Data Source: Smith Travel Research, Courtesy of HotelNewsNow.com
Chicago Fed: Economic Activity increased in March, Still below Trend
by Calculated Risk on 4/29/2010 09:40:00 AM
Note: This is a composite index based on a number of economic releases.
From the Chicago Fed: Index shows economic activity improved in March
Led by improvements in production- and employment-related indicators, the Chicago Fed National Activity Index increased to –0.07 in March, up from –0.44 in February. Three of the four broad categories of indicators that make up the index made positive contributions in March, while the consumption and housing category made the lone negative contribution.
The index’s three-month moving average, CFNAI-MA3, increased to –0.18 in March from –0.31 in February. March’s CFNAI-MA3 suggests that growth in national economic activity, while still below average, continues to improve.
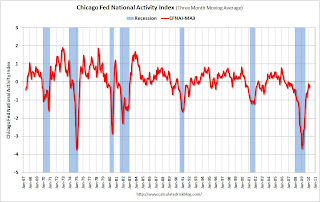 Click on table for larger image in new window.
This graph shows the Chicago Fed National Activity Index (three month moving average) since 1967. According to the Chicago Fed:
A zero value for the index indicates that the national economy is expanding at its historical trend rate of growth; negative values indicate below-average growth; and positive values indicate above-average growth.We are now about 9 months into the recovery, and growth by most indicators is still below trend.
Weekly Initial Unemployment Claims at 448,000
by Calculated Risk on 4/29/2010 08:30:00 AM
The DOL reports on weekly unemployment insurance claims:
In the week ending April 24, the advance figure for seasonally adjusted initial claims was 448,000, a decrease of 11,000 from the previous week's revised figure of 459,000. The 4-week moving average was 462,500, an increase of 1,500 from the previous week's revised average of 461,000.
...
The advance number for seasonally adjusted insured unemployment during the week ending April 17 was 4,645,000, a decrease of 18,000 from the preceding week's revised level of 4,663,000.
 Click on graph for larger image in new window.
This graph shows the 4-week moving average of weekly claims since 1971.
The four-week average of weekly unemployment claims increased this week by 1,500 to 462,500.
The dashed line on the graph is the current 4-week average. The current level of 448,000 (and 4-week average of 462,500) is still high, and suggests continuing weakness in the labor market.
The 4-week average first declined to this level in December 2009, and has essentially moved sideways for four months.
Wednesday, April 28, 2010
Report: FDIC Receives Bids on Puerto Rico Banks
by Calculated Risk on 4/28/2010 08:02:00 PM
From the WSJ: FDIC Auction of Lenders In Puerto Rico Draws Bids
At least four banks entered bids in a Federal Deposit Insurance Corp. auction ... A deadline passed Tuesday for interested parties to make offers for W Holding Co. Inc.'s Westernbank, R&G Financial Corp.'s R-G Premier Bank and EuroBancshares Inc.'s EuroBank. The FDIC held the auction in case any of the banks fail ...It is possible that one or more of the banks could raise capital and not be seized by the FDIC.
Also there was a rumor today of liquidity problems at one of the banks, and a Thursday seizure is possible. A local source tells me 'there are lots of "Dentists" in town for a Dental convention that doesn't appear to exist' ... nice cover!
How long is an "Extended Period"?
by Calculated Risk on 4/28/2010 04:55:00 PM
Catherine Rampell at the NY Times Economix asks: How Long Is an ‘Extended Period’?
Short answer: Longer than many analysts expect.
First we can compare to the "considerable period" language in 2003:
So "extended period" is probably 6+ months after the language changes - the next meeting is June 23rd and 24th, so the earliest rate hike would probably be in December (barring a significant pickup in inflation or rapid decline in unemployment).June 25, 2003: Lowered Rate to 1%, Unemployment Rate peaked at 6.3% August 12, 2003: “the Committee believes that policy accommodation can be maintained for a considerable period.” Unemployment rate at 6.1% December 9, 2003: Last statement using the phrase "considerable period". Unemployment rate at 5.7% January 28, 2004: the Committee believes that it can be patient in removing its policy accommodation. Unemployment Rate 5.7% May 4, 2004: “the Committee believes that policy accommodation can be removed at a pace that is likely to be measured.” Unemployment Rate 5.6% June 30, 2004: FOMC raised the Fed Funds rate 25 bps. Unemployment Rate 5.6%
Last September I wrote: Fed Funds and Unemployment Rate. Here is an excerpt with an updated graph:
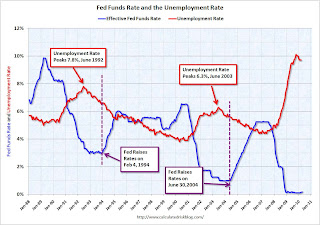 Click on graph for larger image in new window.
This graph shows the effective Fed Funds rate (Source: Federal Reserve) and the unemployment rate (source: BLS)
In the early '90s, the Fed waited more than a 1 1/2 years after the unemployment rate peaked before raising rates. The unemployment rate had fallen from 7.8% to 6.6% before the Fed raised rates.
Following the peak unemployment rate in 2003 of 6.3%, the Fed waited a year to raise rates. The unemployment rate had fallen to 5.6% in June 2004 before the Fed raised rates.
Although there are other considerations, if we assume the unemployment rate peaked in October 2009 - and add 18 months - then the Fed would probably wait until early 2011 to raise rates (at the earliest). My guess is the Fed will probably wait until the unemployment rate is closer to 9% before removing the "extended period" language, and it is unlikely they will raise rates until the unemployment rate is below 8%.
FOMC Statement: Economic activity has continued to strengthen
by Calculated Risk on 4/28/2010 02:15:00 PM
Information received since the Federal Open Market Committee met in March suggests that economic activity has continued to strengthen and that the labor market is beginning to improve. Growth in household spending has picked up recently but remains constrained by high unemployment, modest income growth, lower housing wealth, and tight credit. Business spending on equipment and software has risen significantly; however, investment in nonresidential structures is declining and employers remain reluctant to add to payrolls. Housing starts have edged up but remain at a depressed level. While bank lending continues to contract, financial market conditions remain supportive of economic growth. Although the pace of economic recovery is likely to be moderate for a time, the Committee anticipates a gradual return to higher levels of resource utilization in a context of price stability.The key language about rates stayed the same: "The Committee ... continues to anticipate that economic conditions, including low rates of resource utilization, subdued inflation trends, and stable inflation expectations, are likely to warrant exceptionally low levels of the federal funds rate for an extended period."
With substantial resource slack continuing to restrain cost pressures and longer-term inflation expectations stable, inflation is likely to be subdued for some time.
The Committee will maintain the target range for the federal funds rate at 0 to 1/4 percent and continues to anticipate that economic conditions, including low rates of resource utilization, subdued inflation trends, and stable inflation expectations, are likely to warrant exceptionally low levels of the federal funds rate for an extended period. The Committee will continue to monitor the economic outlook and financial developments and will employ its policy tools as necessary to promote economic recovery and price stability.
In light of improved functioning of financial markets, the Federal Reserve has closed all but one of the special liquidity facilities that it created to support markets during the crisis. The only remaining such program, the Term Asset-Backed Securities Loan Facility, is scheduled to close on June 30 for loans backed by new-issue commercial mortgage-backed securities; it closed on March 31 for loans backed by all other types of collateral.
Voting for the FOMC monetary policy action were: Ben S. Bernanke, Chairman; William C. Dudley, Vice Chairman; James Bullard; Elizabeth A. Duke; Donald L. Kohn; Sandra Pianalto; Eric S. Rosengren; Daniel K. Tarullo; and Kevin M. Warsh. Voting against the policy action was Thomas M. Hoenig, who believed that continuing to express the expectation of exceptionally low levels of the federal funds rate for an extended period was no longer warranted because it could lead to a build-up of future imbalances and increase risks to longer run macroeconomic and financial stability, while limiting the Committee’s flexibility to begin raising rates modestly.
The comments on the economy were slightly more positive.
On housing, here is the language over the last several statements:
Nov, 2009: "Activity in the housing sector has increased over recent months"
Dec, 2009: "The housing sector has shown some signs of improvement over recent months."
Jan, 2010: No comment.
March, 2010: housing starts have been flat at a depressed level
April, 2010: Housing starts have edged up but remain at a depressed level
At least this time the Fed didn't confuse an increase in housing activity with accomplishment!
S&P Downgrades Spain, outlook negative
by Calculated Risk on 4/28/2010 11:32:00 AM
S&P downgraded Spain to AA with a negative outlook based on a forecast for an extended period of sluggish growth.
From Bloomberg: S&P Downgrades Spain to ’AA’; Outlook Negative
Update: Quote from MarketWatch:
"We now believe that the Spanish economy's shift away from credit-fuelled economic growth is likely to result in a more protracted period of sluggish activity than we previously assumed," said Marko Mrsnik, an S&P credit analyst. "We now project that real GDP growth will average 0.7% annually in 2010-2016, versus our previous expectations of above 1% annually over this period,"Seven years of pain ... in Spain.
Yield on Greek two-year notes increases
by Calculated Risk on 4/28/2010 08:49:00 AM
From Bloomberg: Stocks Drop as Sovereign-Debt Crisis Spreads; Greek Bonds Slump
[Y]ields on Greek two-year notes jumped to a record 26 percent ... The yield soared almost 600 basis points at one stage today. Ireland’s jumped 90 basis points to 4.64 percent, Portugal’s increased 93 basis points to 6.24 percent and Spain’s rose 20 basis points to 2.26 percent.The IMF, ECB and German officials are meeting today. They have scheduled a press conference at 9 AM ET, to be followed by a press conference with German Chancellor Angela Merkel at 10:45 AM ET.
MBA: Mortgage Purchase Applications Increase
by Calculated Risk on 4/28/2010 08:19:00 AM
The MBA reports: Purchase Applications Increase, Refinance Applications Decline in Latest MBA Weekly Survey
The Market Composite Index, a measure of mortgage loan application volume decreased 2.9 percent on a seasonally adjusted basis from one week earlier. ...
The Refinance Index decreased 8.8 percent from the previous week, while the seasonally adjusted Purchase Index increased 7.4 percent from one week earlier and reached its highest level since October 2009. The increase in the purchase index was driven largely by the government purchase index, which increased 11.9 percent ...
“Purchase activity continues to increase as we approach the end of the homebuyer tax credit program,” said Michael Fratantoni, MBA's Vice President of Research and Economics. “Purchase applications were up almost 9 percent from a month ago, with a disproportionate share of the increase due to government purchase applications. Government applications for purchasing a home accounted for almost 49 percent of all purchase applications last week.”
The refinance share of mortgage activity decreased to 55.7 percent of total applications from 60.0 percent the previous week. The refinance share is at its lowest since August 2009 ...
The average contract interest rate for 30-year fixed-rate mortgages increased to 5.08 percent from 5.04 percent, with points decreasing to 0.91 from 0.98 (including the origination fee) for 80 percent loan-to-value (LTV) ratio loans.
 Click on graph for larger image in new window.
This graph shows the MBA Purchase Index and four week moving average since 1990.
This is the highest level for the purchase index since last October.
Tuesday, April 27, 2010
CEO: Wal-Mart's Customers "still feel the pressure"
by Calculated Risk on 4/27/2010 11:55:00 PM
From Ylan Q. Mui and Neil Irwin at the WaPo: Consumer confidence is up, but test looms
"Some would say there is a recovery taking place," [Wal-Mart chief executive Mike Duke] said during a meeting with Washington Post editors and reporters. "The lower-income and middle-income customers . . . they still feel the pressure."Don't hold your breath on housing and housing related jobs.
In addition, he said that the weak housing market continued to hold back the recovery in states such as Florida and Nevada. During the boom years, many jobs in those states were fueled by a surge of construction that has since abated, drying up the demand for labor.
"It will take housing to create some of those jobs," Duke said.
And a summary paragraph in the article:
With federal stimulus spending beginning to taper off over the second half of the year, the fragile recovery in the housing markets showing signs of petering out and exports unlikely to create the same boost over the next nine months that they did over the past nine months, it will be up to American consumers to pick up the slack and drive a continued expansion.The stimulus spending peaks in Q2, and then starts to decline in Q3. And the housing market will continue to struggle with the huge overhang of existing inventory and distressed properties. Still I don't expect a 'double dip', but a slowdown in the 2nd half of the year seems likely.


