 RSS Feed
 by Calculated Risk on 4/20/2010 11:05:00 AM
Tuesday, April 20, 2010
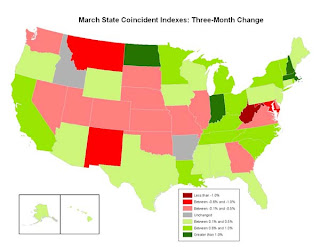
Philly Fed State Coincident Indicators
 Click on map for larger image.
Here is a map of the three month change in the Philly Fed state coincident indicators. Seventeen states are showing declining three month activity. The index increased in 31 states, and was unchanged in 2.
Here is the Philadelphia Fed state coincident index release for March.
In the past month, the indexes increased in 35 states, decreased in 10, and remained unchanged in five (Georgia, Illinois, South Dakota, Utah, and Vermont) for a one-month diffusion index of 50. Over the past three months, the indexes increased in 31 states, decreased in 17, and remained unchanged in two (Arkansas and Idaho) for a three-month diffusion index of 28.
 The second graph is of the monthly Philly Fed data of the number of states with one month increasing activity. Based on this indicator, most of the U.S. was in recession in early 2008.
The last time the index was higher was in December 2007.
Note: this graph includes states with minor increases (the Philly Fed lists as unchanged).
DOT: Vehicle Miles Driven Decline in February
by Calculated Risk on 4/20/2010 08:52:00 AM
The Department of Transportation (DOT) reported today that vehicle miles driven in February were down from February 2009:
Travel on all roads and streets changed by -2.9%(-6.3 billion vehicle miles) for February 2010 as compared with February 2009. Travel for the month is estimated to be 212.9 billion vehicle miles.
Cumulative Travel for 2010 changed by -2.3% (-10.1 billion vehicle miles).
 Click on graph for larger image in new window.
This graph shows the percent change from the same month of the previous year as reported by the DOT.
As the DOT noted, miles driven in February 2010 were down -2.9% compared to February 2009.
 The second graph shows the moving 12 month total of miles driven (to remove seasonality).
The moving 12 month total peaked in November 2007. The impact on vehicle miles of the gasoline shortages in the '70s are clear - in the late '70s and early '80s, it took 40 months before vehicle miles returned to the peak of April 1979.
Blame it on the snow - except this is the 2nd month in a row with a year-over-year decline in miles driven. If vehicle miles continues to decline on a year-over-year basis, it might suggest high gasoline prices are starting to impact the economy.
Monday, April 19, 2010
Greece: Bond spreads widen as Bundesbank President says Greece may need more aid
by Calculated Risk on 4/19/2010 07:21:00 PM
An update on Greece: The IMF team was delayed arriving in Greece because of the ash from the Iceland volcano, meanwhile the Bundesbank president was quoted as saying Greece may need more aid.
Also the German Finance Minister was quoted in Der Spiegel: "We cannot allow the bankruptcy of a euro member state like Greece to turn into a second Lehman Brothers."
From the NY Times: Greek Debt Unsettles Bond Market
Yields on Greek bonds pushed to fresh highs on Monday ... as investors continued to worry about the country’s near-term ability to finance its debt. ... The yield on benchmark 10-year Greek government bonds closed in Europe at 7.63 percent — the highest since Greece joined the euro. That widened the spread, or difference, with equivalent German bonds to 4.55 percentage points.From Bloomberg: Weber Said to Tell German Lawmakers Greece May Need More Aid
Bundesbank President Axel Weber told German lawmakers that Greece may need more aid than the 30 billion euros ($40 billion) promised by the European Union as the government in Athens struggles to push through planned spending cuts, two people present at the briefing said.An interview with German Finance Minister Wolfgang Schäuble in Der Speigel: 'We Cannot Allow Greece to Turn into a Second Lehman Brothers'
Schäuble: [W]e have experienced a financial crisis from which we in Europe must draw a clear lesson: We cannot allow the bankruptcy of a euro member state like Greece to turn into a second Lehman Brothers.
SPIEGEL: You are exaggerating. In past years, it's happened again and again that a country couldn't pay its debts, and yet that hasn't led to a collapse of the global financial system. Why should this be different in Greece's case?
Schäuble: Because Greece is a member of the European monetary union. Greece's debts are all denominated in euros, but it isn't clear who holds how much of those debts. For that reason, the consequences of a national bankruptcy would be incalculable. Greece is just as systemically important as a major bank.
Fannie Mae updates "Waiting Period" following Pre-Foreclosure Events
by Calculated Risk on 4/19/2010 03:27:00 PM
From Austin Kilgore at HousingWire: Fannie Shortens Wait for Some Distressed Borrowers to Get New Loans
Fannie Mae announced it is reducing the wait time for some borrowers between when they complete a short sale or deed-in-lieu of foreclosure transaction and when they can obtain a new mortgage.Here is the update from Fannie Mae. For other loans (mostly higher risk loans), the period has been increased to seven years (per the eligibility matrix).
Previously, a borrower was required to wait four years before getting a new mortgage, or two years if their home sold in a short sale. Under the new guidelines, a borrower that previously completed a deed-in-lieu of foreclosure transaction can get a new mortgage in two years, provided the borrower has a 20% down payment.
If the borrower has a 10% down payment, the wait period is still four years.
A couple notes: Several reports are mentioning the shorter waiting period (2 years instead of 4 years), but that is just for borrowers who put 20% down. This update also makes the policy consistent for short sales and deed-in-lieu of foreclosure transactions - and for the first time explicitly mentions short sales (since these are becoming much more common).
Moody's: CRE Prices Decline 2.6% in February
by Calculated Risk on 4/19/2010 11:43:00 AM
Moody's reported this morning that the Moody’s/REAL All Property Type Aggregate Index declined 2.6% in February. This is a repeat sales measure of commercial real estate prices.
Moody's noted that the share of distressed sales has increased sharply. In 2008 distressed sales were only 4% of all sales, in 2009 nearly 20% of all the repeat sales transaction were classified as distressed. In February 2010, the percent of distressed sales jumped to a record 32%.
Below is a comparison of the Moodys/REAL Commercial Property Price Index (CPPI) and the Case-Shiller composite 20 index.
Notes: Beware of the "Real" in the title - this index is not inflation adjusted. Moody's CRE price index is a repeat sales index like Case-Shiller - but there are far fewer commercial sales - and that can impact prices. Click on graph for larger image in new window.
CRE prices only go back to December 2000.
The Case-Shiller Composite 20 residential index is in blue (with Dec 2000 set to 1.0 to line up the indexes).
Commercial real estate values are now down 25.8% over the last year, and down 41.8% from the peak in August 2007.
More Housing Bust and Construction Employment
by Calculated Risk on 4/19/2010 10:58:00 AM
Back in 2006, we discussed that the hardest hit areas, in the then coming housing bust, would be the communities most dependent on residential construction employment. Last week, I posted a follow up focused on California: The Housing Bust and Construction Employment
Zach Fox at SNL Interactive writes about the impact on Cape Coral, a construction dependent community in Florida: A generation of wealth lost
With so little commercial space in Cape Coral, the metro area became especially reliant on construction for employment. By June 2006, 16.8% of all jobs in the metro area came from the mining, logging and construction sector (the Bureau of Labor Statistics does not break out construction jobs for the Cape Coral-Fort Myers, MSA). By contrast, the national average reliance on the sector that month was 6.3%. Even the notoriously growth-dependant Phoenix-Mesa-Glendale, Ariz., MSA (the U.S. Office of Management and Budget changed the name of the MSA from Phoenix-Mesa-Scottsdale, Ariz., in December 2009), was far less reliant on development, with 10.1% of its jobs coming from mining, logging and construction in June 2006.
"I can remember driving up the west [Florida] coast and saying, 'Where are all these people going to work?'" [Andrea Heuson, a professor of finance at the University of Miami] said.

Unsurprisingly, with construction jobs falling off a cliff, Cape Coral-Fort Myers has posted a towering unemployment rate, hitting 13.9% in February, according to a preliminary report; the national average was 10.4% in February, non-seasonally adjusted. Whatever housing market metric one picks, Cape Coral-Fort Myers is near the top — in a bad way. The metro area has seen prices fall 49.5% from the 2006 first quarter through the 2009 fourth quarter, larger than the 42.0% drop posted by California's infamous Inland Empire and the 49.3% decline seen in Nevada's eviscerated Las Vegas-Paradise MSA, according to the FHFA's all-transactions index. With unemployment shooting up and prices tumbling, it comes as little surprise that Cape Coral-Fort Myers is also one of the nation's most foreclosure-prone neighborhoods. The metro posted the second-highest foreclosure rate of any metro area in the nation during 2009, according to RealtyTrac.This was so easy to predict ...
The SEC and other Banks
by Calculated Risk on 4/19/2010 08:42:00 AM
To follow up on the stories from last night, the Financial Times reported in January: SEC subpoenas big banks over CDOs
The Securities and Exchange Commission sent subpoenas [in December 2009] to banks including Goldman Sachs, Credit Suisse, Citigroup, Bank of America/Merrill Lynch, Deutsche Bank, UBS, Morgan Stanley and Barclays Capital, these people said. Requests for information were also made by the Financial Industry Regulatory Authority, which oversees broker-dealers.So that is a starting list.
The regulators are seeking information about the sale and marketing of so-called synthetic collateralised debt obligations during the financial crisis.
except with permission
And a key story from Jesse Eisinger and Jake Bernstein at ProPublica: The Magnetar Trade: How One Hedge Fund Helped Keep the Bubble Going
Sunday, April 18, 2010
Goldman Sachs, the SEC and Countrywide
by Calculated Risk on 4/18/2010 10:03:00 PM
Several articles tonight ...
From Gretchen Morgenson and Landon Thomas Jr. at the NY Timmes: A Glare on Goldman, From U.S. and Beyond
“We request that S.E.C., with all due haste, pursue investigations into the remaining 24 Abacus transactions for securities fraud, evaluate the extent of any receipt, by Goldman Sachs, of fraudulently generated A.I.G.-issued credit default swap payments, and vigorously pursue the recovery of such payments on behalf of the U.S. taxpayer,” the [Representatives Elijah E. Cummings and Peter DeFazio] wrote to Mary L. Schapiro, the head of the [S.E.C.], in a letter dated April 19. Mr. Cummings and Mr. DeFazio are still gathering signatures from other members of Congress to add to their letter, so it has not yet been sent.From Trish Regan at CNBC: Pursuing Banking Fraud is 'Top Priority': SEC'S Khuzami
In the Securities and Exchange Commission's first public statement since its press conference announcing charges against Goldman Sachs on Friday, S.E.C. Enforcement Director Robert Khuzami told CNBC, "We have brought and will continue to pursue cases involving the products and practices related to the financial crisis." ... a wide range of cases are currently being investigated.From Carrick Mollenkamp, Serena Ng, Scott Patterson, and Gergory Zuckerman the WSJ: SEC Investigating Other Soured Deals
The Securities and Exchange Commission ... is investigating whether other mortgage deals arranged by some of Wall Street's biggest firms may have crossed the line into misleading investors.From Edward Wyatt at the NY Times: S.E.C. Puts Wall St. on Notice
In the last few years, the Securities and Exchange Commission seemed like the cop in the doughnut shop, sitting idly by while the likes of Lehman Brothers and Bernard L. Madoff ran amok.And from John Emshwiller at the WSJ: Countrywide Probe Shows Signs of Life
...
In interviews this weekend, Mary L. Schapiro, the commission’s chairwoman, and Robert Khuzami, its new director of enforcement, said the agency was stepping up both its rule-making and its investigations in the wake of the financial crisis.
Federal criminal investigators looking into the collapse of Countrywide Financial Corp. have been calling witnesses before a grand jury, say people familiar with the matter. Such a step suggests that the investigation of the one-time mortgage giant, which has been continuing for about two years, could be moving closer to a resolution.
Ryan Avent on the Minsky Conference and Financial Reform
by Calculated Risk on 4/18/2010 07:00:00 PM
Ryan Avent discusses the Minsky Conference in The Economist: First, define the problem
I HAVE been meaning to summarise my thoughts on financial regulatory reform in the wake of the Hyman Minsky conference on same. I have to say, it has left me with a sense of resigned cycnicism.I think we need an explanation of how the financial reform would have caught the bubble earlier.
...
On to more specific thoughts. The Federal Reserve is very unhappy with the prospect of losing its regulatory authority over all but the largest financial institutions. ... I found this all to be exasperating. None of the attending presidents adequately explained how a Fed that completely failed to prevent dangerous consolidation before the crisis should now be viewed as a credible enemy of too-big-to-fail after the crisis. None of the attending presidents provided tangible evidence of internal changes designed to make the Fed a more credible regulator. Each was asked about the odd disconnect between the Fed's pre-crisis actions and its post-crisis rhetoric, and each responded by saying little more than "we've learned our lesson, now trust us".... If it believes it can regulate most effectively, [the Fed] should be explicit about how it might do that. ... If the incentives were in place to turn a blind eye before, and little has changed, then "we've learned our lesson" will not make for a sustainable model of competent regulation.
... several of the conference's speakers made the point that regulators had about 90% of the tools they needed to prevent a serious crisis before the crisis hit. They just didn't use them. A lack of needed tools is a convenient excuse for everyone who failed to do their job before the crash, which is everyone, and so you see the reform debate focusing on which new rules or institutions or regulators or authorities are needed that weren't previously around. In some cases, the new tools argument makes sense, but most of the time the real problem was that the people in charge were unwilling to do their jobs.
Weekly Summary and a Look Ahead
by Calculated Risk on 4/18/2010 11:50:00 AM
There will be two key housing reports released at the end of this week: Existing Home sales on Thursday and New Home sales on Friday.
Early in the week, the LoanPerformance house price index (for February) will be released. This will probably show further price declines in February (not seasonally adjusted). Other reports that will be released this week include the Moodys/REAL Commercial Property Price Index (for February), DOTs Vehicle Miles Driven for February, and the DataQuick's Q1 Notice of Defaults (NODs) report for California.
On Monday, the Conference Board's index of leading indicators for March will be released at 10 AM.
On Wednesday, the AIA's Architecture Billings Index for March will be released (a leading indicator for commercial real estate). Also the weekly MBA Mortgage Purchase Applications index will be released.
On Thursday the closely watched initial weekly unemployment claims will be released at 8:30 AM. The consensus is for a decline to 460K this week from 484K last week. The NAR will release Existing Home sales for March at 10 AM. The consensus is for an increase in sales to 5.25 million (SAAR) from 5.02 million (SAAR) in February. The FHFA house price index will be released on Thursday (although Case-Shiller and LoanPerformance are probably the most followed).
On Friday, March Durable Goods Orders will be released at 8:30 AM. The consensus is for a 0.4% increase. New Home sales for March will be released at 10 AM, and consensus is for an increase to 330 thousand (SAAR) from the record low 308 thousand SAAR in February.
Also on Friday the FDIC might close several more banks ...
And a summary of last week:
 Click on graph for larger image in new window.
Total housing starts were at 626 thousand (SAAR) in March, up 1.6% from the revised February rate, and up 30% from the all time record low in April 2009 of 479 thousand (the lowest level since the Census Bureau began tracking housing starts in 1959).
Single-family starts were at 531 thousand (SAAR) in March, down 0.9% from the revised February rate, and 49% above the record low in January and February 2009 (357 thousand).
Here is the Census Bureau report on housing Permits, Starts and Completions
 This graph shows the builder confidence index from the National Association of Home Builders (NAHB).
The housing market index (HMI) was at 19 in April. This is an increase from 15 in March. The increase this month was driven by traffic of prospective buyers and current sales - and this was the last month that buyers can take advantage of the housing tax credit - so this increase was no surprise.
Note: any number under 50 indicates that more builders view sales conditions as poor than good.
From the Fed: Industrial production and Capacity Utilization
 This graph shows Capacity Utilization. This series is up 7.2% from the record low set in June 2009 (the series starts in 1967).
 Capacity utilization at 73.2% is still far below normal - and 9.1% below the the pre-recession levels of 80.5% in November 2007.
Note: y-axis doesn't start at zero to better show the change.
Also - this is the highest level for industrial production since Dec 2008, but production is still 9.6% below the pre-recession levels at the end of 2007.
On a monthly basis, retail sales increased 1.6% from February to March (seasonally adjusted, after revisions), and sales were up 7.6% from March 2009 (easy comparison).
 This graph shows retail sales since 1992. This is monthly retail sales, seasonally adjusted (total and ex-gasoline).
The red line shows retail sales ex-gasoline and shows the increase in final demand ex-gasoline has been sluggish.
Retail sales are up 8.3% from the bottom, but still off 4.4% from the peak.

The Census Bureau reports:
[T]otal February exports of $143.2 billion and imports of $182.9 billion resulted in a goods and services deficit of $39.7 billion, up from $37.0 billion in January, revised.The graph shows the monthly U.S. exports and imports in dollars through February 2010.
On a year-over-year basis, exports are up 14% and imports are up 20%. This is an easy comparison because of the collapse in trade at the end of 2008 and into early 2009. This is the first time since late 2008 that imports are up a greater percentage than exports on a YoY basis as export growth appears to have slowed.
From the BLS: Regional and State Employment and Unemployment Summary
 This graph shows the high and low unemployment rates for each state (and D.C.) since 1976. The red bar is the current unemployment rate (sorted by the current unemployment rate).
Fifteen states and D.C. now have double digit unemployment rates. New Jersey and Indiana are close.
Four states and set new series record highs: California, Florida, Nevada and Georgia.
Best wishes to all.


