 RSS Feed
 by Calculated Risk on 4/14/2010 01:59:00 PM
Wednesday, April 14, 2010
Fed's Beige Book: Economic activity increased "somewhat"
From the Federal Reserve: Beige book
Overall economic activity increased somewhat since the last report across all Federal Reserve Districts except St. Louis, which reported "softened" economic conditions. Districts generally reported increases in retail sales and vehicle sales.On Real Estate:
Residential real estate activity increased, albeit from low levels, in most Districts, with the exceptions of St. Louis, where it was mixed, and San Francisco, where it was flat. Contacts in Philadelphia, Cleveland and Kansas City expressed concern about whether sales would continue to grow after the expiration of the first-time home buyer tax credit. New York, Kansas City, Dallas and San Francisco noted sluggish sales for high-end homes. Home prices were stable across most Districts, but decreased in parts of the New York and Atlanta Districts. Residential construction activity increased slightly in New York, Atlanta, St. Louis, Minneapolis and Dallas, but remained weak in Cleveland, Chicago and San Francisco.
Commercial real estate activity was slow across the nation. Notable exceptions were Richmond, which saw an uptick in commercial leasing, and Dallas, where the sector was mixed and might be nearing bottom. In Boston, leasing activity consists largely of renewals, with many renewing tenants leasing less space. Manhattan Class A office rents were down 20 percent to 25 percent year over year. Contacts in Philadelphia, Richmond, Kansas City and Dallas expressed concern that lease concessions from landlords were putting downward pressure on rents. Commercial construction continued to be weak in most Districts. Cleveland saw some development in the energy and industrial segments.
San Diego: A "Surge" in Foreclosures
by Calculated Risk on 4/14/2010 11:39:00 AM
From Eric Wolff at the North County Times: Major lender signals surge in local foreclosures
Bank of America ... ramped up its foreclosure activity in March, sending hundreds of letters warning delinquent borrowers in the region that it could sell their homes at auction in as little as three weeks ... The bank said the increased activity was a natural consequence of borrowers running out of options.This fits with what Irvine Renter reported last month on the Irvine Housing Blog.
Analysts and real estate agents said the moves ... could signal a final reckoning for homeowners who have been protected by government programs for months or even years.
...
The notices went to 230 homeowners in North San Diego County, a 69 percent increase from February, and to 391 owners in Southwest Riverside County, up 67 percent from February.
By comparison, in March 2009, ReconTrust sent a total of 31 such letters to both regions combined
...
"We have reported recently that we anticipate a rise in foreclosure activity through the coming months as homeowners are unable to qualify for loan modifications, fall out of modification programs or go into delinquency due to the ongoing stress in the economy," [Richard Simon, a Bank of America spokesman] said.
Retail Sales increase sharply in March
by Calculated Risk on 4/14/2010 08:44:00 AM
On a monthly basis, retail sales increased 1.6% from February to March (seasonally adjusted, after revisions), and sales were up 7.6% from March 2009 (easy comparison).  Click on graph for larger image in new window.
This graph shows retail sales since 1992. This is monthly retail sales, seasonally adjusted (total and ex-gasoline).
The red line shows retail sales ex-gasoline and shows the increase in final demand ex-gasoline has been sluggish.
Retail sales are up 8.3% from the bottom, but still off 4.4% from the peak. The second graph shows the year-over-year change in retail sales (ex-gasoline) since 1993.
Retail sales ex-gasoline increased by 5.3% on a YoY basis (7.6% for all retail sales). The year-over-year comparisons are easy now since retail sales collapsed in late 2008. Retail sales bottomed in December 2008.
Here is the Census Bureau report:
The U.S. Census Bureau announced today that advance estimates of U.S. retail and food services sales for March, adjusted for seasonal variation and holiday and trading-day differences, but not for price changes, were $363.2 billion, an increase of 1.6 percent (±0.5%) from the previous month and 7.6 percent (±0.5%) above March 2009. Total sales for the January through March 2010 period were up 5.5 percent (±0.3%) from the same period a year ago. The January to February 2010 percent change was revised from +0.3 percent (±0.5%)* to +0.5 percent (±0.3%).This is a strong retail sales report.
MBA: Mortgage Applications Decrease as FHA Insurance Rates Increase
by Calculated Risk on 4/14/2010 07:51:00 AM
The MBA reports: Mortgage Applications Decrease in Latest MBA Weekly Survey
The Market Composite Index, a measure of mortgage loan application volume, decreased 9.6 percent on a seasonally adjusted basis from one week earlier. ...
"Applications for government mortgages dropped substantially last week, following the implementation of an increase in FHA mortgage insurance premiums," said Mike Fratantoni, MBA's Vice President of Research and Economics. "Applications for conventional mortgages also dropped last week, with refinance application volume continuing to drop following last week's jump in rates.”
The Refinance Index decreased 9.0 percent from the previous week, marking the index’s fifth consecutive decline. The seasonally adjusted Purchase Index decreased 10.5 percent from one week earlier. ...
The refinance share of mortgage activity increased to 58.9 percent of total applications from 58.7 percent the previous week. ...
The average contract interest rate for 30-year fixed-rate mortgages decreased to 5.17 percent from 5.31 percent, with points increasing to 0.91 from 0.64 (including the origination fee) for 80 percent loan-to-value (LTV) ratio loans.
 Click on graph for larger image in new window.
This graph shows the MBA Purchase Index and four week moving average since 1990.
If there is any increase in activity because of the expiration of the tax credit, it will probably be this month. I expect any increase this year to be less than the increase last year ...
Tuesday, April 13, 2010
Household Debt as a Percent of GDP
by Calculated Risk on 4/13/2010 07:37:00 PM
From Neil Irwin at the WaPo: Economic data don't point to boom times just yet
"There have always been Wall Street economists wanting to cheerlead the recovery, and quick to jump on any piece of news showing a great boom is around the corner," said Kenneth Rogoff, a Harvard economist. "The data so far are more consistent with a very moderate recovery."
There are a number of reasons that would be the case. American households are trying to reduce debt to stabilize finances. But they are doing so slowly, with total household debt at 94 percent of gross domestic product in the fourth quarter down just slightly from 96 percent when the recession began in late 2007.
...
"When you have a recession that's amplified by a deep financial crisis, the recovery is slower and more painful, much akin to recovering from a heart attack," said Rogoff ... "It just takes time. If you look at a typical recovery, we would be growing at 7 or 8 percent by now given the depth of our fall."
 Click on graph for larger image.
This graph, based on the Federal Reserve Flow of Funds data, shows household debt as a percent of GDP through Q4 2009 (note: I removed a few non-profit categories).
Note that the household debt problem is mostly a mortgage debt problem. Mortgage debt as a percent of GDP started really picking up in 2001 and 2002 and continued to increase sharply through 2006.
There was also a sharp increase in mortgage debt in the late '80s. That was partially associated with Tax Reform Act of 1986 that only allowed mortgage debt to be tax deductible, and excluded interest on all personal loans including credit card debt. There was also a smaller housing bubble in the late '80s that was associated with the increase in mortgage debt.
 The second graph shows the annual change in the percent of household mortgage debt.
 There was some increase in the late '90s associated with the booming economy and stock bubble wealth effect. But the real boom in mortgage debt started in the 2nd half of 2001 - and continued through 2006. This rapid increase in mortgage debt should have been a red flag for regulators.
Finally, on Rogoff's comment about "Wall Street economists wanting to cheerlead the recovery", there is an old saying on Wall Street for analysts: Bearish equals unemployed. Of course they are cheerleading!
DataQuick: SoCal house sales increase in March, "propped up" with FHA-insured loans
by Calculated Risk on 4/13/2010 03:06:00 PM
From DataQuick: More Incremental Gains for Southland Real Estate Market
A total of 20,476 new and resale homes sold in Los Angeles, Riverside, San Diego, Ventura, San Bernardino and Orange counties last month. That was up 33.3 percent from 15,359 in February, and up 5.0 percent from 19,506 in March 2009, according to MDA DataQuick of San Diego.The SoCal market is mostly first time homebuyers using FHA-insured loans, and investors paying cash. Note that foreclosure resales don't include short sales - so the 38.4% foreclosures is not all of the distressed sales (probably over 50% in SoCal).
...
“It’s a reflection of just how grim things got, that we’ve now had almost two years of sales gains and we’re still 18 percent below the sales average. ...” said John Walsh, MDA DataQuick president.
...
Foreclosure resales accounted for 38.4 percent of the resale market last month, down from 42.3 percent in February, and down from 54.8 percent a year ago. The all-time high was in February 2009 at 56.7 percent.
...
Meanwhile, Uncle Sam continues to prop up lending for many low-to mid-priced homes. Government-insured FHA loans, a popular choice among first-time buyers, accounted for 38.6 percent of all mortgages used to purchase Southland homes in March.
Absentee buyers – mostly investors and some second-home purchasers – bought 21.3 percent of the homes sold in March.
Buyers who appeared to have paid all cash – meaning there was no indication that a corresponding purchase loan was recorded – accounted for 27.1 percent of March sales. In February it was a revised 30.0 percent – an all-time high. The 22-year monthly average for Southland homes purchased with cash is 13.8 percent.
Kirsten Grind Blogging the WaMu Hearing
by Calculated Risk on 4/13/2010 01:06:00 PM
Kirsten Grind at the Puget Sound Business Journal is blogging from the WaMu hearing. How about this quote?
"My opinion is the OTS examiner in charge during the period of time I was there did an excellent job of finding and raising issues. Likewise, I found good performance from the FDIC examiner in charge. What I can't explain is why the superior in the agencies didn't take a tougher tone with banks, given the degree of negative findings. My experience with the OTS and OCC (Office of Comptroller of the Currency, another federal bank regulator) was completely different, so there seemed to be a tolerance there or political influence of senior management of those agencies that prevented them from taking more active stances — I mean, putting banks under letters of agreement and forcing change."We have seen this over and over. Every time the inspector general's office issues a report on a failed bank, the field examiners had correctly identified the problems - usually going back to 2003 or so - but no further action was taken.
James Vanasek, who was the former chief risk and credit officer of WaMu from 1999 to 2005
Vanasek is arguing this was possibly because of "political influence of senior management of those agencies" - the political appointees in charge. I've heard the same thing from examiners.
Ceridian-UCLA: Diesel fuel consumption increases in March
by Calculated Risk on 4/13/2010 11:43:00 AM
This is the new UCLA Anderson Forecast and Ceridian Corporation index using real-time diesel fuel consumption data: Pulse of Commerce IndexTM
Press Release: March PCI Increase Indicates U.S. Economy on 4 Percent Growth Track
Ceridian-UCLA Pulse of Commerce Index™ (PCI) by UCLA Anderson School of Management staged a healthy comeback in March, with the PCI growing by 1 percent, making up for February’s snowstorm-induced decline of 0.7 percent. The adjusted index grew from 107.4 to 108.5, continuing its climb from a recessionary low of 100.7 in June 2009. ... [T]he March PCI shows growth over the prior year period for the fourth consecutive month. This follows twenty-two consecutive months of year-over-year declines experienced prior to December 2009.
...
“The good news in March is that the economy is still recovering at a pace that should support job growth, although unfortunately not at a pace that will drive rapid improvement in the unemployment rate. GDP needs to grow at a 5 to 6 percent rate to drive meaningful change in unemployment,” said Ed Leamer, chief economist for the PCI.
For the first quarter of 2010, the PCI grew at an annualized rate of 9.7 percent, a solid gain but not enough to offset the declines of 14 percent and 16 percent suffered in the fourth quarter of 2008 and the first quarter of 2009. “In other words, we fell into the recession much more rapidly than we are climbing out of it,” Leamer said.
 Click on graph for larger image in new window.
This graph shows the index since January 1999 (monthly and 3 month average). There is significant variability month to month.
Note: This index appears to lead Industrial Production (IP), but there is a significant amount of monthly noise.
This is a new index and might be interesting to follow along with the Trucking and Railroad data.
Trade Deficit increases in February
by Calculated Risk on 4/13/2010 08:54:00 AM
The Census Bureau reports:
[T]otal February exports of $143.2 billion and imports of $182.9 billion resulted in a goods and services deficit of $39.7 billion, up from $37.0 billion in January, revised.
 Click on graph for larger image.
The first graph shows the monthly U.S. exports and imports in dollars through February 2010.
On a year-over-year basis, exports are up 14% and imports are up 20%. This is an easy comparison because of the collapse in trade at the end of 2008 and into early 2009. This is the first time since late 2008 that imports are up a greater percentage than imports on a YoY basis as export growth appears to have slowed.
The second graph shows the U.S. trade deficit, with and without petroleum, through February.
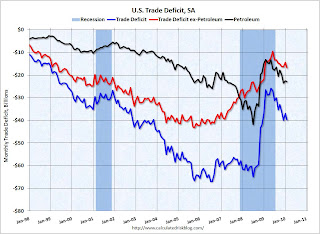 The blue line is the total deficit, and the black line is the petroleum deficit, and the red line is the trade deficit ex-petroleum products.
Import oil prices decreased slightly to $72.92 in February - but are up 86% from the low of one year ago in February 2009 (at $39.22). Oil import volumes declined in February.
In general trade has been increasing, although both imports and exports are still below the pre-financial crisis levels. Exports boosted the economy over the last year, however it now appears that export growth has slowed. Imports are still increasing even with the lower oil deficit in February.
Small Business Index Declines in March
by Calculated Risk on 4/13/2010 08:18:00 AM
From the National Federation of Independent Business: Small Business Optimism Declines in March
The National Federation of Independent Business Index of Small Business Optimism lost 1.2 points in March, falling to 86.8. The persistence of index readings below 90 is unprecedented in survey history.
“The March reading is very low and headed in the wrong direction,” said Bill Dunkelberg, NFIB chief economist. “Something isn’t sitting well with small business owners. Poor sales and uncertainty continue to overwhelm any other good news about the economy.”
...
After a devastating period of employment reductions, employment change per firm hit the “zero line” in March. .... While actual job reductions may have halted, plans to create new jobs remain weak. ... Only nine percent (seasonally adjusted) reported unfilled job openings, down two points and historically low, showing little hope for a lower unemployment rate.


