 RSS Feed
 by Calculated Risk on 6/01/2009 04:00:00 PM
Monday, June 01, 2009
Stock Market Update
By popular demand ... Click on graph for larger image in new window.
The first graph shows the S&P 500 since 1990.
The dashed line is the closing price today.
The S&P 500 is up almost 40% from the bottom (267 points), and still off almost 40% from the peak (622 points below the max).
This puts the recent rally into perspective.
Note that the Great Depression crash is based on the DOW; the three others are for the S&P 500.
More on Consumption in April
by Calculated Risk on 6/01/2009 01:18:00 PM
The following graph shows real Personal Consumption Expenditures (PCE) through April (2000 dollars). Note that the y-axis doesn't start at zero to better show the change. Click on graph for larger image in new window.
PCE declined sharply in Q3 and Q4 2008, and rebounded slightly in Q1 2009.
Q2 2009 is off to a weak start, with PCE in April below the levels of Q1. Although it is possible that PCE will pick up in May and June, it seems likely that PCE will be negative in Q2 (although not the cliff diving of the 2nd half of 2008).
Usually PCE and Residential Investment (RI) lead the economy out of recession, and right now both remain weak. As households increase their savings rate to repair their balance sheets, it seems unlikely that PCE will increase significantly any time soon.
Just a reminder - the end to cliff diving is not the same thing as "green shoots".
Construction Spending in April
by Calculated Risk on 6/01/2009 10:17:00 AM
Private residential construction spending is 63.2% below the peak of early 2006.
Private non-residential construction spending is 4.4% below the peak of last September. Click on graph for larger image in new window.
The first graph shows private residential and nonresidential construction spending since 1993. Note: nominal dollars, not inflation adjusted.
Residential construction spending was up slightly in April (compared to March), and nonresidential spending has peaked and will probably decline sharply over the next two years. The second graph shows the year-over-year change for private residential and nonresidential construction spending.
Nonresidential spending is essentially flat on a year-over-year basis, and will turn strongly negative as projects are completed. Residential construction spending is still declining YoY, although the YoY change is starting to be less negative.
As I've noted before, these will probably be two key stories for 2009: the collapse in private non-residential construction, and the probable bottom for residential construction spending. Both stories are just developing ...
From the Census Bureau: April 2009 Construction at $968.7 Billion Annual Rate
Spending on private construction was at a seasonally adjusted annual rate of $657.3 billion, 1.4 percent (±1.3%) above the revised March estimate of $648.2 billion. Residential construction was at a seasonally adjusted annual rate of $249.2 billion in April, 0.7 percent (±1.3%)* above the revised March estimate of $247.4 billion. Nonresidential construction was at a seasonally adjusted annual rate of $408.2 billion in April, 1.8 percent (±1.3%) above the revised March estimate of $400.8 billion.
ISM Manufacturing Shows Contraction in May
by Calculated Risk on 6/01/2009 10:00:00 AM
From the Institute for Supply Management: May 2009 Manufacturing ISM Report On Business®
Economic activity in the manufacturing sector failed to grow in May for the 16th consecutive month, while the overall economy grew for the first time following seven months of decline, say the nation's supply executives in the latest Manufacturing ISM Report On Business®.As noted, any reading below 50 shows contraction, although the pace of contraction has slowed.
...
Manufacturing contracted in May as the PMI registered 42.8 percent, which is 2.7 percentage points higher than the 40.1 percent reported in April. This is the 16th consecutive month of contraction in the manufacturing sector. A reading above 50 percent indicates that the manufacturing economy is generally expanding; below 50 percent indicates that it is generally contracting.
A PMI in excess of 41.2 percent, over a period of time, generally indicates an expansion of the overall economy. Therefore, the PMI indicates growth in the overall economy following seven months of decline, and continuing contraction in the manufacturing sector.
...
"While employment and inventories continue to decline at a rapid rate and the sector continued to contract during the month, there are signs of improvement. May is the first month of growth in the New Orders Index since November 2007, with nine of 18 industries reporting growth. New orders are considered a leading indicator, and the index has risen rapidly after bottoming at 23.1 percent in December 2008. Also, the Customers' Inventories Index remained below 50 percent for the second consecutive month, offering encouragement that supply chains are starting to free themselves of excess inventories as nine industries report their customers' inventories as 'too low'. The prices that manufacturers pay for raw materials and services continued to decline, but at a slower rate than in April."
emphasis added
Consumption Down, Saving Rate Increases in April
by Calculated Risk on 6/01/2009 08:44:00 AM
From the BEA: Personal Income and Outlays, April 2009
Personal income increased $58.2 billion, or 0.5 percent, and disposable personal income (DPI) increased $121.8 billion, or 1.1 percent, in April, according to the Bureau of Economic Analysis. Personal consumption expenditures (PCE) decreased $5.4 billion, or 0.1 percent. ... The pattern of changes in income reflect, in part, the pattern of reduced personal current taxes and increased government social benefit payments associated with the American Recovery and Reinvestment Act of 2009.A few points:
...
Real PCE -- PCE adjusted to remove price changes -- decreased 0.1 percent in April, compared with a decrease of 0.3 percent in March.
...
Personal saving as a percentage of disposable personal income was 5.7 percent in April, compared with 4.5 percent in March.
 Click on graph for large image.
This graph shows the saving rate starting in 1959 (using a three month centered average for smoothing) through the April Personal Income report. The saving rate was 5.7% in April. (5.1% with average)
The saving rate was boosted by the stimulus package, but this suggests households are saving substantially more than during the last few years (when the saving rate was close to zero). The saving rate will probably continue to rise (an aging population usually pushes the saving rate higher) and a rising saving rate will repair household balance sheets, but this will also keep pressure on personal consumption.
Sunday, May 31, 2009
Jim the Realtor: Check out this Backyard!
by Calculated Risk on 5/31/2009 11:34:00 PM
Another video from Jim ... words can't describe this backyard and other, uh, "features" ... although I think the "long jump" pit is for horseshoes.
GM to file Bankruptcy Monday Morning
by Calculated Risk on 5/31/2009 06:47:00 PM
From the Detroit News: GM bankruptcy filing expected 6 a.m. Monday (ht jb)
The Obama administration will name a veteran turnaround expert as chief restructuring officer for General Motors Corp., which plans to file for bankruptcy protection about 6 a.m. Monday in New York ... Al Koch, a managing director at AlixPartners LLP, will be named chief restructuring officer Monday, a government official familiar with the matter said, and will help to wind down GM's "bad" assets that it plans to leave behind in bankruptcy.The WSJ says 8 AM.
Alt-A Foreclosures in Sonoma
by Calculated Risk on 5/31/2009 03:30:00 PM
The Press Democrat: Alt-A loans: Second wave of foreclosures ahead (ht Atrios) reports that there are 18,000 Alt-A mortgages in Sonoma County (about 18 percent of all mortgages). This is a larger percentage of mortgages in Somona County than for subprime - which accounted for about 10 percent of all mortgages in the county at the peak.
According to the story - using First American CoreLogic as a source - about two-thirds of these Alt-A loans will see a significant payment increase over the next few years, with recasts peaking in 2011.
First, I strongly recommend everyone read Tanta's Reflections on Alt-A
Alt-A is sort of a weird mirror-image of subprime lending. If subprime was traditionally about borrowers with good capacity and collateral but bad credit history, Alt-A was about borrowers with a good credit history but pretty iffy capacity and collateral. That is to say, while subprime makes some amount of sense, Alt-A never made any sense. It is a child of the bubble.There is much more ...
...
Alt-A ... overwhelmingly involved the kind of "affordability product" like ARMs and interest only and negative amortization and 40-year or 50-year terms that "ramps" payment streams. But it doesn't do this in order to help anyone "catch up" on arrearages; people with good credit don't have any arrearages. Alt-A was and has always been about maximizing consumption, whether of housing or of all the other consumer goods you can spend "MEW" on. If subprime was supposed to be about taking a bad-credit borrower and working him back into a good-credit borrower, Alt-A was about taking a good-credit borrower and loading him up with enough debt to make him eventually subprime.
Second, most of those Alt-A loans were in mid-to-high priced areas. So the foreclosure crisis will now be moving up the value chain. But unlike the low priced areas where there are more potential first time buyers and cash flow investors waiting for prices to fall, demand in mid-priced areas usually comes from move up and move across buyers. Since a majority of the sellers in low priced areas are lenders (DataQuick reported 57.1 percent of sales in Sonoma in March were foreclosure resales), there will be few buyers for these Alt-A foreclosures.
NY Times: The Fall of the Mall
by Calculated Risk on 5/31/2009 12:16:00 PM
The NY Times has a graphic of the performance of a theoretical mall: The Fall of the Mall (ht Ann, Pat). 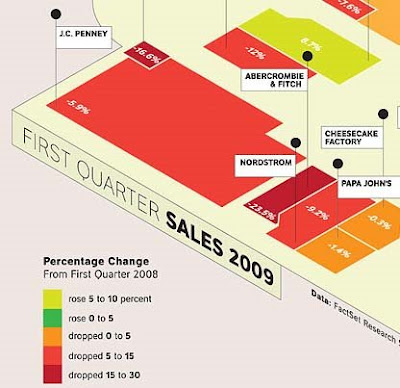 Click on graphic for complete image.
The graphic compares the performance of a number of retailers from Q1 2008 to Q1 2009.
The best performers are a dollar store, a movie theater and a pharmacy.
The worst performers are Saks, Abercrombie & Fitch, Bebe and some others.
This is a theoretical mall where all the retailers are still in business. In reality many stores are vacant, and many malls are dead or dying. See the WSJ: Recession Turns Malls Into Ghost Towns
One industry rule of thumb holds that any large, enclosed mall generating sales per square foot of $250 or less -- the U.S. average is $381 -- is in danger of failure. By that measure, [Eastland Mall in Charlotte] is one of 84 dead malls in a 1,032-mall database compiled by Green Street.
GM Bondholders Agree to Debt-for-Equity, Hummer Sale Near
by Calculated Risk on 5/31/2009 10:12:00 AM
From the NY Times: G.M. Bankruptcy Plan Clears Bondholder Hurdle
General Motors’ bondholders finished voting Saturday on the company’s plan to exchange their debt for an ownership stake ... Bondholders with slightly more than 50 percent of G.M.’s $27.2 billion in bond debt agreed to support the plan by the deadline of 5 p.m ... Bondholders would initially get a 10 percent stake, along with warrants for 15 percent.And the WSJ is reporting that the sale of GM's Hummer brand is near - without details.


