 RSS Feed
 by Calculated Risk on 9/29/2007 02:34:00 AM
Saturday, September 29, 2007
FHA to Ban DAPs
From the WaPo: FHA Down Payment Rule To Ban Seller Financing
The Federal Housing Administration will prohibit borrowers from using seller-financed down payment assistance programs that have helped hundreds of thousands of people buy homes but have come under the scrutiny of federal authorities.One of my earliest posts on this blog concerned credit quality and blasted DAPs. I wrote:
Such programs allow home sellers to give money to charities, which in turn assist buyers with their down payments. The sellers pay the charities a service fee, but often recoup the money by charging a higher price for the homes, usually 2 or 3 percent more, or an amount equal to the down payment, according to a 2005 study by the Government Accountability Office.
In a conference call with reporters, Federal Housing Commissioner Brian Montgomery said the FHA will publish its new rule in the Federal Register on Monday. The rule, which is little changed from a preliminary version put out for comment in May, will go into effect 30 days after publication.
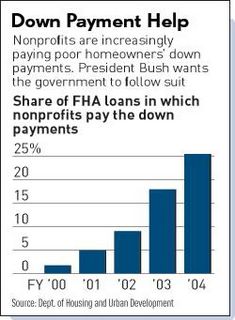
FHA loans are about 10% of all mortgages. They offer a 3% down payment loan - and that is still too much. So non-profit organization step in and pay the downpayment ... OK, actually the seller donates the downpayment to the non-profit and the non-profit gives it to the buyer. Amazing. DAPs were essentially non-existent 4 years ago and now make up 25% of FHA loans! See this chart:Since that chart was published the percentage of FHA loans using DAPs has increased according to the WaPo:
"... seller-financed down payment assistance has accounted for 30 to 50 percent of FHA purchase loans in recent years."And it was over a year ago that the IRS called DAPs a 'scam'. From the WaPo in June, 2006: IRS Ruling Imperils 'Gift Fund' Charities For Home Buyers
A ruling by the Internal Revenue Service threatens to extinguish a fast-growing -- but controversial -- charitable industry that has funneled hundreds of millions of dollars in cash to first-time home buyers for their down payments.It is stunning that it has taken this long to ban this practice. I'm also amazed that the MBA would oppose this ruling:
...
The IRS called the programs "scams" in its ruling last month and said that by providing down payments, the charities actually inflated home prices, making it more likely that homeowners would default on their loans.
The Mortgage Bankers Association ... blasted the ruling. The programs provide "important assistance to cash-strapped borrowers," said Steve O'Connor, the association's senior vice president of public policy.Nonsense.
Friday, September 28, 2007
From the Department of Credit Tightening
by Anonymous on 9/28/2007 06:35:00 PM
Some of you may remember that we (OK, I) picked on Chevy Chase Bank's rate sheet the other day. Bacon dreamz directs me to the cover memo on today's wholesale prices from CCB:

FDIC: Netbank Fails
by Calculated Risk on 9/28/2007 04:58:00 PM
From the FDIC: FDIC Approves The Assumption of The Insured Deposits of Netbank, Alpharetta, Georgia (hat tip Red Pill)
On September 28, 2007, NetBank, Alpharetta, Georgia was closed by the Office of Thrift Supervision and the Federal Deposit Insurance Corporation (FDIC) was named Receiver. No advance notice is given to the public when a financial institution is closed.
...
NetBank, with $2.5 billion in total assets and $2.3 billion in total deposits as of June 30 ...
Estimating PCE Growth for Q3
by Calculated Risk on 9/28/2007 12:54:00 PM
The BEA releases Personal Consumption Expenditures monthly (as part of the Personal Income and Outlays report) and quarterly, as part of the GDP report (also released separately quarterly).
You can use the monthly series to exactly calculate the quarterly change in PCE. The quarterly change is not calculated as the change from the last month of one quarter to the last month of the next (several people have asked me about this). Instead, you have to average all three months of a quarter, and then take the change from the average of the three months of the preceding quarter.
So, for Q3, you would average PCE for July, August and September, then divide by the average for April, May and June. Of course you need to take this to the fourth power (for the annual rate) and subtract one.
The September data isn't released until after the advance Q2 GDP report. But we can use the change from April to July, and the change from May to August (the Two Month Estimate) to approximate PCE growth for Q3. Click on graph for larger image.
This graph shows the two month estimate versus the actual change in real PCE. The correlation is high (0.92).
The two month estimate suggests real PCE growth in Q2 will be about 3.0%.
In general the two month estimate is pretty accurate. Sometimes the growth rate for the third month of a quarter is substantially stronger or weaker than the first two months. As an example, in Q3 2005, PCE growth was strong for the first two months, but slumped in September because of hurricane Katrina. So the two month estimate was too high.
And the following quarter (Q4 2005), the two month estimate was too low. The first two months of Q4 were negatively impacted by the hurricanes, but real PCE growth in December was strong.
You can see a similar pattern in Q3 2001 because of 9/11.
Usually I go with the two month estimate (around 3%), however I think Q3 2007 might be one of the exceptions and real PCE growth could have slowed sharply in September (although maybe not until in October).
Housing: Starts, Sales and Forecasts
by Calculated Risk on 9/28/2007 12:00:00 PM
Hopefully this post will clear up some of the confusion regarding various housing statistics and forecasts. Take a look at the recent Goldman Sachs housing forecast - several people have asked if the numbers are consistent - can the excess inventory be worked off with New Home sales falling to 650K and starts "only" falling to 1.1 million units?
Here is a key point: New Home sales come from a subset of housing starts. Housing starts also include owner built units, rental apartments, and other units that would still not be included, if sold, in the New Home sales report. Click on graph for larger image.
This graph shows total housing starts and new home sales for the last 30 years. Although there are timing problems comparing starts to sales, these are the two most mentioned housing statistics, and this graph clearly illustrates the key point above.
Perhaps it would be helpful to divide starts into two major categories: Starts for homes that will be included in New Home sales, and All Other Starts. Unfortunately the Census Bureau doesn't provide this exact breakdown. But we can estimate "All Other Starts" from the above graph: the median for the last 30 years was 750K, and the minimum was 505K (during the recession of '91).
So, ceteris paribus, if New Home sales fall to 650K, we would expect total starts to fall to 1.4 million units (650K + 750K).
Of course all else isn't equal these days in the housing market - the outlook is especially grim - but perhaps not as grim as some forecasts. I'll post more on this topic this weekend.
August Construction Spending
by Calculated Risk on 9/28/2007 10:15:00 AM
From the Census Bureau: August 2007 Construction Spending at $1,166.7 Billion Annual Rate
The U.S. Census Bureau of the Department of Commerce announced today that construction spending during August 2007 was estimated at a seasonally adjusted annual rate of $1,166.7 billion, 0.2 percent above the revised July estimate of $1,164.4 billion. The August figure is 1.7 percent below the August 2006 estimate of $1,186.3 billion.
During the first 8 months of this year, construction spending amounted to $768.0 billion, 3.3 percent below the $794.0 billion for the same period in 2006.
...
[Private] Residential construction was at a seasonally adjusted annual rate of $522.1 billion in August, 1.5 percent below the revised July estimate of $529.8 billion.
[Private] Nonresidential construction was at a seasonally adjusted annual rate of $353.4 billion in August, 2.3 percent above the revised July estimate of $345.5 billion.
 Click on graph for larger image.
This graph shows private construction spending for residential and non-residential (SAAR in Billions). While private residential spending has declined significantly, spending for private non-residential construction has been strong.
The second graph shows the YoY change for both categories of private construction spending.
 The normal historical pattern is for non-residential construction spending to follow residential construction spending. However, because of the large slump in non-residential construction following the stock market "bust", it is possible there is more pent up demand than usual - and that the non-residential boom will continue for a longer period than normal.
Right now the recent trend is holding: residential construction is declining, but private non-residential construction is still strong.
There's a New Nerd in Town
by Anonymous on 9/28/2007 09:46:00 AM
Via Mr. Coppedge, I see Accrued Interest has a nice UberNerd (AccruederNerd?) on CDO structures that I missed first time around, with a follow-up here that will warm the heart of any poor downtrodden credit analyst who got stomped on by the quants. I recommend it; it makes a point I've tried but dismally failed to make clearly, which is that the big issue for a lot of these deals is timing of default, not level of default. If you're still confused about how a relatively low level of early default can hurt much more than a comparatively higher level of later default on a structured security, this post will certainly help you.
For contextual purposes, here's a set of charts from Moodys that you may ponder. (These are MBS/ABS issues, not CDOs, but they'll be the collateral in a lot of CDOs.) Notice how the slope of the 2006 vintage changes in just six months, as more of the deals in that vintage get old enough. Notice also that this chart is based on original balance (so the numbers won't match anything you see quoted based on current balances), and that the comparison is the 2000-2001 vintage. That's a meaningful comparison because, until 2005-2006 came along, the 2000-2001 vintages were about the ugliest anyone had seen in a long time.

Thursday, September 27, 2007
First Data: $9.4 Billion Sold
by Calculated Risk on 9/27/2007 10:21:00 PM
From the WSJ: Bond Market Starts Showing Relief Signals
... Wall Street investment banks yesterday sold investors $9.4 billion in risky bank loans issued by First Data Corp. to finance its leveraged buyout.Selling loans for 96 cents on the dollar is considered good news in this environment. Maybe Credit Suisse and Citigroup can sell more, and make up the loss with volume!
It was the largest sale of leveraged loans since that of HCA Inc. last year. It was also nearly double the $5 billion in loans the banks said they were attempting to sell.
Still, the underwriters, which include Credit Suisse and Citigroup Inc., hold on their own books the bulk of the $24 billion in loan financing they provided for First Data.
The key number is the $14 billion or so in pier loans. The total deal value was $26 billion with $24 billion in debt. This is still larger than the Chrysler pier loans that were only $10 Billion.
Roubini: "Too Optimistic on Housing"
by Calculated Risk on 9/27/2007 03:03:00 PM
Professor Roubini write: I Was Way Too Optimistic on the Housing Recession...
In March of this year this author published a long paper (with Christian Menegatti) titled “The Housing Recession is Still Far from Bottoming Out” that predicted a much worsening housing recession through all of 2008. In that paper the prediction was that housing starts – that had already fallen by 38% by January of 2007 to a level of 1.4 million - would fall much further and would bottom out at 1.1 million in 2008. Indeed, by looking at previous housing recession – where the average fall in starts was 51% - it was sensible to be that pessimistic. Again those predictions were dismissed as too gloomy and pessimistic and unrealistic.To add to Roubini's comments, here is the current Goldman Sachs housing forecast (New Home sales falling to 650K units and starts falling to 1.1 million units).
But it turned out that I was way too optimistic about housing, not too pessimistic. As recently reported housing starts have now fallen by 42% and now JP Morgan – one of the most respected research houses on Wall Street and a persistent proponent until recently of the view that the housing recession would bottom out – is predicting that housing starts will fall another 25% to a cumulative fall of 56% from peak and will bottom out at 999 thousand units some time in 2008. Compared to my initial March prediction of a bottom at 1.1 million I turn out to be an optimist. And indeed many other research firms (including Goldman Sachs, Citibank and others) are now predicting the bottom of housing starts at 1 million to 1.1 million units. So what in March was considered as borderline lunatic is now becoming conventional wisdom.
...
Right now I see housing start falling more than the 1.1 million that Menegatti and I predicted in March as the housing market has deteriorated since then much more than our then dire predictions. Given the continued fall in building permits and in home sales and the massive excess supply of new and existing homes housing starts could bottom out at level close to previous housing recession, i.e. between 800k and 900k.
Since I predicted a fall in starts to 1.1 million units a couple of years ago, people are now asking if I was also "too optimistic". First, I don't measure my predictions to the WS forecasts, but to the actual numbers. Starts have fallen to 1.331 million units (SAAR) in the latest report, so it is still too early to count coup. Second, I wasn't trying to forecast the exact number, rather the general size of the down turn - IMO there is little difference between 1.1 million starts and, say, 1.0 or 1.2 million starts. The overall downturn is about the same.
However Roubini's new bottom forecast for starts (800K to 900K) is a significant downward revision from his previous forecast. I'll update my forecast at the end of the year (the housing market moves in slow motion, so there is no need to change forecasts frequently). Right now I think my number still looks about right.
Fannie Says Housing Slump to Last Beyond 2008
by Calculated Risk on 9/27/2007 02:46:00 PM
On Bloomberg Video: Mudd of Fannie Says Housing Slump to Last Beyond 2008.
Click image for video.

September 27 (Bloomberg) -- Fannie Mae Chief Executive Officer Daniel Mudd talks with Bloomberg's Peter Cook in Washington about the state of the U.S. housing market, the prospects for raising Fannie's mortgage portfolio cap and the outlook for legislation to create a new regulator for the government-sponsored enterprises. Mudd, whose government-chartered company is the largest provider of money for U.S. home loans, said the housing slump will last beyond next year. (Source: Bloomberg)


