 RSS Feed
 by Anonymous on 5/26/2007 11:17:00 AM
Saturday, May 26, 2007
Saturday Rock Blogging II: Whalen Gets the Willies
May 24 (Bloomberg) -- Merrill Lynch & Co.'s Matthew Whalen, who was responsible for providing lines of credit to mortgage lenders and turning their loans into bonds, said he resigned from the firm earlier this month.
Whalen, 42, was part of a group that helped New York-based Merrill become the largest creator of subprime mortgage bonds just as delinquencies soared. Merrill's $1.3 billion purchase of First Franklin Financial Corp. in December was the biggest of a U.S. home lender to people with poor credit or high debt.
``I waited until the market felt like it was calming down to make my exit,'' Whalen, a managing director who was also responsible for persuading lenders to sell their mortgages to Merrill, said in an interview.
Saturday Rock Blogging: Coast CEO Catches the Bus
by Anonymous on 5/26/2007 08:43:00 AM
In a fairly anti-climactic development Friday, Coast Bank of Florida managed finally to get slapped with a Cease and Desist Order by the FDIC. The share price plummeted 5.7% late in the day, which would have been more dramatic if that didn't equal 17 cents. The CEO, whom everybody but Coast, the FDIC and the CEO had pretty much already decided back in January lacked the ability to run a Christmas Club account, let alone a state-chartered bank, was given a cardboard box to collect the mementos of his 20-year career in banking, which apparently never at the relevant point accrued enough "experience" to enable him to distinguish between a "construction loan" and "speculating with deposits."
Now, to be fair, this wasn't "anti-climactic" to everybody. Apparently Tramm Hudson, the local Florida éminence grise to whom Coast has been paying $25,000 a month in consulting fees since that day in February when the Chairman of the Board was hospitalized for chest pains, was still convinced back on May 12 that a C&D wasn't inevitable:
Jim Schutz, a bank analyst with Birmingham, Ala.-based investment services firm Sterne Agee, said he thought it possible the FDIC will issue a "cease and desist" order to the bank, which may prohibit certain activities including hiring, branch expansion, making certain investments, making acquisitions, or raising certain types of funds, including broker deposits.
Hudson said the expected regulatory action could also be an "MOU," or a "memorandum of understanding," between the bank and regulators which would stipulate "certain agreed-upon actions."
Of course you want to put these things into perspective. According to James K. Toomey, Chairman of the Board of Coast Financial Holdings, Inc.:
“While a C&D order is a directive for the bank to take certain actions, in many respects it may also enhance our plans to resolve recent issues which have impacted the performance of the bank.”
I myself often view a C&D as an "enhancement of the plan." Actually, so does the FDIC:
IT IS HEREBY ORDERED, that the Bank, its institution-affiliated parties, as that term is defined in section 3(u) of the Act, 12 U.S.C. § 1813(u), and its successors and assigns cease and desist from the following unsafe and unsound banking practices and violations of laws and/or regulation:
(a) operating with a board of directors that has failed to provide adequate supervision over and direction to the active management of the Bank;
(b) operating with inadequate management;
(c) operating with inadequate equity capital in relation to the volume and quality of assets held;
(d) operating with an inadequate allowance for loan and lease losses (“ALLL”);
(e) operating with ineffective audit programs;
(f) operating with inadequate oversight of the loan portfolio and concentrations of credit;
(g) operating with an excessive volume of poor quality loans;
(h) following hazardous lending practices and operating with an inadequate loan policy;
(i) operating with inadequate liquidity and funds management;
(j) operating with inadequate strategic planning;
(k) operating in such a manner as to produce low earnings;
(l) operating with excessive exposure to interest rate risk;
(m) operating in violation of laws and regulations and in contravention of Statements of Policy as more fully described on pages 21 through 30 of the Report of Examination dated January 29, 2007 (“Report”); and
(n) operating with an information security program, risk assessment of the Information Technology (“IT”) area, IT audit, and a Disaster Recovery Plan that are inadequate.
Not only did they have an inadequate Plan B, they apparently didn't back it up on a disk, either. But fear not, the consultant is on the case:
"We believe this order provides a good road map for the bank for working through these problems, " spokesman Tramm Hudson said.
There's nothing like a good road map.
Friday, May 25, 2007
Even more on Existing Home Sales
by Calculated Risk on 5/25/2007 02:49:00 PM
For more existing home sales graphs and analysis, please see the previous two posts ...
April Existing Home Sales
More on Existing Home Sales Click on graph for larger image.
One of the rarely mentioned stories, related to the housing boom, was the increase in turnover of existing homes. This graph shows sales and inventory normalized by the number of owner occupied units.
Note: all data is year-end except 2007. For 2007, the April sales rate and inventory are used. For owner occupied units, Q1 2007 data from the Census Bureau housing survey was used for April 2007.
This graph shows the extraordinary level of existing home sales for the last few years, reaching 9.5% of owner occupied units in 2005. The median level is 6.0% for the last 35 years.
Some of the sales were for investment and second homes, but normalizing by owner occupied units probably provides a good estimate of normal turnover. A decline in sales to 6% of owner occupied units would result in about 4.6 million sales. If sales fall back to the level of 1998 to 2001 (7.3% of total owner occupied units sold) that would be about 5.6 million units in 2007.
Also look at inventory as a percent of owner occupied units; an all time record of 5.6%!
And this takes us back to the inventory and months of supply graph from the previous post. As I noted, the 'months of supply' metric is now above the level of the previous housing slump in the early '90s, but still below the levels of the housing bust in the early '80s.
However both the numerator and denominator are moving in the wrong directions. Supply is increasing, and will most likely continue to increase through the summer months. And sales are still high (based on percent of owner occupied units) and will probably continue to fall. Right now I'm expecting 'months of supply' to reach 9.5 months by mid-summer.
More on Existing Home Sales
by Calculated Risk on 5/25/2007 11:24:00 AM
NAR reported that existing home inventories are at record levels today. To put these numbers into perspective, here are the year-end inventory and months of supply numbers, since 1982 (Note: The only data I have is year-end starting in 1982). Click on graph for larger image.
The current inventory of 4.2 million units is an all time record. The "months of supply" metric is now above the level of the previous housing slump in the early '90s, but still below the levels of the housing bust in the early '80s.
The "months of supply" is calculated by dividing the total inventory by the seasonally adjusted annual rate (SAAR) of sales, and multiplying by 12. Currently inventory is 4.2 million, SAAR sales are 5.99 million giving 8.4 months of supply.
Both the numerator and the denominator are moving in the wrong direction. Not only is inventory at record levels, but sales - though falling - are still significantly above the normal range as a percent of owner occupied units (a measure of turnover). See this post from last year Historical: Existing Home Sales and Inventory.
And writing about sales, the followings shows the actual cumulative existing home sales (through April) vs. three annual forecasts for 2007 (NAR's Lereah, Fannie Mae's Berson, and me). My forecast was for sales to be between 5.6 and 5.8 million units (shown as 5.7 million).
To reach the NAR forecast (revised downward on April 11 to 6.34 million units), sales will have to be slightly above 2006 levels for the remainder of the year. Given tighter lending standards, we can probably already say the recent NAR forecast is "no longer operative"!
April Existing Home Sales
by Calculated Risk on 5/25/2007 10:07:00 AM
UPDATE: Added NAR press release.
The National Association of Realtors (NAR) reports Tighter Lending Standards Affect April Existing-Home Sales
Total existing-home sales including single-family, townhomes, condominiums and co-ops fell 2.6 percent to a seasonally adjusted annual rate of 5.99 million units in April from an upwardly revised level of 6.15 million in March, and are 10.7 percent lower than the 6.71 million-unit pace in April 2006.
...
The national median existing-home price for all housing types was $220,900 in April, down 0.8 percent from April 2006 when the median was $222,600.
 Click on graph for larger image.
The first graph shows the NSA sales per month for the last 3 years.
The pattern of YoY declines in sales is continuing. For New home sales, March is usually the strongest sales month of the year. For existing homes, the Summer months are more critical.

The second graph shows the months of supply. With the months of supply now over 8 months, we should expect falling prices nationwide. The NAR reports that YoY prices fell again in April.
 The third graph shows nationwide inventory for existing homes. According to NAR, inventory increased to a record 4.2 million units in April.
Total housing inventory rose 10.4 percent at the end of April to 4.20 million existing homes available for sale, which represents a 8.4 month supply at the current sales pace, up from a 7.4 month supply in March.I'm surprised that the NAR doesn't mention this is the all time record for inventory (not months of supply though).
All Your Access to Money Are Belong To Us
by Anonymous on 5/25/2007 06:10:00 AM
I have argued that if a mortgage broker isn't acting in a fiduciary capacity, I don't see the point of hiring a broker. It appears I fail to understand this business. From the Wall Street Journal, "Mortgage Brokers: Friends or Foes" (hat tip, yal):
Borrowers often see mortgage brokers as their allies, searching far and wide for just the right home loan at an attractively low price. But many brokers are making it clear they don't see things that way. They are fighting efforts by federal and state politicians to impose a fiduciary duty on them to put their customers' interests first, as lawyers, real-estate agents and financial planners generally are required to do with their clients.
"The mortgage broker does not represent the borrower," says Chris Holbert, president of the Colorado Mortgage Lenders Association. "We sell access to money." The industry group recently opposed language in Colorado legislation that would have required mortgage brokers to act "primarily for the benefit of the borrower." That provision was later deleted. . . .
The National Association of Mortgage Brokers, the main nationwide trade group for brokers, argues that brokers work neither for consumers nor for lenders. Imposing a fiduciary duty would increase the risk of litigation over whether brokers are to blame for loans that go bad, says Joseph Falk, legislative chairman of the association. He adds that the group favors clear disclosures to consumers and no hiding of important details.
I had the idea that "we sell access to money, so you can't sue us" probably didn't make for a winning mission statement, so I wandered over to NAMB's website:
A typical broker has a working relationship with numerous banks and other lenders and provides the consumer with access to hundreds of options when it comes to financing a home. This allows mortgage brokers to provide consumers the most efficient and cost-effective method of obtaining a mortgage that fits the consumer's financial goals and circumstances. Mortgage brokers have helped many consumers, including low-to-moderate income borrowers with less than perfect credit histories, enjoy the benefits of homeownership.
How odd. If you read NAMB's Mission Statement rather carelessly, you'd get the impression that the broker works for the consumer.
Thursday, May 24, 2007
More on April New Home Sales
by Calculated Risk on 5/24/2007 06:20:00 PM
For more graphs, please see my earlier post: April New Home Sales Click on graph for larger image.
The first graph shows New Home Sales vs. Recession for the last 35 years. New Home sales were falling prior to every recession, with the exception of the business investment led recession of 2001. This should raise concerns about a possible consumer led recession in the months ahead.
For Fun: Here is the same graph after the December 2006 sales were reported just a few months ago.
The housing bust was "over".
Ooops!
Once again, this reminds us to take the "just reported" data with a grain of salt.
The third graph compares annual New Home Sales vs. Not Seasonally Adjusted (NSA) New Home Sales through April.
Typically, for an average year, about 35% of all new home sales happen before the end of April. At the current pace, new home sales for 2007 will probably be under 900 thousand - about the same level as the late '90s. This is significantly below the forecasts of even many bearish forecasters.
Fed: Loan Delinquency Rates Increase in Q1
by Calculated Risk on 5/24/2007 05:31:00 PM
 Click on graph for larger image.
The Federal Reserve reports that delinquency rates at U.S. commercial banks increased in Q1 for all types of real estate loans. For residential real estate, the delinquency rate increased to 2.04% from 1.94% in Q4 2006. For commercial real estate, the delinquency rate increased to 1.37% from 1.29% in Q4.
Housing Revisions
by Calculated Risk on 5/24/2007 11:09:00 AM
Here was the original report for April 2006. Many analysts claimed housing had bottomed and the recovery was starting.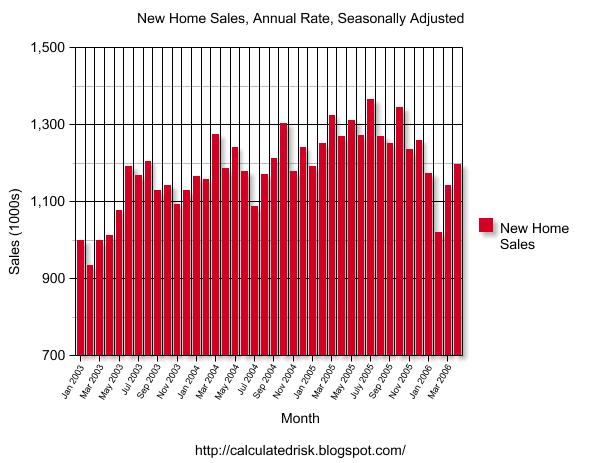
Click on Graph for larger image.
NOTE: The graph starts at 700 thousand units per month to better show monthly variation.
Originally the Census Bureau reported a significant increase in sales for both March and April 2006.
Here is the graph today. The "recovery" in March and April 2006 has been revised away.
I expect the April 2007 sales number to be revised downwards too.
More later today on New Home Sales.
April New Home Sales
by Calculated Risk on 5/24/2007 10:00:00 AM
According to the Census Bureau report, New Home Sales in April were at a seasonally adjusted annual rate of 981 thousand. Sales for March were revised down to 844 thousand, from 858 thousand. Numbers for January and February were revised up.
Click on Graph for larger image.
Sales of new one-family houses in April 2007 were at a seasonally adjusted annual rate of 981,000 ... This is 16.2 percent above the revised March rate of 844,000, but is 10.6 percent below the April 2006 estimate of 1,097,000.
The Not Seasonally Adjusted monthly rate was 92,000 New Homes sold. There were 100,000 New Homes sold in April 2006.
April '07 sales were the lowest since April 2003 (91,000).
The median and average sales prices were up down. Caution should be used when analyzing monthly price changes since prices are heavily revised.
The median sales price of new houses sold in April 2007 was $229,100; the average sales price was $299,100.
The seasonally adjusted estimate of new houses for sale at the end of April was 538,000.
The 538,000 units of inventory is slightly below the levels of the last six months. Inventory numbers from the Census Bureau do not include cancellations - and cancellations are at record levels. Actual New Home inventories are much higher - some estimate about 20% higher.
This represents a supply of 6.5 months at the current sales rate.
This is a surprisingly strong report, and sales will probably be revised down. More later today on New Home Sales.


