 RSS Feed
 by Calculated Risk on 12/14/2006 09:10:00 PM
Thursday, December 14, 2006
Has Nonresidential Construction Peaked?
Most of my focus has been on residential construction and the impending residential construction layoffs. Now is probably the time to start looking for declines in nonresidential construction.
Historically nonresidential investment (including nonresidential construction) has trailed residential investment by about 3 to 5 quarters. Since residential construction spending peaked in December 2005, and residential construction employment peaked in February 2006, it is about time for nonresidential construction to peak - if spending and employment follow the common historical patterns (note: there have been a few exceptions). Click on graph for larger image.
The first graph shows seasonally adjusted private employment for both residential and nonresidential construction. Note that the graph does not start at zero to better show the changes in employment. Source: BLS.
Residential construction employment is clearly trending down, and is probably about to fall "off the cliff". But look at nonresidential construction employment: it is too early to say for sure, but it appears employment might have peaked. Construction spending shows a similar pattern. Private residential construction spending peaked in December 2005, and it appears all other construction spending (public and private nonresidential) might have peaked in August. Source: Census Bureau.
It is early, and these small changes might be normal monthly noise, but since the historical pattern suggests nonresidential construction will probably start declining soon, this might be the first evidence that nonresidential construction has peaked.
DataQuick: Bay Area home prices decline, sales at five-year low
by Calculated Risk on 12/14/2006 01:22:00 PM
DataQuick reports: Bay Area home prices decline, sales at five-year low
Bay Area home prices dipped below year-ago levels in November for the second time in three months as sales held steady at a five-year low, a real estate information service reported.Update: chart added.

The median price paid for a home in the nine-county Bay Area was $616,000 in November. That was 0.3 percent higher than $614,000 in October but down 1.4 percent from $625,000 in November last year, according to DataQuick Information Systems.
Last month's year-over-year decline was the steepest since prices fell 2.1 percent in February 2002.
| Bay Area California Median Home Prices | ||||
| Area | Nov '04 | Nov '05 | Nov '06 | Pct Change |
| Alameda | $500K | $587K | $581K | -1.0% |
| Contra Costa | $474K | $589K | $562K | -4.6% |
| Marin | $739K | $809K | $841K | 4.0% |
| Napa | $535K | $605K | $596K | -1.5% |
| San Francisco | $697K | $749K | $754K | 0.7% |
| San Mateo | $664K | $733K | $726K | -1.0% |
| Santa Clara | $560K | $653K | $665K | 1.8% |
| Solano | $400K | $490K | $446K | -9.0% |
| Sonoma | $472K | $574K | $530K | -7.7% |
| Bay Area | $533K | $625K | $616K | -1.4% |
I added the November 2004 median prices to give a two year perspective on prices.
A total of 7,204 new and resale houses and condos sold in the Bay Area last month. That was down 9.7 percent from 7,979 sales in October, and down 25.9 percent from 9,717 in November last year. A decline from October to November is normal for the season.
Last month's sales count was the lowest for any November since 2001, when 6,644 homes sold. Since 1988, November sales have ranged from 5,579 in 1994 to 10,897 in 2004.
| Bay Area California Homes Sold | ||||
| Area | Nov '04 | Nov '05 | Nov '06 | Pct Change |
| Alameda | 2,251 | 2,009 | 1,441 | -28.3% |
| Contra Costa | 2,179 | 1,961 | 1,406 | -28.3% |
| Marin | 413 | 361 | 268 | -25.8% |
| Napa | 221 | 183 | 125 | -31.7% |
| San Francisco | 616 | 594 | 441 | -25.8% |
| San Mateo | 920 | 756 | 581 | -23.1% |
| Santa Clara | 2,624 | 2,394 | 1,846 | -22.9% |
| Solano | 918 | 774 | 565 | -27.0% |
| Sonoma | 755 | 685 | 531 | -22.5% |
| Bay Area | 10,897 | 9,717 | 7,204 | -25.9% |
Greenspan-Kennedy MEW Graph
by Calculated Risk on 12/14/2006 12:20:00 PM
 Click on graph for larger image.
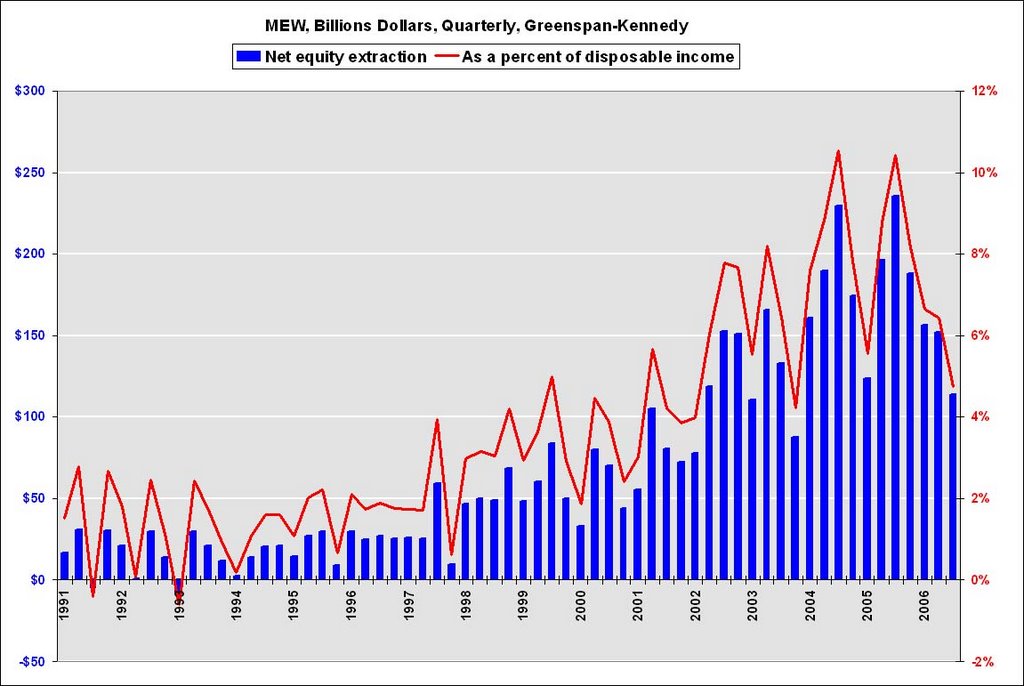
Here is a graph of the Greenspan-Kennedy MEW results, both in billions of dollars quarterly (not annual rate), and as a percent of personal disposable income.
Wednesday, December 13, 2006
Greenspan-Kennedy: MEW declines in Q3
by Calculated Risk on 12/13/2006 11:57:00 PM
From the WSJ: Homeowners Borrow Less Against Equity in Their Homes, Data Show
Homeowners extracted $113.5 billion ... via mortgage refinancing and other means in the third quarter, the lowest since the fourth quarter of 2003, according to new estimates by a Federal Reserve staffer and former chairman Alan GreenspanMy approach in calculating MEW is very different from the Greenspan-Kennedy method.
That amount ... was down from $151.8 billion in the second quarter, and the high of $235.9 billion recorded in the third quarter of last year. The latest figure equals 4.7% of households' after-tax income, compared to 10.4% in the third quarter of 2005.
The figures were released Wednesday by the Fed. They are based on a statistical system developed by Fed economist James Kennedy and Mr. Greenspan and aren't an official central bank publication. Mr. Kennedy updates the figures regularly but ... future updates may be more sporadic. (See the Kennedy-Greenspan data, Excel required.)
Many economists consider home-equity extraction to have been a major source of consumer purchasing power in recent years ... With price appreciation slowing or turning negative, mortgage rates generally higher, and lending standards tightening, such "extraction" has slowed sharply.
But opinion is divided on what impact that will have on consumer spending. Fed economists, for example, expect slower home price appreciation to restrain spending through the so-called "wealth effect" but are skeptical that the decline in home equity extraction, in and of itself, will have any additional impact.
Surveys have found that a large portion of the money raised through such extraction went to pay down other forms of debt, acquire other assets, or add to the value of the existing home. The proportion spent on other goods and services is small.
There are several minor differences, as an example I don't understand why Greenspan-Kennedy uses total home mortgages (Flow of Funds, table L.218, line 1), including homes owned by businesses. I use household home mortgages (Table B.100, line 32). Although the difference is minor, I thought the goal was to determine the amount of equity extracted available for consumer spending.
The major conceptual difference is that I subtract home improvements from borrowing to calculate MEW. Greenspan-Kennedy doesn't consider home improvements. Looking at the GDP report, any money spent on home improvements is included in "residential investment", and not in personal consumption expenditures. So, if the goal is to determine the impact of MEW on personal consumption, home improvements should not be included.
OTS’s National Housing Forum
by Calculated Risk on 12/13/2006 02:58:00 PM
Videos of speeches and panels are now available here.
I especially recommend Panel 1: Outlook for the U.S. Housing Market (windows media)
DataQuick: Southland home sales slowest since 1997
by Calculated Risk on 12/13/2006 01:59:00 PM
DataQuick reports: Southland home sales slowest since 1997
Southern California home sales remained at their slowest pace in nine years last month as the market continued to rebalance itself after several years of heated activity. Prices are still leveling off, a real estate information service reported. ...

The median price paid for a Southland home was $487,000 last month, up 0.6 percent from $484,000 in October and up 1.7 percent from $479,000 for November a year ago. The year-over-year increase was the lowest since February 1997 when the $160,000 median was up 1.3 percent from $158,000 a year earlier.
| Southern California Median Home Prices | ||||
| Area | Nov '04 | Nov '05 | Nov '06 | Pct Change |
| Los Angeles | $416K | $497K | $510K | 2.6% |
| Orange County | $541K | $616K | $616K | 0.0% |
| San Diego | $487K | $518K | $482K | -6.9% |
| Riverside | $346K | $405K | $426K | 5.2% |
| San Bernardino | $284K | $350K | $380K | 8.6% |
| Ventura | $507K | $612K | $562K | -8.2% |
| Southern California | $415K | $479K | $487K | 1.7% |
I added the November 2004 median prices to give a two year perspective on prices.
A total of 20,388 new and resale homes sold in Los Angeles, Riverside, San Diego, Ventura, San Bernardino and Orange counties last month. That was down 7.8 percent from 22,117 in October, and down 26.2 percent from 27,637 for November a year ago, according to DataQuick Information Systems.
A decline from October to November is normal for the season. Last month's sales count was the lowest for any November since 1997 when 18,305 homes were sold. Since 1988 November sales have ranged from 13,537 in 1991 to last year's 27,637, the average for the month is 21,200.
| Southern California Homes Sold | ||||
| Area | Nov '04 | Nov '05 | Nov '06 | Pct Change |
| Los Angeles | 9,404 | 9,066 | 7,351 | -18.9% |
| Orange County | 3,560 | 3,503 | 2,475 | -29.3% |
| San Diego | 4,350 | 3,937 | 2,987 | -24.1% |
| Riverside | 4,978 | 5,904 | 3,794 | -35.7% |
| San Bernardino | 4,065 | 3,992 | 2,926 | -26.7% |
| Ventura | 1,102 | 1,135 | 855 | -30.8% |
| Southern California | 27,459 | 27,637 | 20,388 | -26.2% |
Mortgage delinquencies jump
by Calculated Risk on 12/13/2006 01:39:00 PM
From MarketWatch: Mortgage delinquencies jump
U.S. homeowners had a harder time keeping up with their mortgage payments in the third quarter, the Mortgage Bankers Association said Wednesday, with the delinquency rate rising to 4.67% from 4.39% in the second quarter. A year ago, 4.44% of mortgage holders were 90 days or more past due on their loans.
The foreclosure rate inched higher in the third quarter, with 1.05% of mortgages in the foreclosure process vs. 0.99% in the second quarter, the MBA said. While delinquency rates on all types of loans rose in the third quarter, it was the subprime category -- loans made to less creditworthy borrowers, that shot up the most to 12.56% from 10.76% a year ago.
"As we expected, in the third quarter delinquency rates increased across the board. However, increases were noticeably larger for subprime loans, particularly for subprime ARMs," said Doug Duncan, chief economist for the MBA.
"This is not surprising given that subprime borrowers are more likely to be susceptible to the cumulative increases in rates we've experienced and the slowing of home-price appreciation that has resulted," Duncan said.
November Retail Sales
by Calculated Risk on 12/13/2006 09:30:00 AM
The November advanced monthly retail sales from the Census Bureau show an increase in sales.
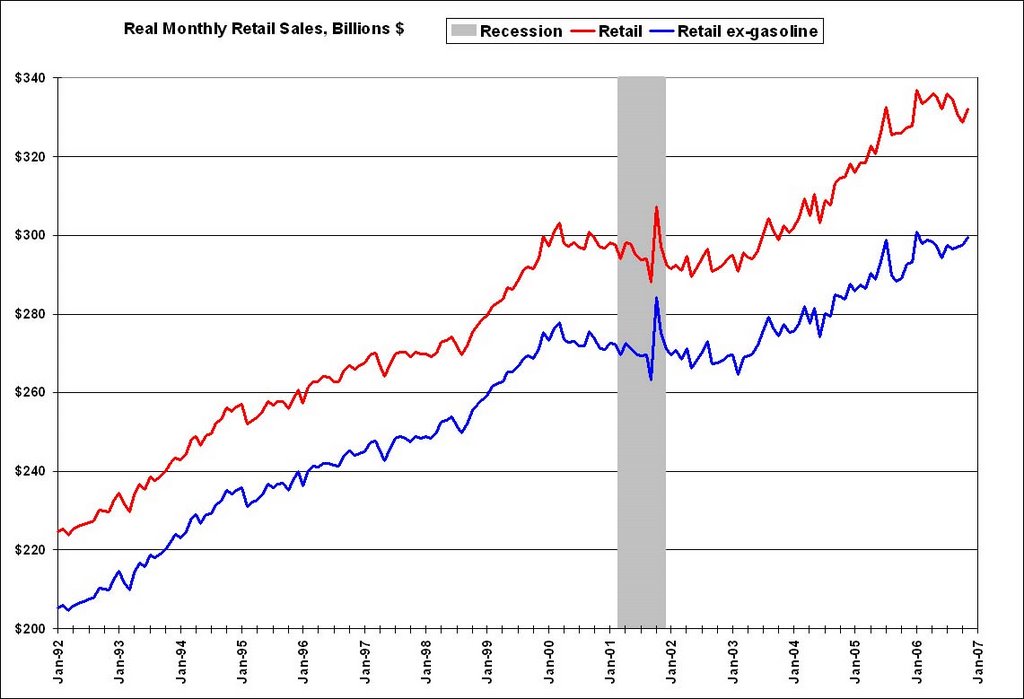
The U.S. Census Bureau announced today that advance estimates of U.S. retail and food services sales for November, adjusted for seasonal variation and holiday and trading-day differences, but not for price changes, were $368.9 billion, an increase of 1.0 percent the previous month and up 5.6 percent from November 2005. Total sales for the September through November 2006 period were up 5.3 percent from the same period a year ago. The September to October 2006 percent change was revised from -0.4 percent to -0.1 percent.The following graph shows real monthly retail sales with and without gasoline stations.
 Click on graph for larger image.
Note: Adjusted using Median CPI from Cleveland Fed, Nov estimated. Graph starts at $200 Billion to show changes.
Although real retail sales bounced back in November, sales are still below the level of a few months ago.
The Fed noted yesterday that "recent indicators have been mixed", and that comment could be applied to almost all the data. Just when it looks like the economy is really slowing down, the MBA data (previous post) and the retail sales show some strength.
MBA: Refinance Applications Hit Highest Levels in Over a Year
by Calculated Risk on 12/13/2006 12:09:00 AM
The Mortgage Bankers Association (MBA) reports: Refinance Applications Hit Highest Levels in Over a Year Click on graph for larger image.
The Market Composite Index, a measure of mortgage loan application volume, was 721.2, an increase of 11.4 percent on a seasonally adjusted basis from 647.6 one week earlier. On an unadjusted basis, the Index increased 10.2 percent compared with the previous week and was up 22.2 percent compared with the same week one year earlier. The Market Index is at its highest level since October 2005.Mortgage rates were mixed:
“The substantial decline in mortgage rates over the past six months, greater than 80 basis points in total, has led to a significant increase in refinance activity. Additionally, we are seeing a steady increase in purchase applications,” said Mike Fratantoni, Senior Economist at the Mortgage Bankers Association.
The seasonally adjusted Refinance Index increased by 15.8 percent to 2304.4 from 1989.7 the previous week and the Purchase Index increased by 8.7 percent to 463.8 from 426.6 one week earlier. The Refinance Index is at its highest level since September 2005 while the Purchase Index is at its highest since January 2006.
The average contract interest rate for 30-year fixed-rate mortgages increased to 6.02 from 5.98 percent ...
The average contract interest rate for one-year ARMs decreased to 5.76 percent from 5.79 ...
 The second graph shows the Purchase Index and the 4 and 12 week moving averages since January 2002. The four week moving average is up 3.1 percent to 424.6 from 411.9 for the Purchase Index.
The refinance share of mortgage activity increased to 52.6 percent of total applications from 50.1 percent the previous week. The refinance share is at its highest level since April 2004. The adjustable-rate mortgage (ARM) share of activity increased to 24.9 from 23.9 percent of total applications from the previous week.With the dramatic drop in the ten year yield, the 30 year mortgage had fallen briefly under 6% two weeks ago. Based on Freddie Mac's monthly data, that was the first time the 30 year rate has been below 6% since September 2005.
Tuesday, December 12, 2006
Construction Related Layoffs
by Calculated Risk on 12/12/2006 09:43:00 PM
From the New Haven Register: Hubbell to cut 1,000 jobs
In a conference call, President and CEO Timothy H. Powers said Hubbell is laying off 1,000 employees in response to plunging demand for its products — electrical, lighting and telecommunications equipment as well as construction materials and test and measurement systems.It appears all sectors of construction are slowing:
"We are seeing weakness in our business, with lower-than-anticipated orders in both residential and non-residential construction and the utility sector," Powers said.
Orders for nonresidential construction, which accounts for 40 percent of Hubbell’s revenues, have slipped in both square footage and contract awards in recent months, the statement said.With the abrupt slowdown, Hubbell has gone from overtime, to standard workweeks, to layoffs in the span of eight weeks:
Residential construction — 15 percent of Hubbell’s business — is showing "more weakness than previously forecast," Powers said.
And the utility sector — 23 percent of Hubbell’s business — is seeing lower order rates, largely due to a quieter than normal storm season.
The broadening slowdown became apparent over the last eight weeks, Powers said.
...
"As little as eight weeks ago we had been pushing very hard in many of our plants to catch up with deliveries that were late, particularly in the lighting area," Powers said. "Then we went from overtime to standard workweeks to layoffs."
...
"We have seen a quite rapid and sudden slowdown across the board," Powers [said]. ... "Residential building is slowing at a rate much faster than everybody predicted, and (a slowdown in lighting sales) has accelerated dramatically. It’s an unpleasant surprise."
 Click on graph for larger image.
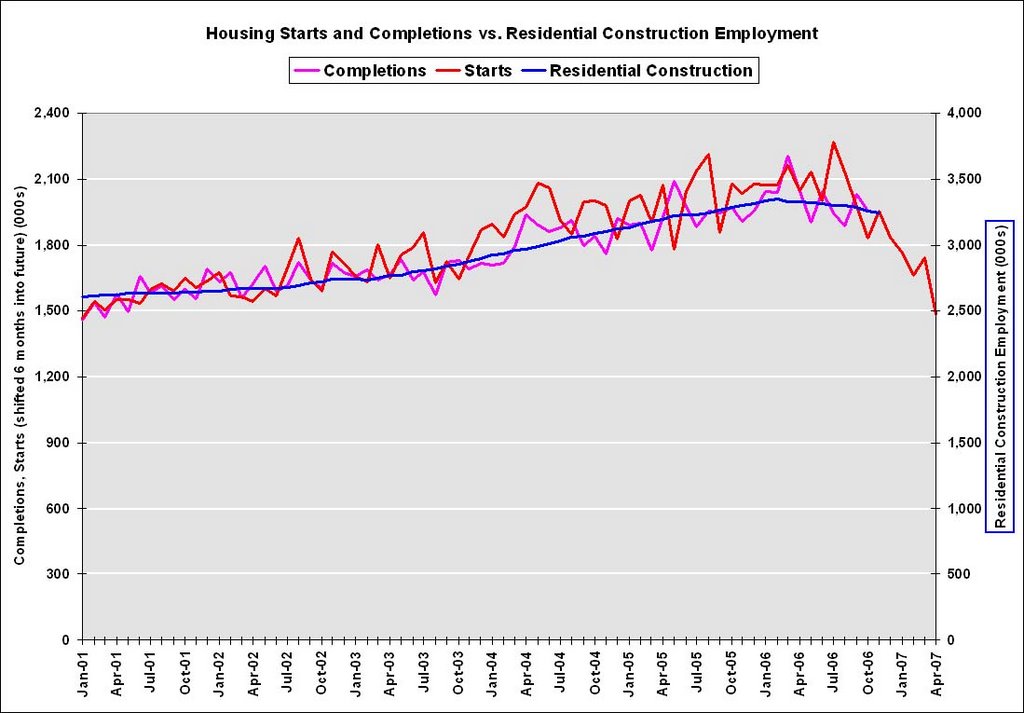
This graph shows housing starts (shifted 6 months into the future), completions and residential construction employment. Residential construction employment tracks completions, and completions follows starts by about 6 months.
Completions were still near record levels in October; just 6 weeks ago. No wonder Hubbell was working their employees overtime. But now completions and employment should follow starts off the cliff, and Hubbell is responding by laying off employees.
Also note that Hubbell reports nonresidential construction is soft.

In Memoriam: Doris "Tanta" Dungey


| Privacy Policy |
| Copyright © 2007 - 2025 CR4RE LLC |
| Excerpts NOT allowed on x.com |